TL;DR#
Current Large Language Models (LLMs) face challenges in consistently applying logical reasoning. This paper investigates whether LLMs can learn and improve by teaching other models (LbT), mimicking human learning where teaching improves both student and teacher. This approach offers a potential solution to continuously improving LLMs without relying on human-created data or stronger pre-trained models.
The researchers propose and evaluate three methods mirroring different levels of LbT. They find that teaching materials designed for easier student learning show improved clarity and accuracy. Furthermore, stronger models benefit from teaching weaker ones, and teaching multiple diverse students proves superior to teaching only one student or the teacher itself. These findings are promising, suggesting that incorporating advanced education methods into LLM training can significantly enhance their capabilities.
Key Takeaways#
Why does it matter?#
This paper is crucial because it explores a novel concept of LLMs learning through teaching, which could revolutionize LLM development by potentially enabling continuous advancement without solely relying on human-produced data or stronger models. It opens new avenues for research into educational techniques for AI improvement and offers valuable insights into the inner workings of in-context learning.
Visual Insights#

🔼 The figure shows a comparison of two learning pipelines: Learning from Teacher (LfT) and Learning by Teaching (LbT). LfT illustrates a traditional knowledge transfer from a teacher LLM to a student LLM. LbT, however, suggests that the teacher LLM can also improve its reasoning ability and knowledge by teaching student LLMs and receiving feedback from them.
read the caption
Figure 1: Left: Learning from teacher aims at improving student LLMs with knowledge from the teacher LLMs. It is the essential idea behind common approaches including knowledge distillation and distillation via synthetic data. Right: In contrast, Learning by teaching aims at improving teacher LLMs through the teaching process using feedback from student LLMs.

🔼 This table summarizes the three methods (M1, M2, and M3) used in the paper, each corresponding to one of the three levels of learning by teaching (LbT). For each method, the table specifies the objective (what the method aims to improve), the pipeline used (the steps involved in the method), and the LbT implementation (how the LbT concept is applied). The table also provides the section abbreviation for where each method is described in detail in the paper.
read the caption
Table 1: The explored M1, M2, M3 methods.
In-depth insights#
LLM Teachability#
The concept of “LLM Teachability” explores the potential of large language models (LLMs) to learn through teaching, mirroring human learning processes. It challenges the conventional paradigm of solely relying on pre-trained models or human-generated data for LLM improvement. This novel approach suggests that LLMs can enhance their reasoning and knowledge by acting as teachers for weaker models. Research into this area focuses on investigating how different LLM architectures and training methods can be leveraged to enable this teacher role and how the feedback from student models can improve the teacher’s capabilities. Key questions revolve around the effectiveness of different teaching strategies, the impact of student diversity on teacher learning, and the overall scalability and efficiency of this approach. Ultimately, “LLM Teachability” aims to unlock a new paradigm for continuous LLM advancement, going beyond the limitations of existing knowledge distillation methods and opening exciting opportunities for future LLM development.
LbT Methods#
The paper explores three main LbT (Learning by Teaching) methods, each mirroring a level of human LbT. Method 1 (M1) focuses on observing student feedback by evaluating teacher-generated rationales based on their effectiveness in guiding students. Method 2 (M2) incorporates learning from student feedback by fine-tuning the teacher model based on the success of its rationales. Method 3 (M3) mimics iterative learning by teaching, where the teacher iteratively refines its teaching materials based on ongoing student feedback. The methods are evaluated on mathematical reasoning and code synthesis tasks, revealing that LbT can improve both the quality of LLM outputs and their inherent reasoning capabilities. The results highlight the potential of LbT for continuous model improvement and the value of employing diverse student models to uncover a wider range of potential teaching material shortcomings.
Weak-to-Strong#
The concept of ‘weak-to-strong’ in the context of large language models (LLMs) is fascinating and holds significant potential. It challenges the traditional paradigm of solely relying on massive datasets or pre-trained, powerful models to improve performance. The weak-to-strong approach suggests that smaller, less capable models (the “weak” models) can play a crucial role in advancing the capabilities of more powerful models (the “strong” models). This might be achieved by having stronger models teach weaker ones, allowing the teacher models to refine their knowledge and reasoning through the feedback process, and iteratively improving their performance. This approach is highly relevant because it opens up new avenues for continuous model improvement without the need for consistently stronger pre-trained models or massive human-generated datasets. This is particularly important as scaling training data becomes increasingly challenging and expensive. Furthermore, it mirrors how human learning and teaching often work; a teacher not only teaches students but also enhances their own understanding through interactions. The inherent potential for synergistic improvement and the potential reduction in the computational cost of training are extremely promising areas for future exploration. The ‘weak-to-strong’ paradigm offers a new perspective on LLM training and improvement, emphasizing the interactive nature of learning and the potential benefits of leveraging diverse student models for mutual advancement.
Iterative LbT#
Iterative Learning by Teaching (LbT) represents a significant advancement in leveraging the power of teaching for AI model improvement. Unlike traditional LfT, which focuses on knowledge transfer from a superior model, iterative LbT emphasizes a cyclical process where the teacher model refines its teaching strategies based on student feedback. This continuous refinement loop allows for more nuanced knowledge building and the identification of subtle weaknesses in the teacher’s reasoning or knowledge representation. The iterative nature of this approach mimics the human learning process, where continuous feedback helps to clarify and strengthen understanding. Furthermore, the incorporation of diverse student models significantly enhances this process, leading to more robust and thorough improvements, allowing the teacher model to overcome a broader range of reasoning limitations. By iteratively adjusting teaching materials in response to diverse feedback, the teacher model not only improves student performance but also enhances its own accuracy and reasoning capabilities. This iterative feedback loop is crucial for achieving a deeper, more robust understanding of both the teaching materials and the underlying concepts being taught.
Future of LbT#
The future of Learning by Teaching (LbT) in LLMs is bright, promising significant advancements in AI. Further research should focus on developing more sophisticated methods for evaluating the quality of teaching materials, moving beyond simple accuracy metrics to encompass factors like clarity, coherence, and pedagogical effectiveness. Exploring diverse student models will uncover a wider range of teaching challenges and refine the teacher’s capabilities. Iterative refinement of teaching strategies through continuous feedback loops is crucial for the development of robust and adaptable LbT systems. Investigating the integration of LbT with other machine learning techniques, such as meta-learning and multi-agent systems, presents exciting avenues for exploration. Finally, addressing potential biases inherent in LbT and establishing ethical guidelines for responsible development and deployment of such systems is critical to ensure the beneficial application of LbT in LLMs.
More visual insights#
More on figures

🔼 This figure illustrates two main pipelines used in the paper to improve LLMs. The first pipeline, search-based output generation, focuses on enhancing answer quality by iteratively generating and evaluating rationales. The second pipeline, generating-scoring-finetuning, aims to improve the model’s inherent reasoning capabilities by using scores from evaluated rationales to refine the model. The figure highlights the components of each pipeline, such as the sampler, evaluator, and aggregator.
read the caption
Figure 2: Two general pipelines for improving the answer quality and model capability. “P” stands for “Problem”; “R” stands for “Rationale”; “A” stands for “Answer”.
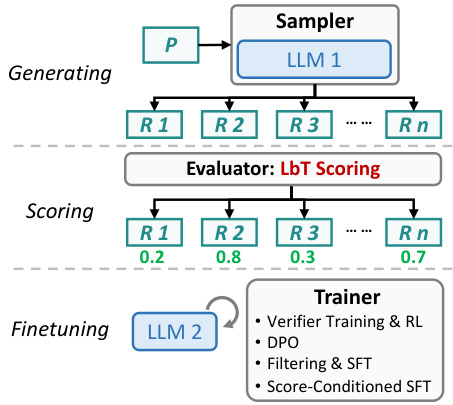
🔼 This figure illustrates two different pipelines for improving LLMs. The first pipeline focuses on improving answer quality using a search-based method that iteratively samples and evaluates rationales to find the best answer. The second pipeline aims to enhance the model’s inherent capabilities by using a ‘generating-scoring-finetuning’ approach. The scores from the evaluator are used for fine-tuning a model to improve its ability to generate better answers and rationales.
read the caption
Figure 2: Two general pipelines for improving the answer quality and model capability. 'P' stands for 'Problem'; “R” stands for “Rationale'; 'A' stands for 'Answer'.

🔼 This figure illustrates the M1 method, which aims to improve LLMs’ answer quality by directly observing students’ feedback. The process begins with a teacher LLM generating multiple teaching rationale (TR) and teaching answer (TA) pairs for a given problem (TP). These pairs are then used as in-context learning (ICL) examples for a student LLM to answer similar exam problems (EPs). The student’s exam answers (EAs) are evaluated, providing LbT scores for each TR-TA pair. Finally, the TA with the highest LbT score is selected as the best answer.
read the caption
Figure 3: M1. The goal is to derive the best TA from the TR-TA pairs generated by the teacher LLM.

🔼 This figure compares two different approaches for fine-tuning a teacher LLM using direct preference optimization (DPO). The left side shows the baseline approach, which uses the correctness of the teaching answer (TA) to score the teaching rationales (TRs) and create preference data for DPO. The right side illustrates the proposed M2 method, which incorporates the Learning by Teaching (LbT) score of the TR and TA pairs to generate the preference data for DPO. The LbT score reflects the ability of the TR-TA pair to effectively teach student LLMs.
read the caption
Figure 5: Baseline vs. M2. Both approaches use scores of TRs to craft preference data and finetune the teacher LLM with DPO. Left: The correctness score of TA. Right: The LbT score of TR and TA.

🔼 This figure illustrates the iterative process of method M3. The process begins with a Teacher LLM generating initial positive and negative examples for in-context learning (ICL). These examples are used to teach a Student LLM to solve Exam Problems (EPs). The Student LLM’s performance is evaluated, and any incorrect answers (Wrong EP+EA) are identified. This feedback is then used to refine the teaching materials. The Teacher LLM uses Prompt Template-2 to generate improved positive and negative examples, creating a refined Teaching Material. This iterative refinement process (steps 1 and 2) continues until the Teacher LLM’s performance on the Teaching Problem (TP) is satisfactory.
read the caption
Figure 6: Overview of M3. The teacher teaches the students through a set of positive and negative ICL examples. These examples are iteratively refined by the teacher according to students' feedback.

🔼 This figure illustrates the difference between the two learning paradigms: Learning from Teacher (LfT) and Learning by Teaching (LbT). LfT focuses on improving student models using knowledge from teacher models, which is common in machine learning. LbT, in contrast, focuses on improving teacher models through the process of teaching and receiving feedback from student models, which is a method inspired by human education. The left side of the image depicts the LfT process, where the teacher LLM provides teaching materials to the student LLM, resulting in an improved student LLM. The right side depicts the LbT process, where the teacher LLM creates teaching materials, receives feedback from the student LLM, and iteratively improves its teaching based on the feedback.
read the caption
Figure 1: Left: Learning from teacher aims at improving student LLMs with knowledge from the teacher LLMs. It is the essential idea behind common approaches including knowledge distillation and distillation via synthetic data. Right: In contrast, Learning by teaching aims at improving teacher LLMs through the teaching process using feedback from student LLMs.

🔼 This figure compares two different learning paradigms: Learning from Teacher (LfT) and Learning by Teaching (LbT). LfT focuses on transferring knowledge from a teacher LLM to a student LLM, using techniques like knowledge distillation. LbT, on the other hand, focuses on how the teacher LLM itself can improve by teaching and receiving feedback from student LLMs. The diagram visually represents the flow of information and improvement in both approaches.
read the caption
Figure 1: Left: Learning from teacher aims at improving student LLMs with knowledge from the teacher LLMs. It is the essential idea behind common approaches including knowledge distillation and distillation via synthetic data. Right: In contrast, Learning by teaching aims at improving teacher LLMs through the teaching process using feedback from student LLMs.

🔼 This figure illustrates the process of method M1 (Observing Students’ Feedback). The teacher LLM generates multiple teaching rationales (TR) and teaching answers (TA) for a given problem (TP). These TR-TA pairs are then used as in-context learning (ICL) examples for student LLMs to solve similar exam problems (EP). The student LLMs provide exam answers (EA) and scores, which are then used to score the TR-TA pairs, ultimately selecting the best TA for the given TP. The evaluation metrics (EPS and EPS-GT) and the LbT scores are also shown.
read the caption
Figure 3: M1. The goal is to derive the best TA from the TR-TA pairs generated by the teacher LLM.

🔼 This figure illustrates the conceptual comparison between two different learning pipelines: Learning from Teacher (LfT) and Learning by Teaching (LbT). LfT shows a common approach in machine learning where knowledge is transferred from a teacher LLM to a student LLM, for example, knowledge distillation. LbT, however, presents a novel approach where the teacher LLM improves by teaching the student LLM and receiving feedback from it.
read the caption
Figure 1: Left: Learning from teacher aims at improving student LLMs with knowledge from the teacher LLMs. It is the essential idea behind common approaches including knowledge distillation and distillation via synthetic data. Right: In contrast, Learning by teaching aims at improving teacher LLMs through the teaching process using feedback from student LLMs.

🔼 This figure illustrates the difference between the traditional learning from teacher (LfT) and the novel learning by teaching (LbT) methods. LfT focuses on transferring knowledge from a teacher LLM to a student LLM, as is commonly done in knowledge distillation. In contrast, LbT focuses on improving the teacher LLM through a teaching process that incorporates feedback from student LLMs, mirroring how human teachers learn from teaching.
read the caption
Figure 1: Left: Learning from teacher aims at improving student LLMs with knowledge from the teacher LLMs. It is the essential idea behind common approaches including knowledge distillation and distillation via synthetic data. Right: In contrast, Learning by teaching aims at improving teacher LLMs through the teaching process using feedback from student LLMs.
🔼 The figure illustrates the difference between the two learning approaches: Learning from Teacher (LfT) and Learning by Teaching (LbT). LfT involves transferring knowledge from a teacher LLM to a student LLM, while LbT involves improving the teacher LLM through the teaching process and feedback from the student LLM. The left side shows a typical LfT pipeline, where the knowledge is directly transferred from the teacher to the student. The right side shows the LbT pipeline where the teacher generates teaching materials, receives feedback from the student, and improves its teaching based on the feedback.
read the caption
Figure 1: Left: Learning from teacher aims at improving student LLMs with knowledge from the teacher LLMs. It is the essential idea behind common approaches including knowledge distillation and distillation via synthetic data. Right: In contrast, Learning by teaching aims at improving teacher LLMs through the teaching process using feedback from student LLMs.
🔼 This figure compares two different approaches in machine learning: Learning from Teacher (LfT) and Learning by Teaching (LbT). LfT involves transferring knowledge from a teacher LLM to a student LLM, as commonly done in knowledge distillation. LbT, conversely, focuses on improving the teacher LLM through the teaching process by using feedback from the student LLMs. This highlights the paper’s key focus on exploring whether LLMs can learn from teaching to improve reasoning abilities.
read the caption
Figure 1: Left: Learning from teacher aims at improving student LLMs with knowledge from the teacher LLMs. It is the essential idea behind common approaches including knowledge distillation and distillation via synthetic data. Right: In contrast, Learning by teaching aims at improving teacher LLMs through the teaching process using feedback from student LLMs.

🔼 This figure illustrates the conceptual comparison of the two learning pipelines: Learning from Teacher (LfT): Knowledge is transferred from a teacher LLM to a student LLM. This is commonly done using techniques like knowledge distillation or distillation via synthetic data. Learning by Teaching (LbT): The teacher LLM improves itself through the teaching process by receiving feedback from student LLMs. This is inspired by how human teachers learn from their students.
read the caption
Figure 1: Left: Learning from teacher aims at improving student LLMs with knowledge from the teacher LLMs. It is the essential idea behind common approaches including knowledge distillation and distillation via synthetic data. Right: In contrast, Learning by teaching aims at improving teacher LLMs through the teaching process using feedback from student LLMs.

🔼 This figure illustrates the conceptual difference between the commonly used Learning from Teacher (LfT) and the proposed Learning by Teaching (LbT) methods. LfT shows a unidirectional flow of knowledge from a teacher LLM to a student LLM, representing established techniques like knowledge distillation. In contrast, LbT depicts a bidirectional process where the teacher LLM improves through interaction and feedback from the student LLM, thus enhancing the reasoning and knowledge of the teacher itself.
read the caption
Figure 1: Left: Learning from teacher aims at improving student LLMs with knowledge from the teacher LLMs. It is the essential idea behind common approaches including knowledge distillation and distillation via synthetic data. Right: In contrast, Learning by teaching aims at improving teacher LLMs through the teaching process using feedback from student LLMs.

🔼 This figure illustrates the conceptual difference between Learning from Teacher (LfT) and Learning by Teaching (LbT). LfT, shown on the left, is a common approach in machine learning where knowledge is transferred from a teacher LLM to a student LLM, improving the student’s performance. This is commonly done through techniques like knowledge distillation. LbT, shown on the right, proposes an alternative where the teacher LLM learns and improves its reasoning abilities through the process of teaching student LLMs and receiving feedback from them. The feedback loop allows the teacher model to refine its teaching strategy and enhance its own knowledge base.
read the caption
Figure 1: Left: Learning from teacher aims at improving student LLMs with knowledge from the teacher LLMs. It is the essential idea behind common approaches including knowledge distillation and distillation via synthetic data. Right: In contrast, Learning by teaching aims at improving teacher LLMs through the teaching process using feedback from student LLMs.
More on tables

🔼 This table presents the results of applying method M1 (one of three methods proposed in the paper for improving LLMs’ reasoning abilities through learning by teaching) on a subset of 181 MATH test problems. The table compares the performance of M1 against a greedy baseline and Self-Consistency (SC) using different teacher and student LLM combinations. The ‘Improv’ column shows the percentage improvement in average performance achieved by the M1 (SUM) method compared to SC.
read the caption
Table 2: Results on 181 MATH test problems with 256 TR-TA pairs. The best results of each row are highlighted in green. The “Improv” column calculates the improvements of average performance achieved by M1 (SUM) over SC.

🔼 This table presents the results of applying method M1 (SUM) on 181 MATH test problems using 256 teacher-student pairs (TR-TA). The table compares the average performance of method M1 against a baseline method (Greedy SC) across several different teacher and student LLM models. The ‘Improv’ column shows the percentage improvement achieved by M1 over the baseline. The best-performing model for each row is highlighted in green.
read the caption
Table 2: Results on 181 MATH test problems with 256 TR-TA pairs. The best results of each row are highlighted in green. The “Improv” column calculates the improvements of average performance achieved by M1 (SUM) over SC.

🔼 This table presents the results of the M2 method on 500 MATH test problems using greedy decoding. It compares the original performance of the LLaMA3-8B model (‘Original’) against two fine-tuned versions: one using correctness-based direct preference optimization (‘Correctness-DPO’) and another incorporating the LbT (Learning by Teaching) score (‘M2’). The ‘M2’ column shows that incorporating the LbT score into the fine-tuning process leads to further improvement in performance compared to using only the correctness score.
read the caption
Table 4: Results on 500 MATH test problems with greedy decoding.

🔼 This table presents the results of experiment M3 on the Liar dataset. It shows the F1 score achieved by the teacher model (LLaMa3-70B) across five iterations (T=1 to T=5) of the iterative refinement process. The results are presented for three different student configurations: only LLaMa3-70B as a student, only LLaMa3-8B as a student, and both LLaMa3-70B and Mistral-7B as students. The table highlights the best-performing student configuration in each iteration.
read the caption
Table 5: Teacher's F₁ score of M3 on combined Liar dev and test set at the end of iteration T, where LLaMa3-70B is used as the teacher for all settings. The best results are in bold.

🔼 This table presents the results of applying method M1 (SUM) to 181 MATH test problems, using 256 teacher-student pairs (TR-TA). The table compares the average performance of M1 (SUM) against a self-consistency (SC) baseline. The best performance for each model configuration is highlighted in green. The ‘Improv’ column shows the percentage improvement of M1 (SUM) over SC.
read the caption
Table 2: Results on 181 MATH test problems with 256 TR-TA pairs. The best results of each row are highlighted in green. The “Improv” column calculates the improvements of average performance achieved by M1 (SUM) over SC.

🔼 This table presents the results of the M1 method (Observing Students’ Feedback) on 181 MATH test problems. The experiment used 256 teacher-student pairs (TR-TA). The table shows the performance of various teacher and student LLM models (GPT-4, GPT-3.5, LLaMA, and Mistral) using Greedy, Self-Consistency (SC), and two variants of M1 (M1 (MAX) and M1 (SUM)). The ‘Improv’ column indicates the improvement in average performance of M1 (SUM) compared to SC.
read the caption
Table 2: Results on 181 MATH test problems with 256 TR-TA pairs. The best results of each row are highlighted in green. The “Improv” column calculates the improvements of average performance achieved by M1 (SUM) over SC.

🔼 This table presents the results of applying method M1 (MAX) and M1 (SUM) on a smaller subset of the MATH dataset, consisting of 70 problems with 16 teaching rationale-teaching answer pairs (TR-TA) sampled for each problem. It compares the performance of M1 with Self-Consistency (SC) and self-evaluation methods. The improvements are calculated as the difference in performance between M1 (SUM) and SC.
read the caption
Table A7: Results on 70 MATH problems with 16 TR-TA pairs.

🔼 This table presents the results of applying method M1 (SUM) on 181 MATH test problems, using 256 teacher-student pairs (TR-TA). The table compares the performance of M1 (SUM) against a greedy self-consistency (SC) baseline. The best performance for each row is highlighted, showing the improvements achieved by M1 (SUM) over the SC baseline.
read the caption
Table 2: Results on 181 MATH test problems with 256 TR-TA pairs. The best results of each row are highlighted in green. The “Improv” column calculates the improvements of average performance achieved by M1 (SUM) over SC.

🔼 This table presents the results of the M1 method (Observing Students’ Feedback) on 181 MATH test problems. Each row represents a different teacher-student LLM pair, with the teacher generating 256 teaching rationale-answer pairs. The student uses these pairs to answer similar problems. The table compares the average performance of the student using greedy self-consistency (SC) against the performance of the student when using M1. The ‘Improv’ column shows the percentage improvement in average performance achieved by M1 (SUM) over SC.
read the caption
Table 2: Results on 181 MATH test problems with 256 TR-TA pairs. The best results of each row are highlighted in green. The “Improv” column calculates the improvements of average performance achieved by M1 (SUM) over SC.
🔼 This table presents the results of the M1 method on 181 MATH test problems, using 256 teacher-student pairs (TR-TA). The table compares the performance of M1 (using both the MAX and SUM methods for aggregating rationales) with a greedy self-consistency (SC) baseline, showing the percentage improvement achieved by M1. The best result for each row is highlighted in green.
read the caption
Table 2: Results on 181 MATH test problems with 256 TR-TA pairs. The best results of each row are highlighted in green. The “Improv” column calculates the improvements of average performance achieved by M1 (SUM) over SC.

🔼 This table presents the results of the M1 method (Observing Students’ Feedback) on 181 MATH test problems. The experiment used 256 teacher-student pairs (TR-TA). The table compares the average performance of using greedy self-consistency (SC) with the M1 method (using both MAX and SUM approaches). The ‘Improv’ column shows the percentage improvement of M1 (SUM) over SC. The best result in each row is highlighted in green.
read the caption
Table 2: Results on 181 MATH test problems with 256 TR-TA pairs. The best results of each row are highlighted in green. The “Improv” column calculates the improvements of average performance achieved by M1 (SUM) over SC.
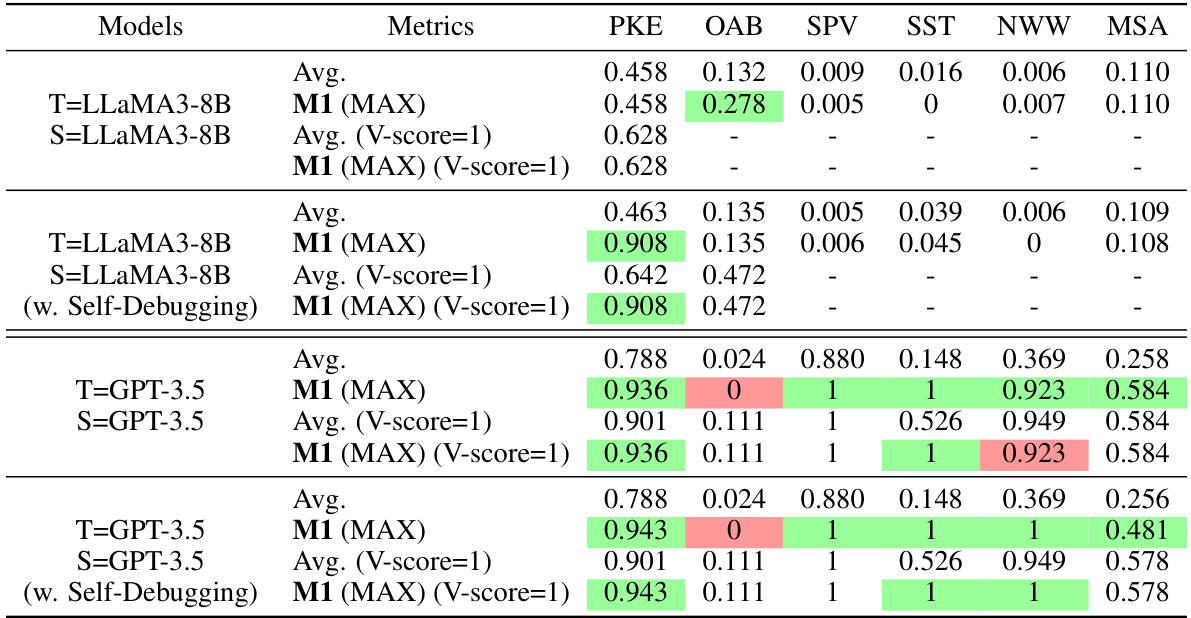
🔼 This table presents the results of applying method M1 (SUM) to 181 MATH test problems, using 256 teacher-student pairs (TR-TA). The table compares the performance of M1 (SUM) against a baseline method (Greedy SC). The best performance for each teacher-student combination is highlighted in green. The ‘Improv’ column shows the percentage improvement of M1 (SUM) over the Greedy SC baseline. This illustrates the effectiveness of M1 in improving the answer accuracy on mathematical reasoning tasks.
read the caption
Table 2: Results on 181 MATH test problems with 256 TR-TA pairs. The best results of each row are highlighted in green. The “Improv” column calculates the improvements of average performance achieved by M1 (SUM) over SC.

🔼 This table presents the results of the M1 method (Observing Students’ Feedback) on 181 MATH test problems. Each row represents a different teacher-student LLM pair, using 256 teaching rationale-teaching answer (TR-TA) pairs. The table shows the average performance of the student LLMs using greedy self-consistency (SC) and M1 (MAX) and M1 (SUM). The ‘Improv’ column displays the percentage improvement in average performance achieved by M1 (SUM) compared to SC. The best result for each row is highlighted in green.
read the caption
Table 2: Results on 181 MATH test problems with 256 TR-TA pairs. The best results of each row are highlighted in green. The “Improv” column calculates the improvements of average performance achieved by M1 (SUM) over SC.

🔼 This table presents the results of the M1 method (Observing Students’ Feedback) on 181 MATH test problems, using 256 teacher-rationale/teacher-answer (TR-TA) pairs. The best-performing method for each model configuration is highlighted in green. The ‘Improv’ column indicates the percentage improvement of the M1 (SUM) method compared to the Self-Consistency (SC) baseline.
read the caption
Table 2: Results on 181 MATH test problems with 256 TR-TA pairs. The best results of each row are highlighted in green. The “Improv” column calculates the improvements of average performance achieved by M1 (SUM) over SC.

🔼 This table presents the results of applying Method 1 (M1) on 181 MATH test problems, using 256 Teacher-Rationale/Teacher-Answer (TR-TA) pairs. The best performance for each model combination (teacher and student) is highlighted in green. The ‘Improv’ column shows the percentage improvement in the average accuracy achieved by using the sum of LbT scores (M1(SUM)) compared to the Self-Consistency (SC) baseline method.
read the caption
Table 2: Results on 181 MATH test problems with 256 TR-TA pairs. The best results of each row are highlighted in green. The “Improv” column calculates the improvements of average performance achieved by M1 (SUM) over SC.

🔼 This table presents the results of the M1 method on 181 MATH test problems, using 256 teacher-rationale/answer (TR-TA) pairs for each problem. It compares the performance of three variants of M1 against a Self-Consistency (SC) baseline. The best result for each row is highlighted in green. The ‘Improv’ column shows the percentage improvement in average performance of M1 (SUM) (a specific variant of M1) over the SC baseline.
read the caption
Table 2: Results on 181 MATH test problems with 256 TR-TA pairs. The best results of each row are highlighted in green. The “Improv” column calculates the improvements of average performance achieved by M1 (SUM) over SC.

🔼 This table presents the results of applying method M1 (SUM) on 181 MATH test problems. Each row shows the results using different teacher and student LLMs, with the best performance highlighted. The ‘Greedy SC’ column represents the baseline using self-consistency. The ‘Improv’ column shows the percentage improvement achieved by M1 (SUM) compared to the baseline.
read the caption
Table 2: Results on 181 MATH test problems with 256 TR-TA pairs. The best results of each row are highlighted in green. The “Improv” column calculates the improvements of average performance achieved by M1 (SUM) over SC.

🔼 This table presents the results of experiment M3, focusing on iterative learning by teaching. It shows the F1 score achieved by the teacher model (LLaMa3-70B) across different iterations (T=1 to T=5) and using different student models (LLaMa3-70B alone, LLaMa3-8B alone, and a combination of LLaMa3-70B/8B and Mistral-7B). The best F1 score for each iteration is highlighted in bold, indicating the impact of iterative refinement based on student feedback.
read the caption
Table 5: Teacher's F1 score of M3 on combined Liar dev and test set at the end of iteration T, where LLaMa3-70B is used as the teacher for all settings. The best results are in bold.
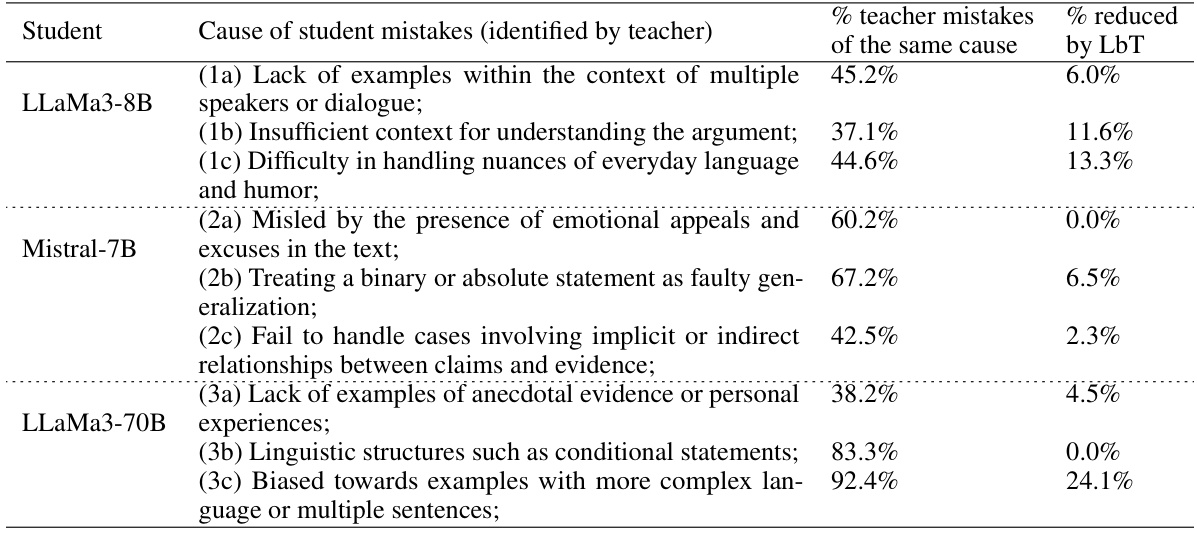
🔼 This table presents the results of the M1 method (SUM) on 181 MATH test problems, using 256 teacher-student pairs (TR-TA). The best-performing model for each teacher is highlighted in green. The ‘Improv’ column shows the percentage improvement in average performance achieved by the M1 (SUM) method compared to the self-consistency (SC) baseline. The table allows comparison of performance across different teacher and student models.
read the caption
Table 2: Results on 181 MATH test problems with 256 TR-TA pairs. The best results of each row are highlighted in green. The “Improv” column calculates the improvements of average performance achieved by M1 (SUM) over SC.
Full paper#


