↗ OpenReview ↗ NeurIPS Homepage ↗ Chat
TL;DR#
Graph Neural Networks (GNNs) often exhibit degree bias, performing better on high-degree nodes. This bias raises concerns about fairness and reliability, particularly in applications like social media recommendations where it might marginalize low-degree actors. Previous attempts to explain this bias have been contradictory and lacked rigorous validation, creating a need for a more comprehensive understanding.
This paper rigorously investigates the roots of degree bias in various GNN architectures. The authors provide theoretical proofs demonstrating why high-degree nodes tend to be more accurate. They identify factors like neighbor homophily and node diversity as contributors and show how training dynamics can also impact low-degree nodes’ performance. Based on these findings, the paper presents a practical roadmap to reduce degree bias, laying the groundwork for fairer and more equitable GNNs.
Key Takeaways#
Why does it matter?#
This paper is crucial for researchers in graph neural networks and related fields. It addresses a significant issue of degree bias, impacting fairness and the reliability of GNNs. The findings provide a strong theoretical foundation for understanding the origins of degree bias and offer a principled roadmap to mitigate it, opening avenues for fairer and more robust GNN applications.
Visual Insights#

This figure shows the relationship between node degree and test loss for three different Graph Neural Network (GNN) architectures (RW, SYM, ATT) on the CiteSeer dataset. The x-axis represents the degree of a node (number of connections), and the y-axis represents the test loss. The plot demonstrates that high-degree nodes consistently have a lower test loss than low-degree nodes, indicating the presence of degree bias in GNN performance. Error bars illustrate the standard deviation across multiple random trials.
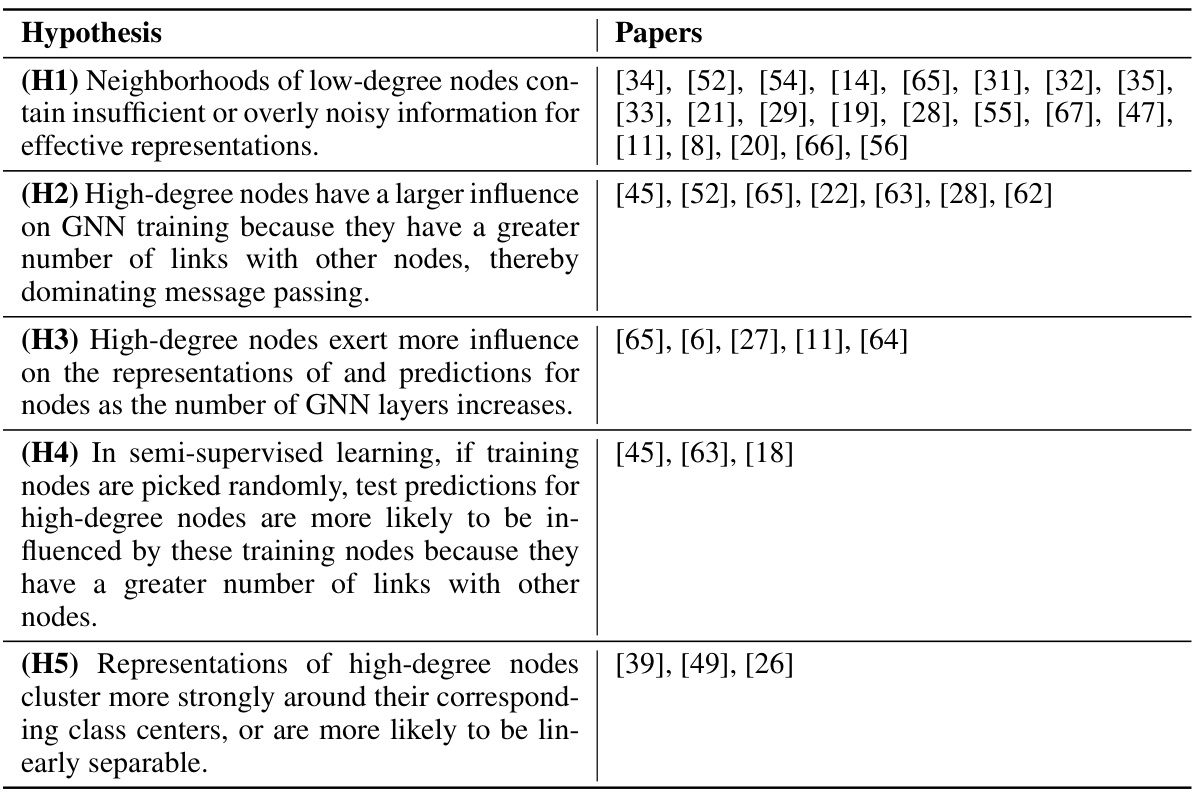
This table provides a comprehensive list of hypotheses explaining the degree bias phenomenon in Graph Neural Networks (GNNs). Each hypothesis is categorized and linked to the papers proposing it. The table is structured to show the different perspectives and potential explanations offered in existing research on GNN degree bias.
In-depth insights#
GNN Degree Bias#
The phenomenon of “GNN Degree Bias” reveals a significant disparity in the performance of Graph Neural Networks (GNNs) based on the degree of nodes. High-degree nodes (those with many connections) tend to be classified more accurately than low-degree nodes. This bias is problematic because it can exacerbate existing inequalities in real-world applications, such as social media or citation networks, where it might unfairly favor influential actors or well-cited papers. The paper investigates the root causes of this bias, exploring several existing hypotheses, which are often contradictory or lack rigorous validation. The authors offer a more comprehensive theoretical analysis that links degree bias to both training and test-time factors, such as the probability of misclassification and the variance of node representations. Their research supports and refines some existing hypotheses while challenging others. They also identify a roadmap for alleviating degree bias, focusing on key factors like the inverse collision probability and prediction homogeneity of low-degree nodes. The overall analysis highlights the importance of understanding and mitigating GNN degree bias to ensure fairness and equitable outcomes in various applications.
Theoretical Analysis#
The theoretical analysis section of this research paper would likely delve into a rigorous mathematical framework to explain the occurrence of degree bias in graph neural networks (GNNs). It would likely involve proving theorems or deriving inequalities that formally connect a node’s degree to its performance, particularly its classification accuracy. Key aspects could include exploring the impact of various graph filter designs (e.g., random walk, symmetric, attention-based) on the probability of misclassifying nodes of different degrees. The analysis might leverage concepts from probability theory, linear algebra, and graph theory to demonstrate how structural properties of the graph and the GNN architecture interact to create this bias. The analysis may also involve a probabilistic analysis of message-passing mechanisms in GNNs, proving how the spread of information during the training process is affected by node degree. Furthermore, the theoretical work may provide a formal justification for several hypotheses proposed in previous works, clarifying the causal relationship between degree and performance. Ultimately, the goal of this section would be to establish a solid theoretical foundation for understanding and potentially mitigating degree bias.
Empirical Findings#
The empirical findings section of a research paper would present the results of experiments designed to test the hypotheses put forth. In the context of degree bias in graph neural networks (GNNs), this section would likely present quantitative results showing the relationship between node degree and performance metrics like classification accuracy or test loss across various datasets. Visualizations, such as plots of test loss versus node degree, would be crucial for illustrating the degree bias. The analysis would likely include a comparison of different GNN architectures and graph filters, demonstrating how the bias manifests differently under varying conditions. Furthermore, the findings might demonstrate the effect of training epochs on the mitigation of degree bias; that is, whether longer training significantly reduces this bias. The robustness of the findings across a range of real-world datasets is essential, lending generalizability to the observations. A comprehensive empirical study will likely address limitations in previous research, potentially identifying conditions where the degree bias is less pronounced or even absent. Statistical significance testing would provide support for the observed trends, ensuring that the results are not due to random chance. Ultimately, a strong empirical section would solidify the paper’s theoretical claims, leading to insightful conclusions about the causes and potential mitigation strategies for degree bias.
Training Dynamics#
The analysis of training dynamics reveals crucial insights into how different graph neural network (GNN) architectures adapt during the learning process. Symmetrically normalized GNNs (SYM) exhibit a slower adjustment of loss on low-degree nodes compared to randomly-walk normalized GNNs (RW), suggesting that low-degree nodes may require more training epochs to converge. This difference in training dynamics underscores the importance of considering the interplay between network structure and algorithm design. The observation of different convergence rates, however, does not indicate a fundamental limitation of SYM in expressiveness. The study empirically shows that SYM, along with RW and attention-based GNNs (ATT), reach their maximum possible training accuracy, thus contradicting claims that expressive power is a major constraint for low-degree node performance. This highlights the complex interplay between training procedures, GNN architecture, and the resulting degree bias. The findings further imply that training time is a critical factor affecting the performance disparity between high- and low-degree nodes. Sufficient training epochs are vital to mitigate this bias, even though it reveals an interesting contrast in the behavior of SYM and RW during training, reinforcing the importance of understanding training dynamics for robust GNN development.
Future Directions#
Future research should prioritize expanding the theoretical analysis beyond linearized models to encompass the complexities of non-linear activation functions, crucial for understanding real-world GNN behavior. Addressing the limitations of current approaches in handling heterophilic graphs is critical, as is exploring how degree bias interacts with other forms of bias or unfairness within the data. Investigating the influence of degree bias in tasks beyond node classification, such as link prediction and graph classification, is also essential. Developing robust and principled mitigation strategies that address both test-time and training-time bias requires further investigation. This includes exploring novel graph filters and training methods that enhance fairness. Finally, exploring the ethical implications of degree bias and fairness in GNNs, particularly its potential for reinforcing societal inequalities, is of paramount importance.
More visual insights#
More on figures

This figure shows the relationship between the degree of nodes and their test loss in a node classification task using three different Graph Neural Network (GNN) architectures: Random Walk (RW), Symmetric (SYM), and Attention (ATT). The x-axis represents the node degree, and the y-axis represents the test loss. The plots demonstrate that, across all three GNN architectures, high-degree nodes tend to have lower test losses compared to low-degree nodes. Error bars, representing the standard deviation, indicate the consistency of this trend across multiple runs with different random initializations.

This figure shows the relationship between node degree and inverse collision probability in the CiteSeer dataset for three different graph neural network models (RW, SYM, and ATT). The x-axis represents node degree, and the y-axis represents the inverse collision probability. The plot demonstrates a strong positive correlation: higher degree nodes tend to have a higher inverse collision probability. This suggests that high-degree nodes are less likely to be misclassified during testing.

The figure shows the relationship between the test loss and node degree for three different Graph Neural Network (GNN) models (RW, SYM, ATT) on the CiteSeer dataset. The x-axis represents the node degree, and the y-axis represents the test loss. Each point represents the average test loss for nodes of a given degree, calculated across 10 different random runs. Error bars show the standard deviation. The graph demonstrates that higher-degree nodes tend to have lower test loss, indicating a degree bias in GNN performance.

This figure shows the relationship between the test loss and the node degree for three different graph neural network (GNN) architectures (RW, SYM, and ATT) on the CiteSeer dataset. The x-axis represents the node degree, and the y-axis represents the test loss. The plot demonstrates that, across all three GNN architectures, nodes with higher degrees tend to have lower test loss. Error bars show the standard deviation across 10 different random seeds, indicating the consistency of the observation.

The figure shows the relationship between test loss and node degree for three different graph neural network models (RW, SYM, and ATT) on the CiteSeer dataset. It demonstrates that high-degree nodes consistently exhibit lower test loss, indicating a degree bias in the performance of these models. The error bars represent the standard deviation calculated across ten independent trials, demonstrating the reliability of the trend.

This figure provides a visual summary of the performance and training dynamics of three different GNN models (RW, SYM, ATT) on the CiteSeer dataset. It shows the distribution of node representations in a 2D PCA space, highlighting differences between low and high-degree nodes. Additionally, it displays the variance of test representations and the training loss curves for both low and high-degree nodes across epochs, demonstrating how the models adjust their loss differently for these node types.
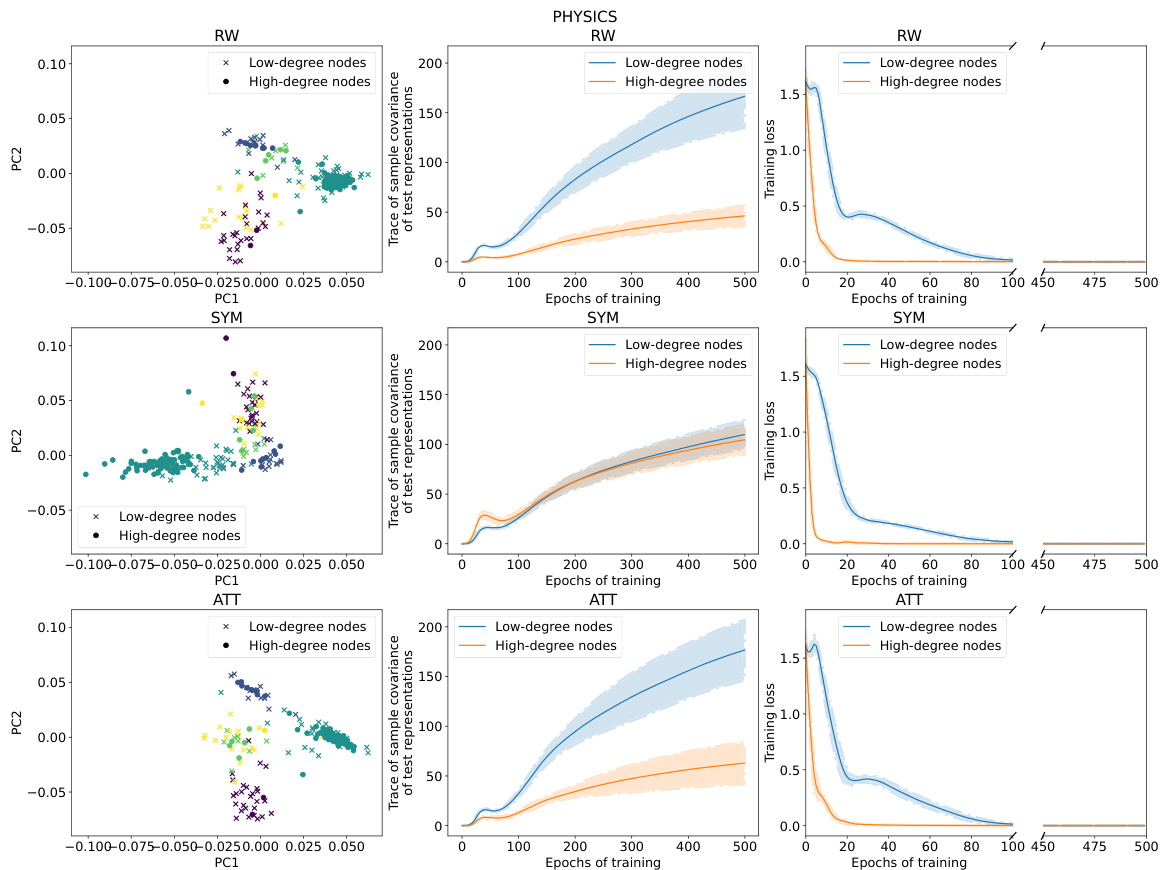
This figure summarizes the results of applying three different graph neural network (GNN) models (RW, SYM, ATT) to the CiteSeer dataset. It shows the distribution of node representations in 2D PCA space, the variance of those representations across different node degrees, and the training loss curves over epochs for low and high degree nodes. The key takeaway is that RW shows higher variance in low-degree node representations, SYM shows lower variance in low degree nodes, and SYM adjusts its training loss on low-degree nodes more slowly than on high-degree nodes.

This figure provides a visual summary of the performance of three different graph neural network (GNN) models (RW, SYM, and ATT) on the CiteSeer dataset. It shows the distribution of node representations in a 2D principal component space, the variance of representations for low-degree and high-degree nodes, and the training loss curves for both types of nodes over 500 epochs. The key observation is that high-degree nodes tend to have lower test loss and less variance in their representation than low-degree nodes, particularly evident with the Random Walk model. The Symmetric model exhibits less rapid training loss adjustment for low-degree nodes compared to the other models. This visualization helps illustrate the core findings of the paper regarding degree bias in GNNs.

This figure provides a visual summary of the performance of three different Graph Neural Network (GNN) models (RW, SYM, and ATT) on the CiteSeer dataset. It showcases the differences in representation geometry (scatter plots), variance in test representations (line plots), and training loss dynamics (line plots) between low-degree and high-degree nodes. The results highlight how RW models show greater variance in representations for low-degree nodes, whereas SYM models exhibit slower training loss adjustments for low-degree nodes. This suggests that SYM might be less prone to degree bias.
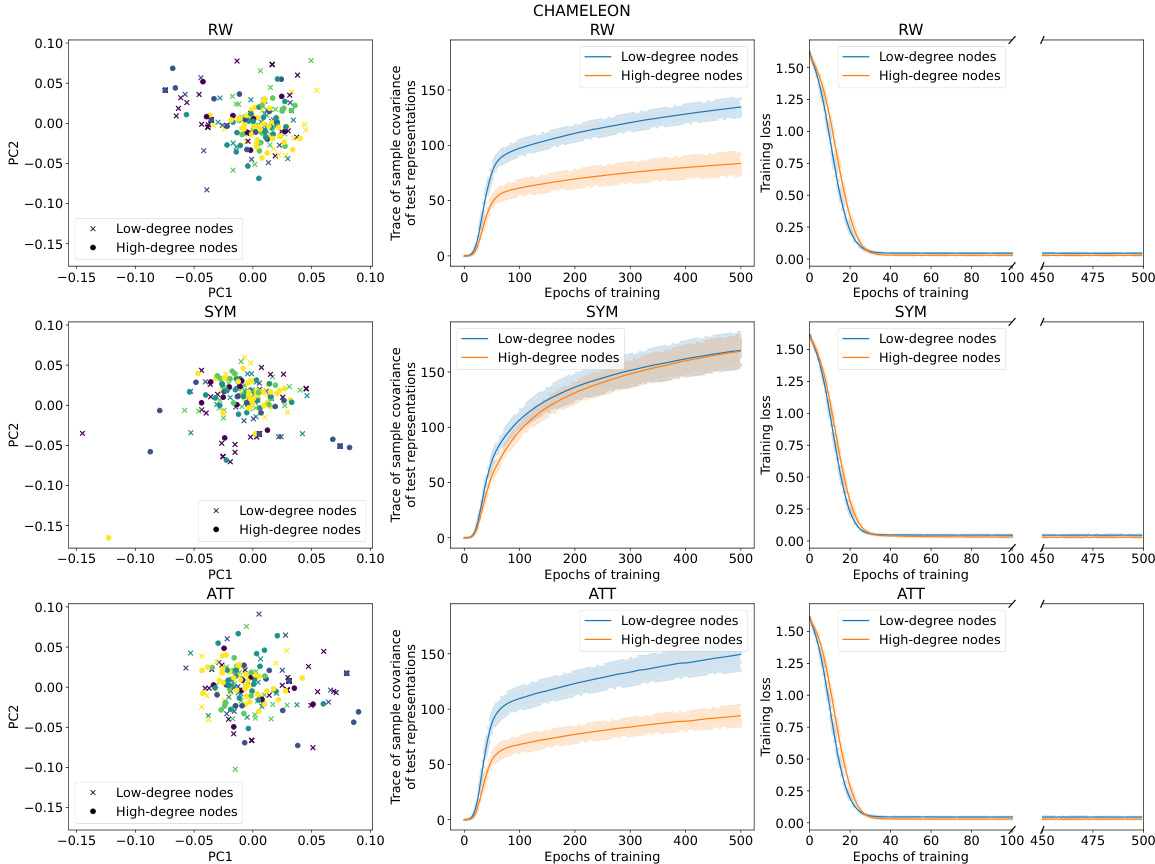
This figure provides a visual summary of the performance of three different GNNs (RW, SYM, ATT) on the CiteSeer dataset. It shows the distribution of node representations in a 2D PCA space, the variance of these representations, and the training loss curves for low-degree and high-degree nodes. The results highlight differences in the behavior of the three GNNs, particularly regarding variance and training speed for low-degree nodes.
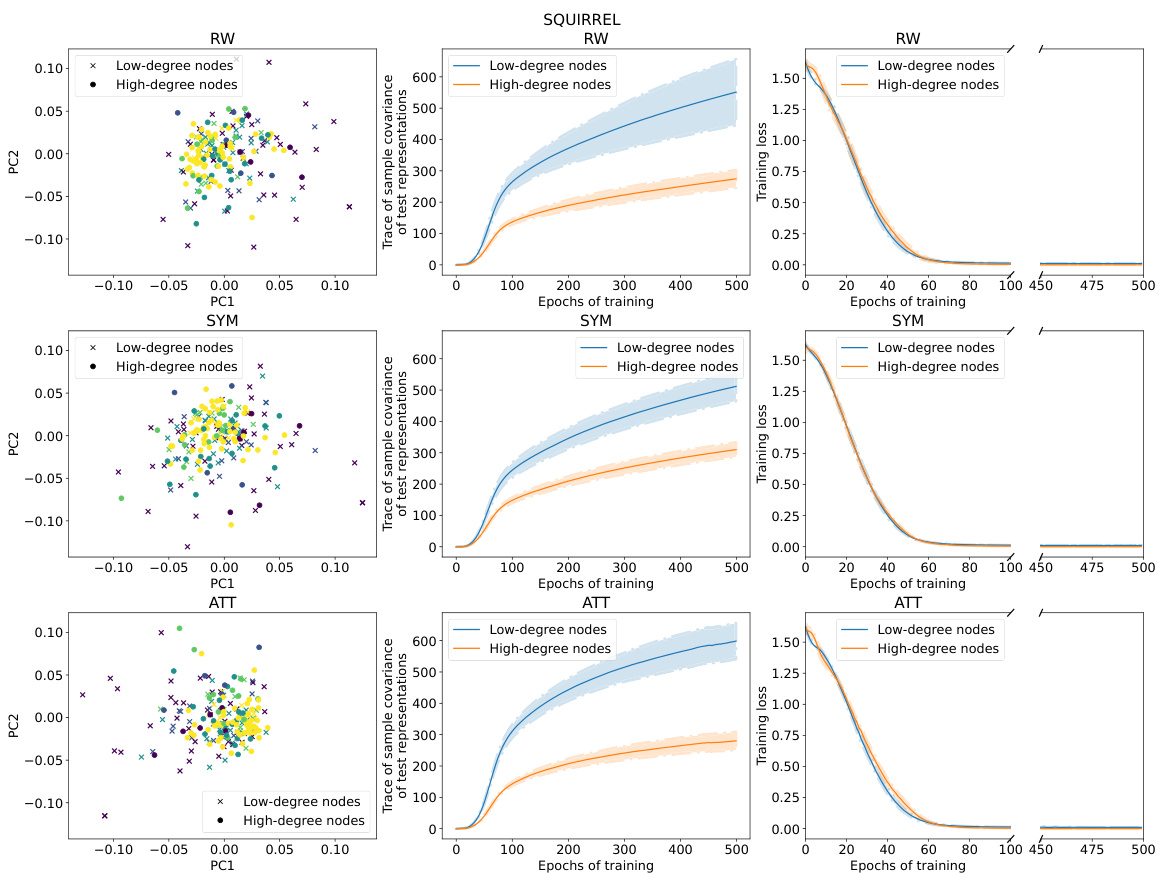
This figure provides a visual summary of the performance characteristics of three different Graph Neural Network (GNN) models (RW, SYM, ATT) on the CiteSeer dataset. The left column shows the distribution of node representations in two principal components, colored by class. The middle column shows the trace of sample covariance of the test representations as a function of training epochs, for low and high-degree nodes. The right column shows the training loss curves for low and high-degree nodes across epochs. The results illustrate differences in representation geometry, variance, and training dynamics between the models and node degree.
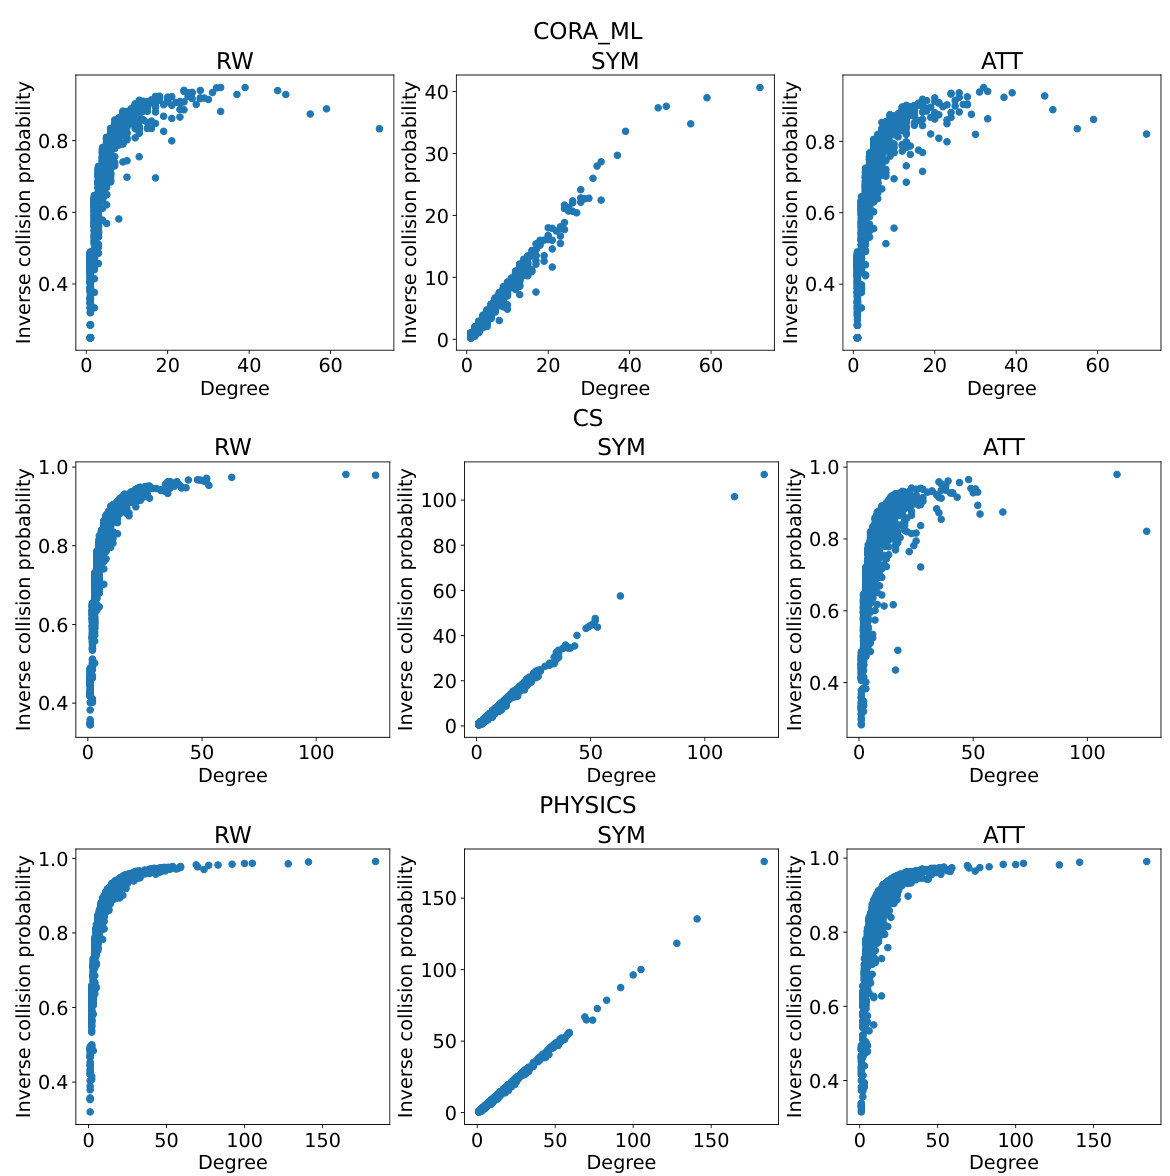
This figure shows the relationship between the inverse collision probability and node degree in the CiteSeer dataset using three different graph neural network models (RW, SYM, and ATT). The inverse collision probability, a measure of node representation diversity, is plotted against the node degree. The plot demonstrates a strong positive correlation, indicating that higher-degree nodes tend to have higher inverse collision probabilities and therefore more diverse representations.

This figure shows the relationship between the inverse collision probability and the node degree for three different graph neural network models (RW, SYM, and ATT) on the CiteSeer dataset. The inverse collision probability is a measure of the diversity of random walks starting from a node. The plot demonstrates that higher-degree nodes tend to have a higher inverse collision probability, indicating a stronger association between node degree and the diversity of random walks.

This figure shows the relationship between the test loss and node degree for three different graph neural networks (RW, SYM, and ATT) on the CiteSeer dataset. The x-axis represents the node degree, and the y-axis represents the test loss. For all three networks, high-degree nodes (nodes with many connections) tend to have lower test loss compared to low-degree nodes. The error bars indicate the standard deviation of the test loss across 10 different random runs of the experiments.
The figure shows the relationship between the test loss and node degree for three different Graph Neural Network (GNN) architectures (RW, SYM, and ATT) on the CiteSeer dataset. It demonstrates that high-degree nodes consistently exhibit lower test loss than low-degree nodes, indicating a degree bias in the performance of GNNs. Error bars represent the standard deviation across multiple random trials.

The figure shows the relationship between the test loss and the node degree for three different Graph Neural Network (GNN) models (RW, SYM, and ATT) on the CiteSeer dataset. The x-axis represents the node degree, and the y-axis represents the test loss. The plot demonstrates that high-degree nodes tend to have lower test losses compared to low-degree nodes. This indicates a degree bias in the GNNs’ performance, where the models perform better on nodes with more connections. Error bars showing the standard deviation are included to indicate the variability of the results across different random seeds.
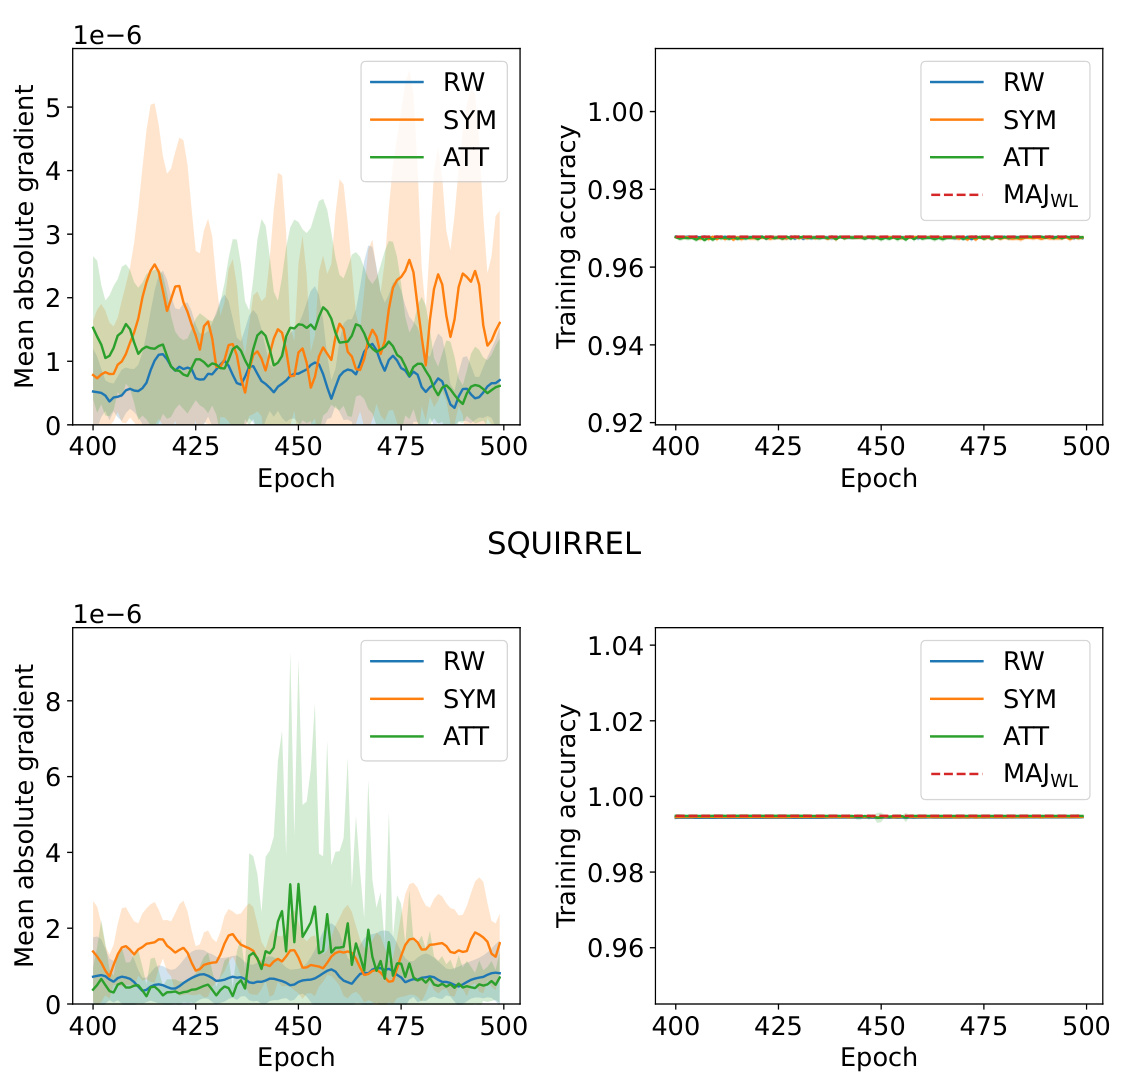
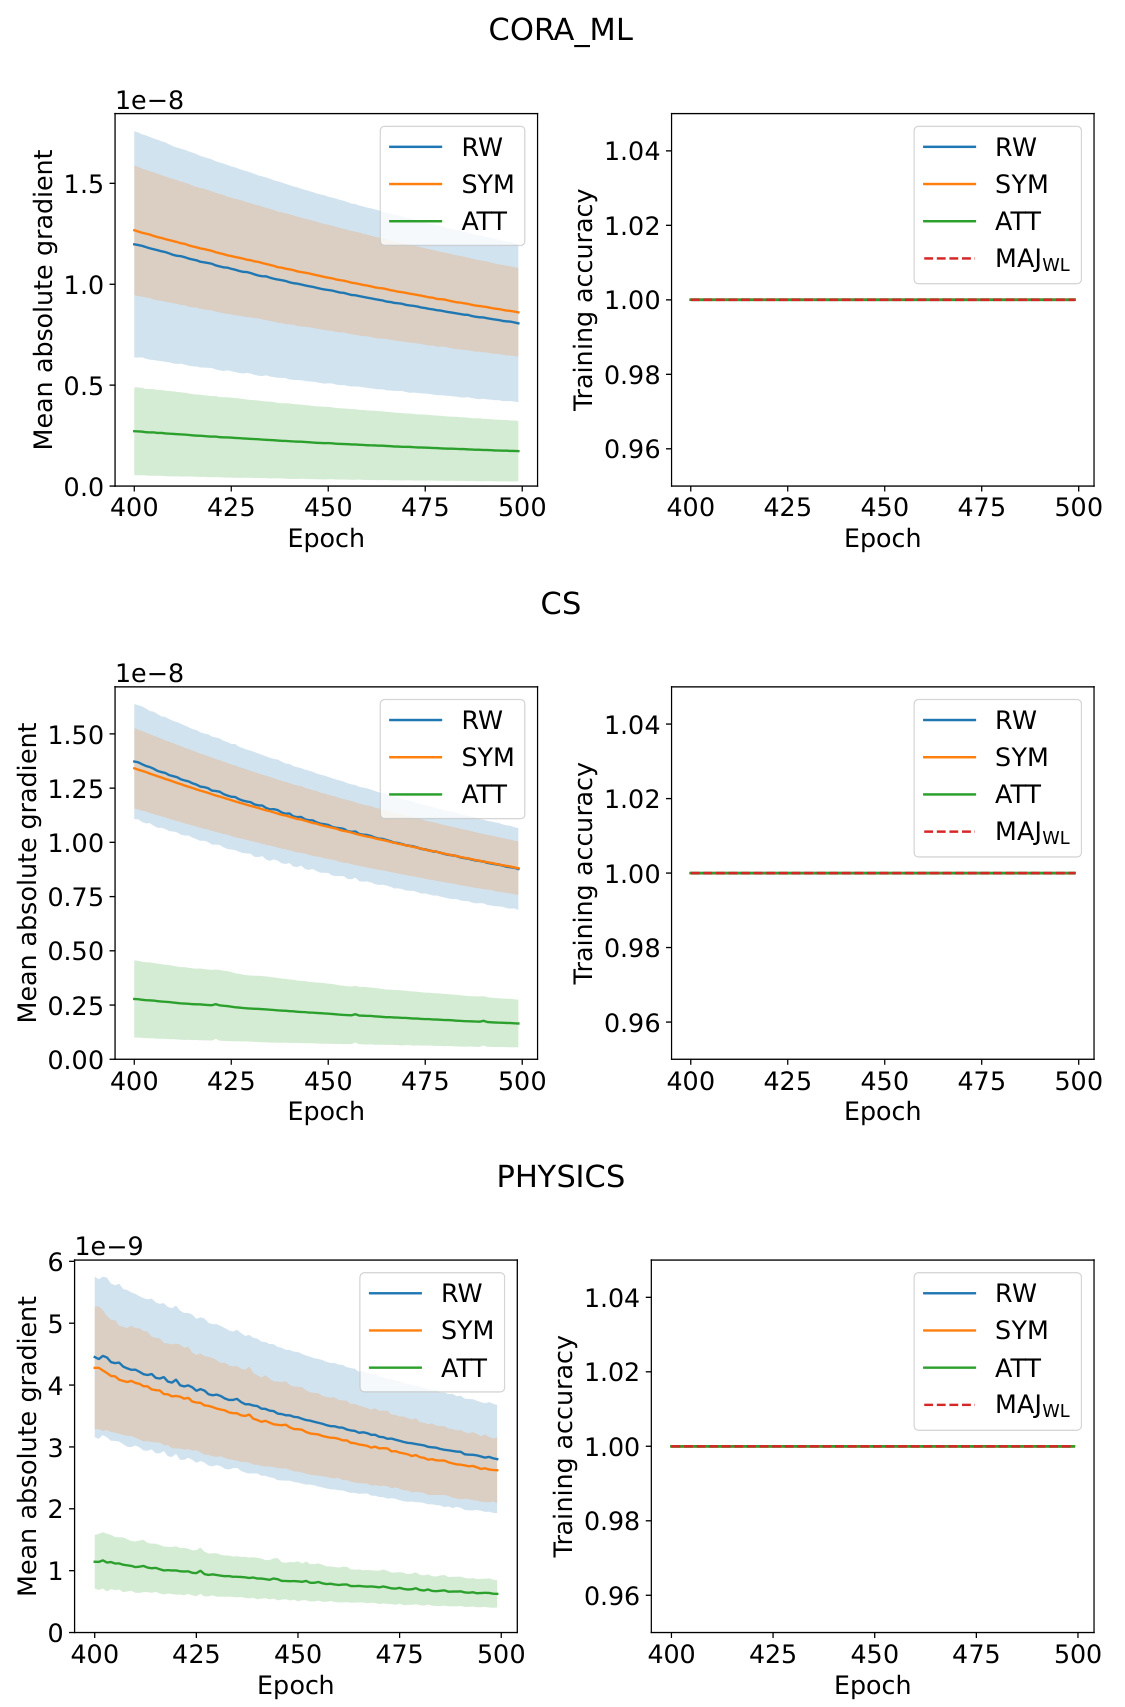
This figure shows the mean absolute parameter gradient and training accuracy for three different GNNs (RW, SYM, ATT) on two datasets (chameleon and squirrel) across training epochs. The plots illustrate the change in model parameters during training and how the training accuracy approaches the accuracy of a majority voting classifier (MAJWL).
More on tables

This table presents a comprehensive list of hypotheses proposed in the literature to explain the phenomenon of degree bias in Graph Neural Networks (GNNs). Each hypothesis offers a potential reason why GNNs tend to perform better on high-degree nodes compared to low-degree nodes. The table also lists the research papers that proposed each hypothesis, providing a valuable resource for further investigation into this topic. The hypotheses range from issues related to the quality and quantity of information available in the neighborhood of low-degree nodes to the influence of high-degree nodes during training and even purely test-time effects.

This table categorizes papers on GNN degree bias based on whether they provide a theoretical analysis that explicitly links a node’s degree to its test and training error. It shows which papers provide such explicit analysis and which do not, allowing for a comparison of approaches to understanding the phenomenon of degree bias in graph neural networks.

This table provides a comprehensive list of hypotheses explaining the origin of degree bias in Graph Neural Networks (GNNs), as proposed in various research papers. Each hypothesis is presented along with the list of papers where it’s mentioned, offering a structured overview of the different perspectives and theories on the matter.
Full paper#


