↗ OpenReview ↗ NeurIPS Homepage ↗ Chat
TL;DR#
Many AI systems, especially those making consequential decisions about humans, are retrained periodically using model-generated annotations. However, humans often act strategically, adapting their behavior in response to these systems. This raises critical questions around the long-term impacts of these retraining processes on both model performance and fairness. The paper highlights risks associated with this common practice, demonstrating that the proportion of agents receiving positive labels can decrease over time, despite an increase in the overall acceptance rate.
To address these issues, the researchers propose a refined retraining process that uses probabilistic sampling for model annotations. This approach aims to stabilize the system dynamics and prevent potentially adverse outcomes. They analyze how algorithmic fairness is affected by retraining, revealing that enforcing standard fairness constraints at each retraining step may not always benefit disadvantaged groups. Experiments using synthetic and real-world datasets validate their theoretical findings, demonstrating the impact of strategic behavior on model retraining and highlighting the need for more sophisticated approaches to data annotation and fairness.
Key Takeaways#
Why does it matter?#
This paper is crucial because it addresses the critical issue of automating data annotation in social domains where human behavior is strategic. It offers a novel framework for understanding long-term impacts of model retraining with strategic feedback, informing the development of more robust and fair AI systems. The findings are directly relevant to current trends in AI fairness and data feedback loops, opening new avenues for algorithmic fairness research and system design.
Visual Insights#

This figure illustrates the iterative process of updating the training dataset used for retraining the ML model. It shows how the model’s annotations, along with human annotations, are combined to create the new training dataset. The strategic feedback from agents is incorporated into the process by showing how their behavior changes in response to the current model. This continuous feedback and retraining loop is a central component of the paper’s investigation into the long-term impacts of model retraining with strategic human feedback.

The table describes the settings used for generating the synthetic Gaussian dataset used in the experiments. It includes the distributions of the features (PX(Xk)), the conditional probability of the label given the features (P Y|X(1|x)), and the hyperparameters used for the experiments (n, r, T, q0). These parameters control various aspects of the experiment, such as the number of agents, the ratio of human-annotated to model-annotated samples, the number of training rounds, and the initial qualification rate.
In-depth insights#
Strategic Agents’ Impact#
The concept of “Strategic Agents’ Impact” in the context of machine learning models centers on how human users, aware of the model’s decision-making process, adapt their behavior to obtain favorable outcomes. This strategic interaction significantly affects model performance and fairness over time. Humans, acting as strategic agents, may modify their features or actions to increase their likelihood of receiving a positive prediction. This behavior leads to a skewed data distribution that is no longer representative of the true population, ultimately reducing the model’s accuracy and generalizability. Retraining the model with this strategically manipulated data further exacerbates the issue, creating a feedback loop where the model becomes increasingly biased towards rewarding strategic behavior. The long-term effects can be particularly detrimental, with the possibility of decreasing the overall proportion of agents with positive labels while individual agents increasingly receive positive decisions. Addressing this necessitates robust model retraining techniques that mitigate the impact of strategic behavior and maintain model fairness. Strategies like incorporating probabilistic sampling during model annotation or early stopping of retraining processes can help stabilize this dynamic and mitigate the risk of biased outcomes. Furthermore, carefully considering algorithmic fairness constraints throughout the retraining procedure is crucial to minimize potential societal biases and ensure equitable treatment for all agents.
Model Retraining Risks#
Model retraining, while crucial for maintaining high performance in machine learning systems, presents significant risks, especially when dealing with strategic human agents. Continuous retraining can lead to unintended feedback loops, where the model’s updates influence human behavior, creating a dynamic system that’s difficult to predict and control. This may result in unexpected and potentially harmful long-term consequences. For example, a model designed to assess loan applications might inadvertently incentivize applicants to manipulate their profiles, leading to a skewed population and inaccurate model assessment. Furthermore, retraining can exacerbate existing biases and even create new ones, particularly in scenarios where the training data is incomplete or model-annotated samples are used due to cost or time constraints. To mitigate these risks, a thorough understanding of the model-agent interaction dynamics is essential. This includes analyzing how human responses change over time, accounting for any bias in training datasets, and evaluating the impact of different retraining strategies on fairness and overall system performance. Finally, developing methods to stabilize these dynamics and enhance fairness is crucial, such as employing algorithmic fairness constraints during retraining or implementing more sophisticated methods for handling model-annotated samples.
Fairness in Dynamics#
Analyzing fairness within dynamic systems presents unique challenges. Traditional fairness metrics, often designed for static datasets, may be inadequate when populations and models evolve over time. A model deemed fair initially might become unfair as agents strategically adapt their behavior in response. This necessitates the development of time-sensitive fairness metrics that account for evolving data distributions. Furthermore, interventions aimed at restoring fairness at each step may have unintended long-term consequences, potentially exacerbating disparities in the long run. Therefore, understanding how fairness interacts with these dynamic processes is vital, and research should explore both short-term corrective actions and long-term strategies to maintain fairness in the face of evolving data and strategic behavior.
Algorithmic Refinement#
Algorithmic refinement, in the context of machine learning models interacting with strategic human agents, focuses on improving model behavior and mitigating potential negative consequences. Iterative retraining, a core component, involves periodically updating the model with new data, incorporating both human and model-generated annotations. However, naive retraining can lead to undesirable feedback loops where agents strategically adapt, creating skewed data distributions and potentially undermining model performance or fairness. Sophisticated refinement strategies might involve incorporating fairness constraints during retraining, weighting samples differently, or using probabilistic model annotations to reduce bias amplification. The choice of refinement technique is crucial, as it directly influences the long-term dynamics of agent behavior and model accuracy and impacts societal welfare. A key challenge lies in balancing model accuracy with fairness and stability over time to avoid unintended consequences. Successful refinement often necessitates a deep understanding of the interaction between strategic agents and the learning system.
Future Research#
Future research directions stemming from this work on automating data annotation under strategic human agents could explore several key areas. Improving the robustness of the proposed refined retraining process to handle diverse scenarios and noisy data is crucial. This involves exploring more sophisticated probabilistic models and adaptive strategies to stabilize dynamics and enhance fairness. Investigating the long-term effects of different fairness constraints on both the agent population and the model itself warrants further study, especially under various group dynamics. A deeper examination of the interaction between systematic human bias and the model’s bias amplification is needed, potentially employing causal inference techniques. Developing methods to quantify and mitigate the amplification of systematic biases during retraining is a crucial step toward building more equitable AI systems. Finally, extending this framework beyond binary classification to multi-class settings and more complex strategic agent behaviors will unlock more realistic and impactful applications.
More visual insights#
More on figures

This figure shows the evolution of student distribution and the machine learning model over three different time points (t=0, t=5, t=14). Each point represents a student with two features. The green line represents the true classifier, while the black line shows the learned classifier at each time step. The figure illustrates how the learned classifier deviates from the true classifier over time, as students strategically adapt their behaviors in response to the model.

This figure illustrates how the training dataset is updated iteratively in a model retraining process that incorporates feedback from strategic human agents. At each time step t, a model fₜ is trained using a dataset Sₜ, which includes previously collected data (Sₜ₋₁), newly collected model-annotated samples (Sₘ,ₜ₋₁), and newly collected human-annotated samples (Sₒ,ₜ₋₁). The model is then used to make decisions that influence agents’ future behaviors, thus influencing the composition of data in the next time step.

This figure illustrates the retraining process of the ML model and how the acceptance rate increases over time due to strategic feedback from agents. It shows how the model, trained with both human and model-annotated data, becomes more likely to accept agents over time, even though the true proportion of qualified agents might decrease.

This figure illustrates how the training data is updated from time t to time t+1, incorporating feedback from strategic agents. At time t, the model is trained on data from time t and human annotations. Agents respond strategically to the model at time t and their behavior is used to create model annotations at time t+1. At time t+1, the model is retrained with data from time t, human annotations, and model annotations.

This figure visualizes the evolution of student distribution and the machine learning model over time. It shows how the model, retrained with both human and model-annotated data, adapts to strategic student behavior. The black lines represent the learned classifier at different times, while the green lines represent the ground truth. The figure illustrates how the classifier deviates from the ground truth over time, highlighting the challenges of retraining in dynamic strategic settings.

This figure shows how the student distribution and the ML model evolve over time under the model retraining process with strategic feedback. Each student has two features, and the model is retrained with both human and model-annotated samples. Students strategically adapt their behaviors to maximize their chances of getting admitted. The figure shows that over time, the learned classifier deviates from the ground truth.

This figure illustrates the dynamics of the acceptance rate over time as the model is retrained with strategic feedback. It shows how, even with an increase in the proportion of qualified agents in the training dataset, the acceptance rate continues to increase over time due to the model’s adaptation to strategic agent behaviors.

This figure shows how the distribution of students and the performance of the ML model change over time as the model is retrained with both human and model-annotated data. The students strategically adapt their behavior to maximize their chances of being admitted, which in turn affects the model’s accuracy. Over time, the model’s decision boundary deviates more and more from the actual boundary between qualified and unqualified students.

This figure illustrates the increasing acceptance rate over time in a strategic classification setting with model retraining. It shows how the model, retrained with both human and model-annotated data, adapts to strategic agent behavior, leading to an increased acceptance rate (proportion of agents classified as positive) over time, even if the actual proportion of qualified agents might not increase.

This figure shows the evolution of student distribution and the machine learning model over time in a college admission scenario. Each student is represented by two features, and the model is periodically retrained with both human-annotated and model-annotated data. Students strategically adapt their behavior to maximize their chances of admission. The figure demonstrates how the model’s performance deviates from the ground truth over time as students strategically respond to the changing admission policies.

This figure shows how the student distribution and the ML model evolve over time in a college admission scenario. Each student has two features, and the model is retrained periodically with human- and model-annotated data. Students strategically adapt their behaviors to maximize their chances of admission. The figure illustrates that the model’s performance deviates from the ground truth over time as students’ behavior changes.

This figure visualizes the evolution of student distribution and the machine learning model over time. It shows how student distribution changes as they strategically respond to the model’s admission decisions in each round. The model is retrained periodically using human and model-annotated data. The black lines represent the learned classifier, and the green lines represent the ground truth classifier. Over time, the learned classifier deviates from the ground truth classifier, highlighting the model’s instability under strategic behaviors.

This figure illustrates the increasing acceptance rate over time due to model retraining with strategic feedback. It shows how the model’s decisions shift towards accepting more agents, even if the proportion of truly qualified agents might decrease. The key point is the effect of model-annotated samples which may misclassify unqualified agents as qualified, positively influencing the next model’s acceptance rate.

This figure shows the evolution of student distribution and the ML model over time in a college admission scenario. The left, middle, and right panels represent time steps t=0, t=5, and t=14, respectively. Each student has two features. At each time step, a classifier is retrained using human-annotated and model-annotated samples. Students strategically adapt their application packages (features) to maximize their chances of admission (best response). The black lines depict the learned classifier at each time step, while the green lines represent the true, underlying classifier. The figure illustrates how, over time, the learned classifier deviates from the true classifier due to the dynamic interaction between the strategic students and the retraining process.

This figure illustrates the increasing acceptance rate over time as the model is retrained with strategic feedback. It shows how the model’s decision boundary changes and how agents adapt their behaviors to receive favorable outcomes. The example uses circles and squares to show qualified/unqualified applicants, while red/blue denotes admitted/rejected. The evolution of the retraining process, from t to t+1, is also visualized.

This figure illustrates the retraining process and how the acceptance rate increases over time. It shows how the model’s updates affect the agents’ behavior, leading to a higher acceptance rate in subsequent rounds.

This figure illustrates the retraining process and how the acceptance rate increases over time due to strategic behavior of agents and model retraining with model-annotated samples. It shows how the model becomes more likely to accept agents, even if the proportion of truly qualified agents might decrease.
This figure illustrates the retraining process and the increasing acceptance rate over time. It shows how the model, trained on human and model-annotated data, updates its decision-making process, leading to a higher proportion of agents being accepted in each subsequent round.

This figure illustrates the evolution of the acceptance rate over time. It shows how, due to strategic behavior and model retraining with model-annotated data, the model becomes increasingly likely to accept agents, even if the underlying qualification rate may not be increasing. The figure visually depicts the dynamics of agents’ best responses and how model retraining incorporates that feedback, contributing to a higher acceptance rate in later iterations.

This figure illustrates the retraining process and how the acceptance rate increases over time as the model is retrained with strategic feedback. The model is updated with both human and model-annotated data. The plots demonstrate the change in the proportion of qualified and unqualified agents, and the effect of model retraining on agent behavior and acceptance rates.

This figure illustrates how the acceptance rate increases over time in a model retraining process with strategic feedback. It shows how, even with a small initial number of qualified agents, subsequent retraining with model-annotated samples (which may have biases) leads to higher acceptance rates.

This figure illustrates the increasing acceptance rate over time due to model retraining with strategic feedback. It shows how the model’s decisions influence agents’ behavior, leading to a higher proportion of qualified agents in the training data with each iteration, ultimately increasing the acceptance rate.

This figure illustrates the increasing acceptance rate over time in a model retraining process with strategic feedback from agents. It shows how the model becomes more likely to accept agents (increasing acceptance rate) as it’s retrained on data that includes the agents’ strategic responses, even though the proportion of actually qualified agents may decrease.

This figure illustrates the dynamics of acceptance rate in the model retraining process with strategic feedback. It shows how the model gets increasingly likely to make positive decisions as it gets retrained, leading to an increase in the acceptance rate over time. The figure highlights the reinforcing process: agents strategically adapt their behaviors based on the model, leading to an increased proportion of positive labels in the retraining dataset, which further reinforces the tendency to make positive decisions in subsequent rounds.

This figure illustrates the increasing acceptance rate over time as the model is retrained with strategic feedback. It shows how the model’s parameters shift towards accepting a higher proportion of agents, even if the actual qualification rate might decrease. The figure highlights the positive feedback loop between model retraining and agent strategic behavior.

This figure illustrates how the acceptance rate increases over time as the model is retrained with strategic feedback. It demonstrates the positive feedback loop where an increasingly ‘generous’ model leads to more agents strategically modifying their features to receive favorable outcomes, further increasing the proportion of positive labels in the training dataset.

This figure illustrates how the acceptance rate increases over time due to model retraining with strategic feedback. It shows the evolution of the training data and the model’s decisions, highlighting the effect of strategic agent responses and model annotations on the acceptance rate.

This figure illustrates the increasing acceptance rate over time due to model retraining with strategic feedback. It shows how the model’s decision boundary shifts, leading to a higher proportion of agents being classified as positive, even if the proportion of actually qualified agents may decrease.

This figure shows the evolution of student distribution and the ML model over time (t=0, t=5, t=14). Each student has two features, and the model is retrained periodically with human and model-annotated samples. Students strategically adapt their behavior to maximize their chances of being admitted. The figure illustrates how the learned classifier deviates from the ground truth over time, highlighting the impact of strategic behavior and model retraining.

This figure illustrates the increasing acceptance rate over time in a model retraining process with strategic feedback. It visually represents how the model’s decision-making changes in response to strategic agents (those who adjust their actions based on the model’s decisions) and how this dynamic influences the proportion of agents positively labeled. The illustration highlights how the model, updated with model-annotated samples, tends to become increasingly more ’lenient’ over time, accepting a higher proportion of agents, even as the proportion of truly qualified agents may not increase.

This figure illustrates the retraining process and how the acceptance rate increases over time due to strategic behavior of agents. The left panel shows the initial training data, the middle panel shows the agents’ best responses to the model, and the right panel shows the updated training data after retraining, resulting in a higher acceptance rate.

This figure shows the evolution of student distribution and the machine learning model over time. The left panel shows the initial state (t=0), the middle panel shows the state at t=5, and the right panel shows the state at t=14. Each student has two features, and the model is retrained at each time step with human and model-annotated data. Students strategically adapt their behavior to maximize their chances of admission. Over time, the learned model deviates significantly from the true underlying classifier.

This figure illustrates how the acceptance rate increases over time due to the model retraining process. The left plot shows the initial training data, where half of the agents are qualified. In the middle plot, the agents strategically respond to the model, and more of them become qualified. Finally, in the right plot, the model is retrained with both human and model-annotated data, leading to an even higher acceptance rate in the next round.

This figure illustrates the retraining process and how the acceptance rate increases over time. It shows how the model, trained with both human and model-annotated data, becomes more likely to accept agents, even if the proportion of actually qualified agents might decrease.

This figure illustrates how the acceptance rate increases over time as the model is retrained with strategic feedback. It shows the training data at time t, the agents’ best responses at time t+1, and the updated training data at time t+1. The key observation is that the proportion of qualified agents increases with each retraining round, leading to higher acceptance rates.

This figure illustrates how the acceptance rate increases over time due to model retraining with strategic feedback. It shows the transition from time t to t+1, highlighting how the model’s decisions (admissions) affect agent behavior (qualifications). The retraining process incorporates both human and model annotations, leading to an increasing proportion of positively labeled data and thus, a more ‘generous’ classifier.

This figure illustrates how the acceptance rate increases over time due to model retraining with strategic feedback. It shows the evolution of the agent distribution and the classifier’s decision boundary in three time steps (t, t+1, and t+2). The acceptance rate increases because the model becomes more ‘generous’ over time, admitting more agents, even though the true qualification rate may decrease.

This figure illustrates the dynamics of the acceptance rate over time. It shows how the model retraining process with strategic feedback from agents leads to an increasing acceptance rate. The figure uses a visual representation of qualified and unqualified agents and how their classifications change through iterations of retraining.

This figure illustrates the retraining process with strategic feedback. It shows how the acceptance rate increases over time as the model is retrained with both human-annotated and model-annotated data. The figure highlights the impact of strategic agents who adapt their behaviors to receive favorable outcomes.

This figure illustrates how the acceptance rate increases over time due to model retraining with strategic feedback. The model becomes more likely to give positive decisions (admit agents) as it is retrained, even if the actual proportion of qualified agents might decrease.

This figure illustrates the increasing acceptance rate over time due to model retraining with strategic feedback. It shows how the model becomes more generous over time, accepting a higher proportion of agents, even if the true proportion of qualified agents may not increase.

This figure illustrates the retraining process with strategic feedback and shows how the acceptance rate increases over time. It visually depicts the change in the training dataset from t to t+1, highlighting the impact of model-annotated samples and strategic responses on the acceptance rate.

This figure illustrates how the acceptance rate increases over time in the model retraining process with strategic feedback. It shows that even though the actual qualification rate might decrease, the model increasingly accepts more agents due to the positive feedback loop between strategic agents and model retraining.

This figure illustrates the increasing acceptance rate over time as the model is retrained with strategic feedback. It shows how the model becomes more likely to accept agents (even unqualified ones) as it learns from the best responses of strategic agents and model-annotated samples.

This figure illustrates the increasing acceptance rate over time due to model retraining with strategic feedback. It shows how the model becomes more likely to accept agents as it is retrained, even if the proportion of actually qualified agents might decrease.

This figure illustrates how the acceptance rate increases over time due to model retraining with strategic feedback. It shows that even if the true qualification rate of the population decreases, the model’s tendency to accept agents increases as the model is updated.

This figure illustrates how the acceptance rate increases over time as the model is retrained with strategic feedback. It shows how the model becomes more likely to accept agents, even if the proportion of qualified agents decreases.

This figure visualizes the evolution of student data distribution and the machine learning model over time. It shows how the model’s classification boundary changes as it’s retrained with both human and model-annotated data, and how students strategically adapt their behavior to increase their chance of being admitted. The divergence between the learned model and the true underlying distribution is highlighted.

This figure illustrates the retraining process with strategic feedback from agents. It shows how the acceptance rate increases over time as the model is retrained with both human and model-annotated data. The retraining process amplifies the positive decisions for the agents.
This figure shows how the student distribution and the ML model evolve over time (t=0, 5, 14) when the model is retrained with both human and model-annotated data, and students strategically respond to maximize admission chances. Each student has two features. The plot shows the learned classifier (black line) increasingly deviates from the true classifier (green line) over time.
This figure shows how the student distribution and the ML model evolve over time (t=0, 5, 14). Each student has two features. The model is retrained periodically with human and model-annotated data, and students strategically adapt their behavior to maximize their chances of admission. The black lines represent the learned classifier, while the green lines represent the ground truth. Over time, the learned classifier deviates from the ground truth.
This figure illustrates the evolution of the acceptance rate over time due to model retraining with strategic feedback. It demonstrates how the model becomes more ‘generous’ over time, accepting a higher proportion of agents, even if the true qualification rate might decrease.
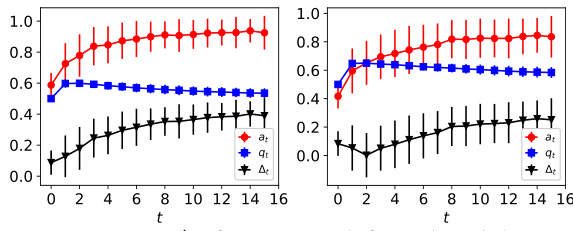
This figure illustrates how the acceptance rate increases over time due to model retraining with strategic feedback. It starts with a training set, then shows how agents strategically respond, and finally how the model is retrained with both human and model-annotated data, leading to a higher acceptance rate in the next round.

This figure illustrates the increasing acceptance rate over time in a model retraining process with strategic feedback. It shows how the model’s annotations, combined with human annotations, shift the training data distribution towards a higher proportion of positively labeled agents in each subsequent retraining round, leading to an increase in the acceptance rate.
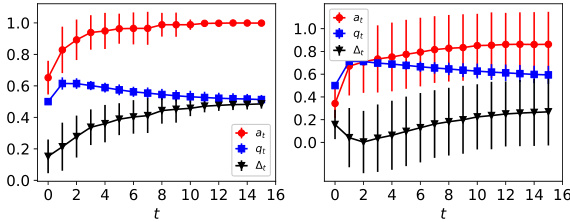
This figure illustrates how the acceptance rate increases over time as the model is retrained with strategic feedback. It shows how the model becomes more likely to give positive decisions to agents, even though the proportion of qualified agents might decrease.

This figure illustrates how the acceptance rate increases over time as the model is retrained with strategic feedback. It demonstrates the positive feedback loop between model updates and agent strategic responses, leading to an increasing proportion of agents receiving positive decisions.
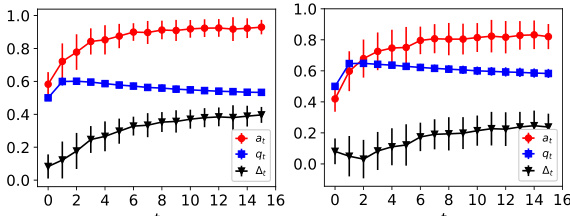
This figure shows how the student distribution and the ML model evolve over time (t=0, t=5, t=14). The model is retrained periodically using human and model-annotated data, and students strategically adapt their behavior to maximize their chances of admission. The figure illustrates that over time, the learned classifier deviates from the true classifier, indicating a potential long-term risk of model retraining with strategic feedback.
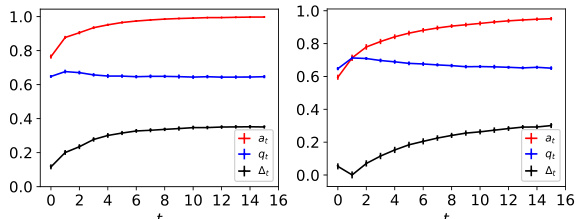
This figure illustrates the increasing acceptance rate over time in a model retraining process with strategic feedback. It shows how the model’s decisions and agents’ strategic responses interact to change the data distribution and ultimately increase the acceptance rate. The model becomes more ‘generous’ over time in admitting agents.
This figure illustrates how the acceptance rate increases over time due to model retraining with strategic feedback from agents. The example shows how the model, initially classifying half the agents correctly, becomes increasingly likely to classify agents as positive (accept them) even if the underlying proportion of qualified agents remains the same or even decreases.
This figure illustrates the increasing acceptance rate over time due to model retraining with strategic feedback. It shows how the model’s annotations, combined with human annotations, shift the distribution of qualified/unqualified agents, leading to a more generous classifier that accepts a higher proportion of agents.
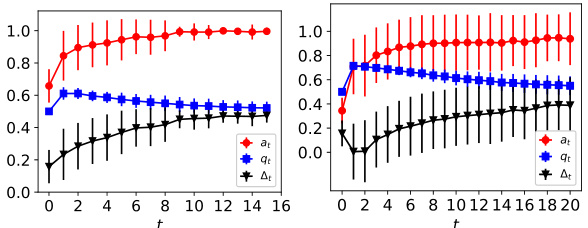
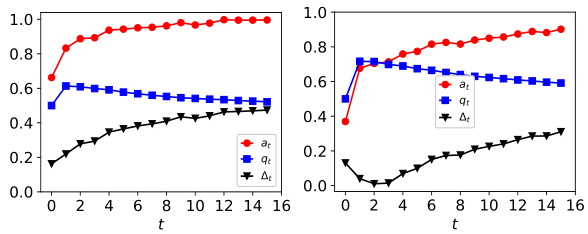
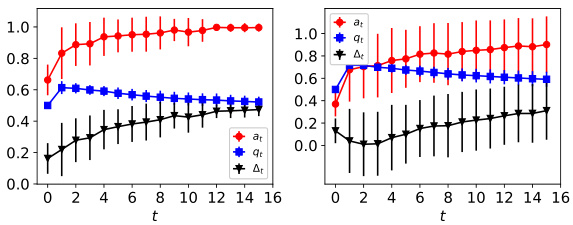
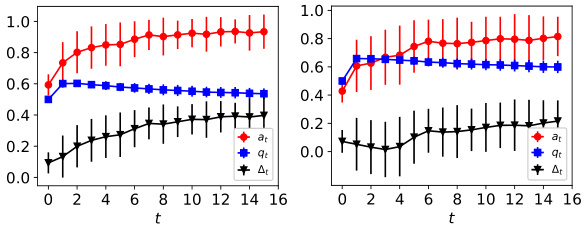
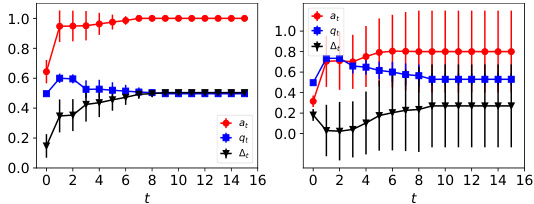
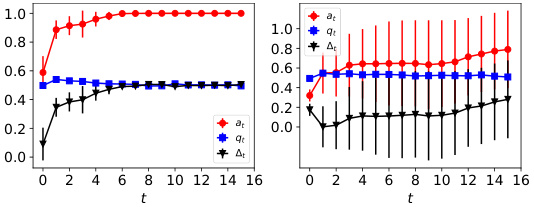
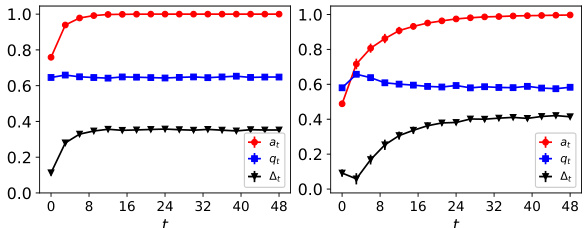
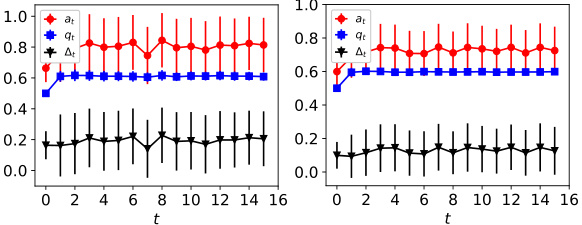
This figure shows the dynamics of acceptance rate (at), qualification rate (qt), and classifier bias (Δt) under different retraining processes in two datasets (Gaussian and German Credit). The left plot shows the dynamics in Gaussian data, while the right plot is in German Credit data. In each plot, there are three lines representing at, qt, and Δt, respectively. The x-axis represents the retraining rounds, while the y-axis is the value of at, qt, and Δt. The lines show that at, qt, and Δt evolve differently under perfect information settings. For example, at always increases while qt decreases in the long run, and Δt shows more complex dynamics.
This figure illustrates the increasing acceptance rate over time as the model is retrained with strategic feedback. It shows how the model’s decisions shift towards accepting more agents, even if the proportion of truly qualified agents may not increase.

This figure illustrates the retraining process and how the acceptance rate increases over time due to strategic behavior of agents. It shows how model-annotated samples with positive labels, even if based on an imperfect model, lead to a more ‘generous’ classifier in the next round.
This figure illustrates the increasing acceptance rate over time due to model retraining with strategic feedback. It shows how the model’s decisions (admit/reject) change the agent population distribution, ultimately leading to a higher acceptance rate. The annotations highlight the impact of model-annotated samples in the retraining process.

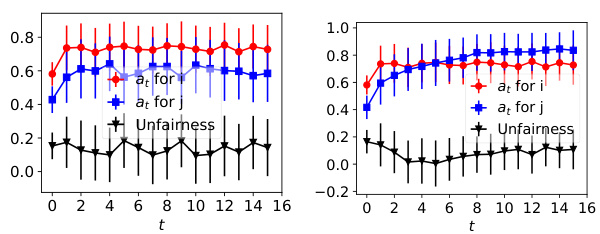
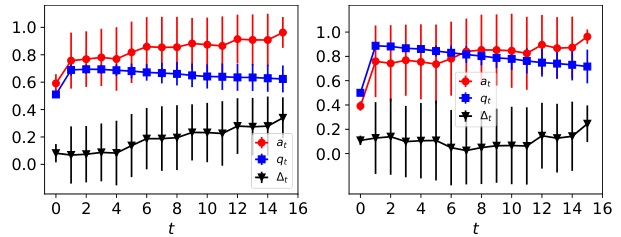
The figure shows the dynamics of acceptance rate (at), qualification rate (qt), and classifier bias (Δt) for two groups (i and j) in the Credit Approval dataset under three different values of r (0.1, 0.05, and 0). Error bars represent the standard deviation. This figure is an enhanced version of Figure 12, providing error bars for improved clarity and statistical significance.
This figure illustrates the retraining process of the model with strategic feedback. It shows how the acceptance rate increases over time as the model is retrained with more qualified agents, while the proportion of agents with positive labels may decrease. The refined retraining process is proposed to stabilize this dynamic.

This figure illustrates the increase in the acceptance rate over time. It shows how the model retraining process, incorporating strategic feedback from agents, leads to a higher proportion of agents being classified as positive, even though the true proportion of qualified agents may not increase at the same rate. The figure highlights the interaction between strategic agents and the model and demonstrates the potential for model bias.

This figure illustrates the increasing acceptance rate over time as the model is retrained with strategic feedback. It shows how the proportion of qualified agents in the training dataset increases after each retraining round, leading to a higher acceptance rate. The figure highlights the positive feedback loop between model retraining and agent behavior.

This figure illustrates the increasing acceptance rate over time due to model retraining with strategic feedback. It shows how the model becomes increasingly likely to accept agents (even unqualified ones) as it is retrained with model-annotated data that reflects the agents’ strategic responses. The retraining process gradually shifts the model towards a more generous acceptance policy.

This figure illustrates how the acceptance rate increases over time due to model retraining with strategic feedback from agents. It shows how the model becomes more likely to give positive decisions as it’s retrained, even though the proportion of qualified agents may not actually increase.

This figure illustrates the increasing acceptance rate over time in a model retraining process with strategic feedback from agents. It shows how the model’s annotations, combined with human annotations, shift the distribution of training data toward a higher proportion of positively labeled agents in successive retraining rounds. This results in the model becoming more likely to make positive classifications, even if the true underlying proportion of positive agents does not increase.

This figure illustrates the model retraining process with strategic feedback. It shows how the acceptance rate increases over time as the model is retrained with both human and model-annotated data, even though the proportion of qualified agents may decrease. This is because agents strategically adapt their behavior to maximize their chances of receiving a favorable outcome.

This figure illustrates the increasing acceptance rate over time due to model retraining with strategic feedback. It shows how the model’s decision boundary changes, leading to more agents being classified as positive, even if their true qualification status remains unchanged.

This figure illustrates how the acceptance rate increases over time due to model retraining with strategic feedback. The left plot shows the initial training data. The middle plot demonstrates the strategic response of agents to the model. The right plot shows how the updated training data leads to an increased acceptance rate in the subsequent model.

This figure illustrates how the training dataset is updated iteratively in the retraining process. At each time step t, strategic agents respond to the current model ft. This response is then added as new data points to the training dataset, along with new human-annotated samples, to create the updated dataset for retraining at time step t+1. This process depicts the dynamic interaction between the model and strategic agents.

This figure illustrates the increasing acceptance rate over time due to model retraining with strategic feedback. It shows how the model’s decisions are influenced by the agents’ strategic responses and model-annotated samples leading to higher acceptance rates in subsequent retraining rounds.

This figure illustrates how the training data is updated from time t to time t+1, incorporating feedback from strategic agents. The model is trained on data at time t, and the strategic agents’ responses to that model are used to create new training data at time t+1. The process shows how model updates and agents’ strategic behaviors interact over time.

This figure illustrates the increasing acceptance rate over time as the model is retrained with strategic feedback. It shows how the model’s decision boundary shifts due to the best responses of strategic agents, leading to a higher proportion of agents being classified as positive even if the actual proportion of qualified agents may not increase.

This figure shows how the student distribution and the ML model evolve over time (t=0, 5, 14) when the model is retrained with both human and model-annotated samples, and students strategically adapt their behavior to maximize their chances of admission. The black lines represent the learned classifier, while the green lines show the ground truth. The figure highlights how the learned classifier deviates from the ground truth over time.

This figure illustrates the process of updating the training data and the change in the acceptance rate over time due to the model retraining with strategic feedback. The model’s acceptance rate increases as the model is retrained with both human-annotated and model-annotated samples.

This figure illustrates how the acceptance rate increases over time due to model retraining with strategic feedback. It demonstrates how model retraining with model-annotated samples, based on the previous classifier’s output, changes the distribution of qualified/unqualified agents. The increasing proportion of positive labels in the training data leads to a more ‘generous’ classifier, accepting more applicants.

This figure illustrates how the acceptance rate increases over time in the model retraining process with strategic feedback. It shows the evolution of the training data and the classifier from time t to t+1, highlighting how the model becomes increasingly likely to accept agents even though the proportion of qualified agents might decrease.

This figure illustrates how the acceptance rate increases over time due to model retraining with strategic feedback. It shows the evolution of the training dataset and the classifier’s decision-making process over three time steps (t, t+1, t+2). The inclusion of model-annotated samples with positive labels increases the proportion of positive labels in the dataset over time, leading to a more ‘generous’ classifier in subsequent rounds.

This figure illustrates the retraining process with strategic feedback. It shows how the acceptance rate increases over time as the model is retrained with model-annotated samples that reflect the strategic responses of the agents. The figure highlights the potential for model retraining to amplify the positive bias.

This figure illustrates the retraining process with strategic feedback, showing how the acceptance rate increases over time. The model is retrained with both human and model-annotated data, and agents strategically adapt their behaviors in response.

This figure illustrates how the acceptance rate increases over time as the model is retrained with strategic feedback. It shows the change in the training dataset and the resulting classifier at each retraining step (t, t+1). The strategic behavior of agents influences the model’s learning, leading to an increasingly ‘generous’ classifier that admits more applicants.

This figure illustrates the retraining process with strategic feedback. It shows how the acceptance rate increases over time as the model is retrained with both human and model-annotated data. The model’s decisions influence agents’ behaviors (best response), leading to a shift in the data distribution. This shift, in turn, impacts future model training and acceptance rates.

This figure illustrates the retraining process and how the acceptance rate increases over time. It shows how strategic agents’ responses to the model influence subsequent model retraining, leading to a higher acceptance rate in the following round. The figure highlights the feedback loop between strategic agents and model retraining.

This figure illustrates the increasing acceptance rate over time during the model retraining process with strategic feedback. It shows how the model’s retraining with model-annotated and human-annotated samples leads to an increase in the proportion of agents receiving positive decisions, while the actual qualification rate may decrease.

This figure illustrates how the training data is updated during the retraining process when incorporating human strategic feedback. In each round (t), a model is trained and deployed. Strategic agents then respond optimally to this model, and their responses (including their features and the model’s decision) are added to the training dataset to improve the model in the next round (t+1). This process creates a feedback loop between model updates and strategic agent behavior.

This figure illustrates the increasing acceptance rate over time due to model retraining with strategic feedback. It shows how the model’s decisions (admit/reject) change the distribution of agents (qualified/unqualified), which in turn influences future model retraining, resulting in a positive feedback loop where more agents are admitted over time.

This figure illustrates the increasing acceptance rate over time. It shows how the model retraining process with strategic feedback from agents leads to a higher proportion of agents being classified as positive, even if the actual proportion of qualified agents might decrease.

This figure illustrates the retraining process with strategic feedback, showing how the acceptance rate increases over time due to model updates and strategic agent behavior. The plots visualize the changes in agent qualification, model-annotated samples, and the overall training dataset across three time steps.

This figure illustrates the increasing acceptance rate over time due to model retraining with strategic feedback. It shows how the model’s decisions change the agents’ behaviors, leading to a higher proportion of agents receiving positive classifications.

This figure illustrates the retraining process with strategic feedback. It shows how the acceptance rate increases over time as the model is retrained with both human and model-annotated samples. The strategic agents adapt their behaviors to receive more favorable outcomes, leading to an increase in the acceptance rate of the model but not necessarily the qualification rate.

This figure illustrates the evolution of the acceptance rate (at) over time. It shows how the model’s retraining process, incorporating both model- and human-annotated data, leads to an increasingly ‘generous’ classifier that accepts a higher proportion of agents over time. This demonstrates the feedback loop between the model and strategic agents.

This figure illustrates the increasing acceptance rate over time as the model is retrained with strategic feedback. It shows how the model’s decisions and the agents’ responses evolve dynamically. Initially, the model has a 50% acceptance rate. However, due to strategic behavior and model retraining, the acceptance rate increases to 70% in the next round, even though the true qualification rate may remain constant or even decline.

This figure illustrates the increasing acceptance rate over time due to model retraining with strategic feedback. It shows how the model’s decisions (admitted/rejected) and agents’ responses (qualified/unqualified) interact, leading to a higher proportion of agents being admitted over time.
More on tables

This table presents the parameter settings used for the Gaussian dataset in the experiments. It shows the distributions used for the features (PXk(xk)), the qualification function (PY|X(1|x)), and the experimental parameters (n, r, T, q0). The parameters define various aspects of the experimental setup, such as sample sizes and the initial qualification rate.
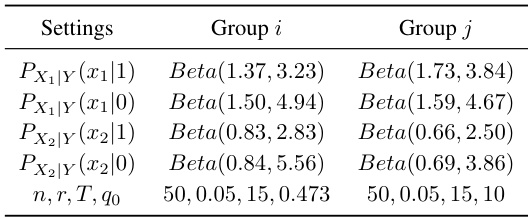
This table presents the parameter settings used in the experiments conducted on the Credit Approval dataset. It details the Beta distributions used to model the conditional probabilities of features X1 and X2 given the label Y (0 or 1) for two groups, i and j. The number of trials (n), the ratio of model-annotated to human-annotated samples (r), the number of retraining rounds (T), and the initial qualification rate (q0) are also specified for each group.
Full paper#


