↗ OpenReview ↗ NeurIPS Homepage ↗ Chat
TL;DR#
Traditional ranking methods often struggle with noisy or incomplete data, and existing social choice models don’t always effectively handle quantitative judgments. This paper addresses these limitations by proposing a novel approach called Quantitative Relative Judgment Aggregation (QRJA). QRJA models situations where agents provide judgments on the relative quality of candidates, rather than complete rankings, which is particularly useful when dealing with incomplete or inconsistent information.
The paper introduces new aggregation rules for QRJA, analyzing their computational properties and demonstrating their effectiveness on real-world datasets, such as those from various races and online programming contests. QRJA outperforms standard methods in terms of both accuracy and interpretability. The authors also contribute to the theoretical understanding of QRJA by establishing almost-linear time solvability for a specific class of QRJA problems and proving NP-hardness for another class. This work highlights the potential of QRJA as a versatile and powerful tool for ranking prediction in various applications.
Key Takeaways#
Why does it matter?#
This paper is crucial for researchers in social choice and machine learning because it bridges the gap between these fields, offering novel methods for ranking prediction using quantitative relative judgments. It provides strong theoretical foundations and demonstrates practical effectiveness on real-world datasets, opening avenues for further research in diverse ranking problems.
Visual Insights#

This figure presents the performance comparison of various ranking algorithms on four different datasets. The algorithms being compared are L1QRJA, L2QRJA, Median, Mean, Borda, Kemeny-Young, and Matrix Factorization (MF). Two metrics are used for evaluation: ordinal accuracy (the percentage of correctly predicted relative rankings) and quantitative loss (the average absolute error in predicting the difference in numerical scores between contestants). The results consistently demonstrate the effectiveness of both L1QRJA and L2QRJA across all four datasets, showcasing their superior performance in comparison to other methods.

This table shows the finishing times of three contestants (Alice, Bob, and Charlie) in three different marathon races (Boston, New York, and Chicago). The example highlights the limitations of simple mean/median approaches for aggregating race results, as Charlie’s average time appears faster than Bob’s even though Bob outperformed Charlie in one race.
In-depth insights#
QRJA: A New Model#
The proposed QRJA (Quantitative Relative Judgment Aggregation) model presents a novel approach to aggregating relative judgments, differing from traditional methods by focusing on quantitative differences rather than solely ordinal rankings. This shift allows QRJA to leverage more information from the input judgments, potentially leading to more accurate and nuanced aggregate rankings. A key advantage is its applicability to diverse scenarios, extending beyond subjective human opinions to encompass objective measures like race times. The framework’s ability to integrate multiple data sources (like past race results) to predict future performance is particularly intriguing, bridging the gap between social choice theory and machine learning for ranking problems. However, the computational complexity and the sensitivity to specific loss functions (like L1 vs L2) represent potential challenges that require further investigation. Theoretical analysis and empirical evaluation are crucial for understanding its robustness and effectiveness compared to existing methods.
Lp-QRJA Complexity#
The computational complexity of Lp-QRJA is a crucial aspect determining its scalability and applicability to large datasets. For Lp-QRJA with p>1, the problem is shown to be solvable in almost-linear time, a significant result indicating its efficiency for large-scale ranking prediction tasks. This is achieved by leveraging the structure of the problem and utilizing advanced algorithms for maximum flow. However, for p<1, the problem becomes NP-hard, implying that finding an exact solution becomes computationally intractable as the problem size grows. This hardness result highlights a critical trade-off between the choice of the loss function and computational feasibility. The almost-linear time complexity for p>1 makes Lp-QRJA a practical choice for large-scale ranking prediction, while the NP-hardness for p<1 suggests alternative methods or approximation techniques for scenarios with such loss functions are needed. The contrasting complexities underscore the importance of careful consideration when selecting the loss function parameter p based on the desired balance between accuracy and computational cost.
Real-World Datasets#
The utilization of real-world datasets is critical for evaluating the effectiveness of the proposed QRJA models. The paper leverages diverse datasets from various domains, including chess tournaments, Formula 1 racing, marathons, and competitive programming contests. This approach is laudable, as it demonstrates the applicability and generalizability of the QRJA method across different settings. Each dataset presents unique characteristics, such as varying numbers of contestants, scoring mechanisms, and levels of data sparsity, thereby offering a robust testbed. The choice of datasets likely reflects a deliberate intention to demonstrate how QRJA can handle diverse data structures and complexities, extending beyond artificial datasets. However, a more detailed explanation of data preprocessing steps and rationale for dataset selection would enhance the study’s transparency and impact. The selection of the datasets, as a whole, is appropriate for testing the algorithms, but limitations exist; more discussion on the limitations of each dataset and how these affect the results would help readers evaluate the findings more critically. The empirical results across these datasets support the robustness of the proposed method, highlighting its potential applications across various ranking prediction problems.
QRJA’s Effectiveness#
The paper’s experimental evaluation strongly suggests QRJA’s effectiveness in ranking prediction tasks. Across diverse real-world datasets (Chess, F1 racing, marathons, and Codeforces programming contests), QRJA consistently outperforms or matches state-of-the-art methods like Matrix Factorization and simple mean/median approaches in both ordinal accuracy and quantitative loss. This robustness across different data characteristics highlights QRJA’s adaptability. The superior performance in ordinal accuracy indicates QRJA’s ability to capture the correct relative order of contestants, which is crucial for ranking. Low quantitative loss demonstrates QRJA’s ability to accurately estimate the magnitude of differences in performance, proving valuable for nuanced ranking. The theoretical analysis further supports the empirical findings by establishing QRJA’s computational tractability for certain parameter values. However, the limitations of the approach should be acknowledged, including potential computational complexities for specific parameter values and the assumption of non-strategic ‘judgments’, which might not always hold in real-world scenarios. Despite these limitations, the evidence overwhelmingly supports QRJA as a powerful and versatile tool for ranking prediction, offering both accuracy and interpretability.
Future Research#
Future research directions stemming from this work on Quantitative Relative Judgment Aggregation (QRJA) could explore several promising avenues. Developing faster algorithms for lp-QRJA when p ≠ 1, 2 is crucial for handling larger datasets efficiently. Investigating the theoretical properties of QRJA under different loss functions beyond the lp-norm would enhance understanding and potentially lead to more robust methods. Exploring QRJA’s application to various types of data beyond contest results, such as subjective ratings or paired comparisons, would broaden its applicability. Furthermore, research into the impact of different weighting schemes on QRJA’s performance and its sensitivity to noise and strategic behavior in the context of social choice is needed. Finally, combining QRJA with other ranking or preference learning methods could unlock even more powerful prediction techniques, potentially improving upon the accuracy and interpretability of current approaches.
More visual insights#
More on figures

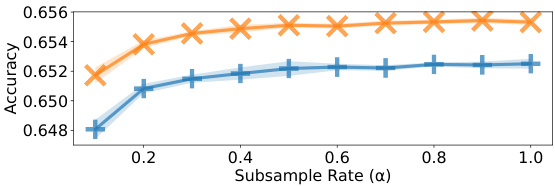
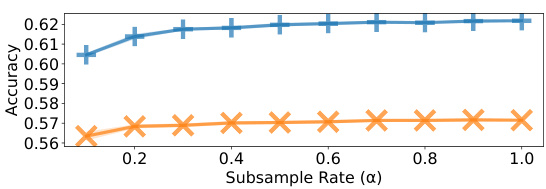
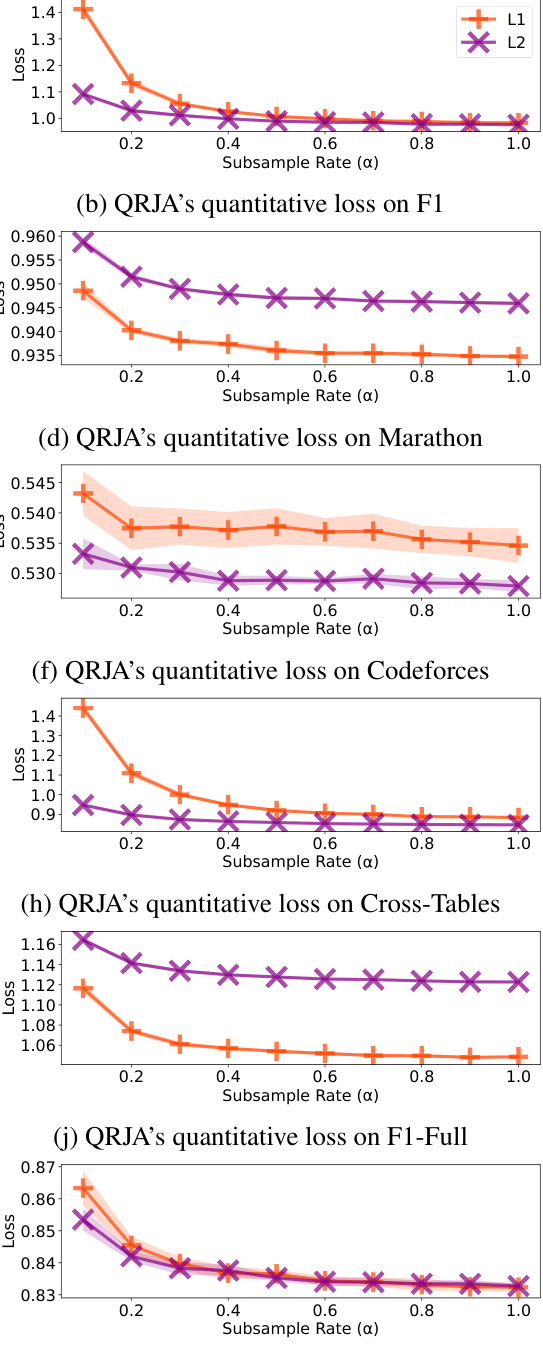
This figure displays the results of experiments on the effect of subsampling judgments using Algorithm 1 on the performance of l1 and l2 QRJA. It shows that subsampling can significantly reduce the number of judgments required, while maintaining relatively good performance, across multiple datasets. Note that some error bars seem large due to the scale of the y-axis.

The figure shows the performance of L1 and L2 QRJA algorithms after applying a subsampling method (Algorithm 1) on several datasets. The x-axis represents the subsample rate (α), which determines the number of samples used. The y-axis shows both the ordinal accuracy and quantitative loss. The results indicate that Algorithm 1 effectively reduces the number of judgments needed while maintaining relatively good performance. Error bars showing standard deviation are included.

The figure shows the performance comparison of several algorithms, including two versions of QRJA (Quantitative Relative Judgment Aggregation), on four different datasets using two metrics: ordinal accuracy and quantitative loss. The algorithms are compared in terms of their ability to predict the ranking of contestants in various contests. The results demonstrate that QRJA consistently performs well across all datasets.

This figure presents the performance of different algorithms on four datasets (Chess, F1, Marathon, Codeforces) using two metrics: ordinal accuracy and quantitative loss. The results demonstrate that both versions of QRJA (l1 and l2) consistently achieve high performance across all datasets, showcasing their effectiveness in predicting contest outcomes.

This figure compares the performance of various ranking algorithms, including two versions of the proposed QRJA method (l1 and l2), against baselines like Mean, Median, Borda, Kemeny-Young, and Matrix Factorization on four real-world datasets. The results visualize both ordinal accuracy (percentage of correct relative ranking predictions) and quantitative loss (average absolute error of relative quantitative predictions, normalized). The key observation is that QRJA consistently performs well across all datasets and metrics.

This figure shows the performance of L1 and L2 QRJA algorithms after applying a subsampling technique (Algorithm 1). The x-axis represents the subsample rate (α), ranging from 0.1 to 1.0, which determines the number of sampled judgments (M=[αm]). The y-axis shows the ordinal accuracy of the algorithms. The figure demonstrates that Algorithm 1 effectively reduces the number of judgments with only minor impact on the accuracy, particularly when α is greater than 0.4. Error bars are included to illustrate the variability of the results.

This figure shows the results of experiments evaluating the performance of L1 and L2 QRJA algorithms after applying a subsampling technique (Algorithm 1). The x-axis represents the subsampling rate (α), and the y-axis displays the accuracy. The results demonstrate that subsampling can significantly reduce the number of judgments required while maintaining relatively high accuracy, especially for L2 QRJA, indicating that the subsampling approach is efficient for large-scale datasets.

This figure shows the performance of L1 and L2 QRJA algorithms on the Chess dataset after applying a subsampling technique (Algorithm 1). The x-axis represents the subsample rate (α), indicating the proportion of judgments used. The y-axis displays both ordinal accuracy and quantitative loss. The results demonstrate that subsampling can reduce the number of judgments significantly while incurring minimal loss in performance. Error bars show standard deviation across multiple runs.

The figure shows the performance of L1 and L2 QRJA algorithms on multiple datasets after applying a subsampling technique (Algorithm 1). The x-axis represents the subsample rate (α), indicating the fraction of judgments kept. The y-axis shows the ordinal accuracy. The results demonstrate that subsampling reduces computation time with minimal impact on accuracy.

This figure shows the performance of L1 and L2 QRJA algorithms after applying a subsampling technique (Algorithm 1). The x-axis represents the subsample rate (α), indicating the fraction of judgments used. The y-axis shows both ordinal accuracy (top row) and quantitative loss (bottom row) for each algorithm across several datasets. The results demonstrate that subsampling, using Algorithm 1, reduces the number of judgements while maintaining accuracy. The error bars represent standard deviation.

This figure shows the performance of L1 and L2 QRJA algorithms after applying a subsampling technique (Algorithm 1). The x-axis represents the subsample rate (α), ranging from 0.1 to 1.0, indicating the proportion of the original judgments used. The y-axis shows the ordinal accuracy of the algorithm. The results demonstrate that the subsampling method reduces the number of judgments without significant performance degradation, especially when α is greater than or equal to 0.4. The error bars represent the standard deviation across multiple runs. Note that the visual magnitude of errors can be misleading due to the y-axis scale.

This figure shows the performance of L1 and L2 QRJA algorithms after subsampling the judgments using Algorithm 1. The x-axis represents the subsample rate (α), ranging from 0.1 to 1.0, while the y-axis shows both ordinal accuracy and quantitative loss for four datasets. The results demonstrate that subsampling reduces computational cost with minimal impact on performance, even when reducing the dataset to 40% of its original size.

This figure presents the performance of different ranking prediction algorithms on four datasets: Chess, F1, Marathon, and Codeforces. Two metrics are used for evaluation: ordinal accuracy (percentage of correct ordinal predictions) and quantitative loss (average absolute error of quantitative predictions, normalized by the trivial prediction). The results show that both versions of QRJA (Quantitative Relative Judgment Aggregation) consistently perform well, achieving high ordinal accuracy and low quantitative loss across all datasets. The figure showcases the relative performance of QRJA compared to several baseline algorithms (Mean, Median, Borda, Kemeny-Young, and Matrix Factorization).

This figure presents the results of experiments comparing three variants of matrix factorization (MF) with different numbers of training epochs. The performance is measured across various datasets, using ordinal accuracy as the metric. The results highlight that the R1 MF variant generally outperforms R2 and R5 MF, with R1 MF’s performance improving as the number of training epochs increases, while R2 and R5 MF can show performance degradation with increased training.

This figure shows the results of the Matrix Factorization method on different datasets for varying numbers of training epochs. It indicates that the R1 MF model generally performs better than R2 and R5 MF, and its performance tends to improve with more training epochs, unlike R2 and R5 MF which may worsen with more epochs on certain datasets.

This figure compares the performance of various ranking prediction algorithms on four datasets using two metrics: ordinal accuracy (percentage of correct relative ordinal predictions) and quantitative loss (average absolute error of relative quantitative predictions, normalized). The algorithms are compared on Chess, F1, Marathon, and Codeforces datasets. The results show that both l1 and l2 QRJA consistently perform well across all datasets.
More on tables

This table shows the results of three contestants (Alice, Bob, and Charlie) in three different races (Boston, New York, and Chicago). Some race results are missing, making it difficult to determine the fastest runner by simply comparing Alice and Charlie’s times. However, including Bob’s results reveals a transitive relationship indicating Alice is faster than Charlie.

This table shows the finishing times of three contestants (Alice, Bob, and Charlie) in three different marathon races (Boston, New York, and Chicago). It illustrates a limitation of using simple mean or median approaches for aggregating quantitative judgments. While Bob is faster in two of the races, the average (or median) time for Charlie could appear faster due to the selection of races in which he competed.
Full paper#


