↗ OpenReview ↗ NeurIPS Homepage ↗ Chat
TL;DR#
Machine learning models, while effective on average, can make errors with overconfidence, and algorithmic bias can disproportionately impact specific groups. Conformal inference, producing prediction sets with coverage guarantees, addresses uncertainty but may lack fairness. Existing equalized coverage methods struggle with scalability in high-dimensional settings.
This work proposes Adaptively Fair Conformal Prediction (AFCP), which tackles these issues by selecting relevant features reflecting potential model limitations or biases. AFCP generates prediction sets with valid coverage conditional on these features, balancing efficiency and fairness. It demonstrates effectiveness on simulated and real datasets, providing a practical approach to uncertainty and fairness in machine learning.
Key Takeaways#
Why does it matter?#
This paper is crucial for researchers working on uncertainty quantification and algorithmic fairness in machine learning. It introduces a novel approach that effectively balances the need for informative predictions with the requirement of equalized coverage across different groups, which is particularly relevant to high-stakes domains. The method is also computationally efficient, making it feasible for real-world applications. It opens up new avenues for research focusing on the adaptive selection of sensitive features and extensions to multiple attributes, offering a more practical approach to algorithmic fairness.
Visual Insights#

The figure shows a schematic of the proposed Adaptively Fair Conformal Prediction (AFCP) method. AFCP automatically selects a sensitive attribute (e.g., race, gender, age) based on the input test point and the calibration data. The choice of attribute is guided by an analysis of potential model bias, aiming to identify groups most affected by algorithmic unfairness. Based on this selected attribute (or no attribute if no significant bias is detected), AFCP generates conformal prediction sets. The example shows three test cases where different attributes were selected, each resulting in prediction sets calibrated to provide valid coverage for the corresponding identified group.

This table presents the performance of different conformal prediction methods on groups formed by the sensitive attribute ‘Color’. The results show coverage and prediction set size for each method at different sample sizes (200, 500, 1000, 2000). Green values highlight cases of low coverage, and red values highlight cases where the prediction sets are small in size. This information helps understand the trade-off between accuracy and informativeness of the different approaches across various sample sizes.
In-depth insights#
Adaptive Fairness#
Adaptive fairness in machine learning focuses on creating algorithms that dynamically adjust their fairness criteria based on the specific context and data. Unlike traditional fairness methods that apply a fixed set of rules, adaptive fairness aims to balance fairness with other objectives, such as accuracy and efficiency. This approach often involves carefully selecting sensitive attributes to focus on, choosing attributes only when they significantly impact prediction fairness, and employing techniques that minimize negative impacts on certain groups. Context-aware fairness, a key component of adaptive approaches, recognizes that the same fairness measure may not be suitable for all scenarios and that model limitations or data biases might need to be addressed differently in various situations. A well-designed adaptive fairness model would transparently communicate its limitations and ensure equalized coverage for prediction sets, leading to more robust and equitable outcomes.
AFCP Algorithm#
The Adaptively Fair Conformal Prediction (AFCP) algorithm is a novel method designed for uncertainty quantification in classification tasks. AFCP addresses the limitations of existing conformal inference methods, particularly in scenarios with diverse populations and multiple sensitive attributes. Unlike traditional approaches that either ignore fairness or rely on computationally expensive data splitting, AFCP employs an adaptive strategy. It carefully selects a sensitive attribute (or none if biases are insignificant) that best reflects potential model limitations or biases. This selection process guides the construction of prediction sets that provide valid coverage conditional on the chosen attribute, effectively balancing efficiency and fairness. The algorithm’s key innovation lies in its data-driven selection of the most relevant attribute, enabling a practical compromise between the efficiency of informative predictions and the fairness of equalized coverage. By adapting to the data’s specific characteristics, AFCP minimizes both algorithmic bias and the computational burden associated with traditional exhaustive equalized coverage methods. The rigorous theoretical justification and the empirical evaluation using simulated and real data sets confirm the method’s validity and effectiveness in mitigating algorithmic bias while maintaining high predictive power.
Bias Mitigation#
The concept of bias mitigation in machine learning is crucial, especially in sensitive applications like criminal justice or loan approvals. Algorithmic bias can lead to unfair or discriminatory outcomes, impacting specific demographic groups disproportionately. The research paper likely explores methods to address this issue, such as data preprocessing techniques (e.g., resampling, reweighting) to balance class representation or mitigate skewed distributions that may favor certain groups. It might also delve into algorithmic adjustments, perhaps modifying model architectures or training procedures to reduce bias. Conformal inference, a prominent theme in this paper, potentially plays a role in quantifying and addressing uncertainty related to predictions from biased models. Moreover, the investigation might encompass the selection of appropriate evaluation metrics that account for fairness considerations, going beyond simple accuracy. The effectiveness of these mitigation strategies would likely be evaluated empirically, comparing outcomes across different demographic groups and potentially using methods like equalized coverage to ensure fair treatment of all groups.
Empirical Results#
An Empirical Results section in a research paper would typically present the findings from experiments conducted to test the paper’s hypotheses or claims. A strong Empirical Results section would begin with a clear description of the experimental setup, including the datasets used, the evaluation metrics, and the experimental design. Detailed visualizations, such as tables and figures, are essential to present the results clearly and effectively. Statistical significance testing is crucial to determine the reliability of the findings. The discussion should focus on the key findings, highlighting any unexpected results, and relating the results back to the paper’s hypotheses and contributions. A thorough comparison to relevant baselines is needed to demonstrate the novelty and effectiveness of the proposed methods. Finally, any limitations of the experimental setup or the results should be transparently acknowledged to maintain scientific rigor. Robustness analysis should be provided if possible to show that the key findings aren’t affected by small changes in the experimental conditions. Overall, the Empirical Results section needs to be comprehensive and persuasive, building a strong case for the value of the research.
Future Work#
The authors acknowledge the limitations of their current approach and outline several promising directions for future work. Extending the method to handle multiple sensitive attributes simultaneously is crucial for real-world applications. They also suggest exploring alternative attribute selection algorithms to improve the identification of biased groups. Investigating different fairness criteria is another avenue for enhancing the model’s fairness properties. Addressing the computational complexity for large datasets and diverse populations is also vital, particularly concerning the efficiency of attribute selection. Further research into the theoretical properties of the proposed method under various conditions, including assumptions regarding data exchangeability, would strengthen the model’s foundations. Finally, adapting the methodology to regression tasks and ordered categorical variables, as well as enhancing robustness against adversarial attacks, are also discussed as important future research directions.
More visual insights#
More on figures

The figure compares prediction sets generated by three different methods: marginal, AFCP, and exhaustive. The marginal method produces prediction sets that have good coverage on average, but poor coverage for certain subgroups, leading to invalid coverage for some individuals. The exhaustive method guarantees fair coverage across all subgroups, but at the cost of significantly larger and less informative prediction sets. The AFCP method offers a balance between informativeness and fairness, producing smaller prediction sets that still have approximately valid and efficient coverage for all subgroups, by carefully selecting the relevant features to focus on.

This figure compares the performance of four conformal prediction methods (AFCP, AFCP1, Marginal, Partial, and Exhaustive) on a synthetic medical diagnosis task. The x-axis represents the total number of training and calibration data points. The y-axis shows three different metrics: coverage for the ‘Blue’ group (a minority group with higher algorithmic bias), average coverage across all groups, and the average size of the prediction sets. The results demonstrate that the AFCP method effectively balances efficiency and fairness, achieving good coverage while producing relatively small prediction sets, especially compared to the exhaustive method which tends to be overly conservative. The marginal method, while efficient, fails to accurately represent uncertainty for the ‘Blue’ group, demonstrating the value of the AFCP approach in addressing algorithmic bias.

This figure compares prediction sets created by four different methods for two example patients from a group negatively affected by algorithm bias. The methods are: Marginal, Exhaustive, and the authors’ proposed AFCP. The Marginal method produces small, efficient prediction sets, but these fail to cover the true label for the two patients. The Exhaustive method produces prediction sets that correctly cover the true label, but these sets are too large to be informative. The authors’ AFCP method produces prediction sets that are both efficient and cover the true label.

The figure compares prediction sets generated by different methods for individuals in groups negatively impacted by algorithmic bias. The methods compared are: Marginal (standard conformal prediction), Exhaustive (conformal prediction with all sensitive attributes protected), and the authors’ proposed method, AFCP (Adaptively Fair Conformal Prediction). AFCP attempts to find a balance between ensuring fair coverage and producing informative predictions (small set sizes). The example shows that for two patients in a group with significant bias, standard marginal prediction sets fail to cover the true label, exhaustive equalized coverage sets are too large to be informative, and AFCP generates prediction sets that are both fair and efficient.

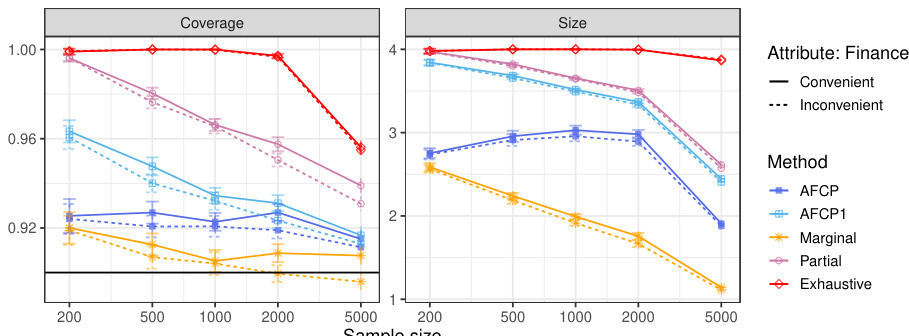
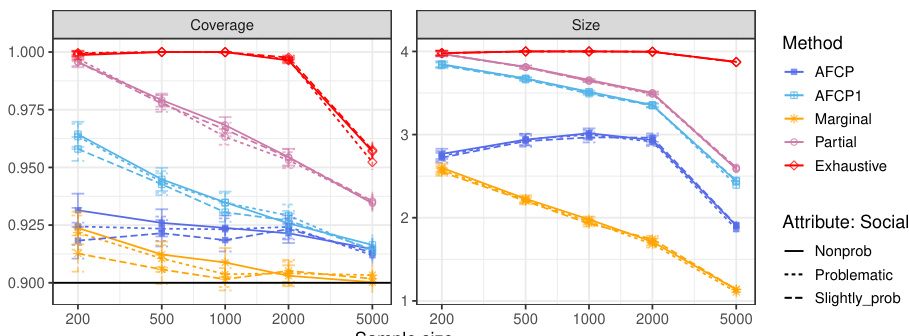
The figure compares the performance of different conformal prediction methods on synthetic medical diagnosis data. The x-axis shows the sample size (total number of training and calibration data points), while the y-axis shows three metrics: Coverage for the Blue group, Average Coverage (overall), and Average Size of prediction sets. The results show that AFCP offers a good compromise between efficiency (smaller prediction set sizes) and fairness (good coverage, especially for the group with algorithmic bias).
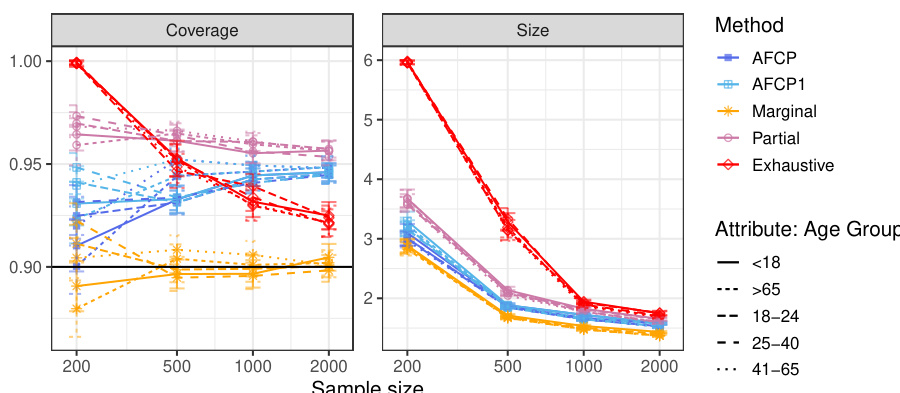
The figure displays the performance of four different conformal prediction methods on synthetic medical diagnosis data. The methods are compared in terms of coverage, average set size, and coverage for a specific group (Blue) known to be affected by algorithmic bias. AFCP, the proposed method, aims to balance efficiency (small set sizes) and fairness (equal coverage across groups). The results demonstrate that AFCP achieves better coverage for the Blue group while maintaining reasonably small set sizes compared to methods focused solely on equalized coverage (Exhaustive) which produced overly large sets.
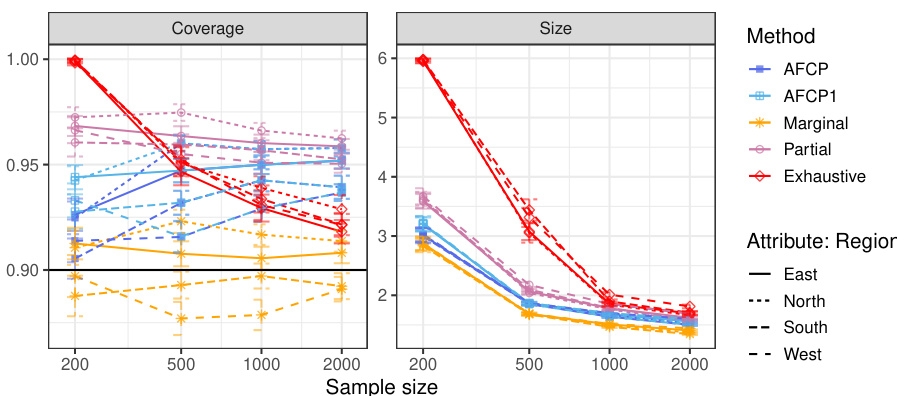
The figure shows the performance comparison of different conformal prediction methods on synthetic medical diagnosis data. The methods are AFCP, AFCP1, Marginal, Partial, and Exhaustive. The x-axis represents the sample size, and the y-axis shows the coverage for the Blue group, average coverage, and average set size. AFCP consistently achieves valid coverage and smaller prediction set sizes compared to the others, especially the Exhaustive method, showing its efficiency in mitigating algorithmic bias.

The figure compares the performance of different methods for constructing prediction sets on synthetic medical diagnosis data. The x-axis represents the sample size, while the y-axis shows three different metrics: coverage for the Blue group (a group experiencing algorithmic bias), average coverage across all groups, and average prediction set size. The results demonstrate that the proposed AFCP method produces more informative predictions (smaller set size) and effectively mitigates algorithmic bias by improving the coverage, especially for the disadvantaged Blue group.
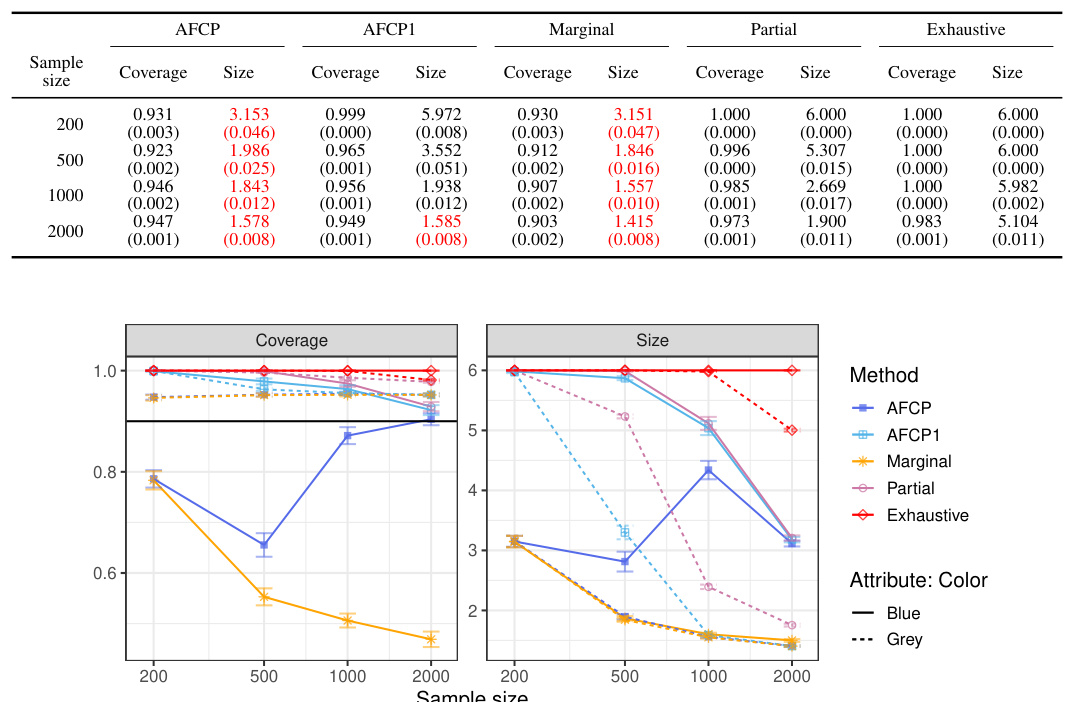
This figure shows the performance comparison of four conformal prediction methods on a synthetic medical diagnosis task with varying dataset sizes. The methods compared are the proposed AFCP method, a simplified version (AFCP1), a marginal benchmark (ignoring fairness), a partial equalized benchmark (considering each sensitive attribute individually), and an exhaustive equalized benchmark (considering all sensitive attributes simultaneously). The results demonstrate that the proposed AFCP methods achieve a balance between the marginal method (more efficient predictions, but potentially unfair) and the exhaustive method (fair, but less efficient predictions). AFCP achieves better performance than the others in mitigating bias while maintaining efficiency for moderate and larger dataset sizes.

The figure displays the performance comparison of several conformal prediction methods in a synthetic medical diagnosis task. It illustrates how the proposed AFCP method outperforms other methods (marginal, exhaustive, and partial equalized coverage) by providing more informative predictions (smaller prediction set size) while effectively mitigating algorithmic bias and achieving higher conditional coverage. The results are presented as functions of the sample size (x-axis) and for each method (different colored lines) for three different metrics: conditional coverage for the minority class (Blue group), overall average coverage, and prediction set size. Error bars represent 2 standard errors.
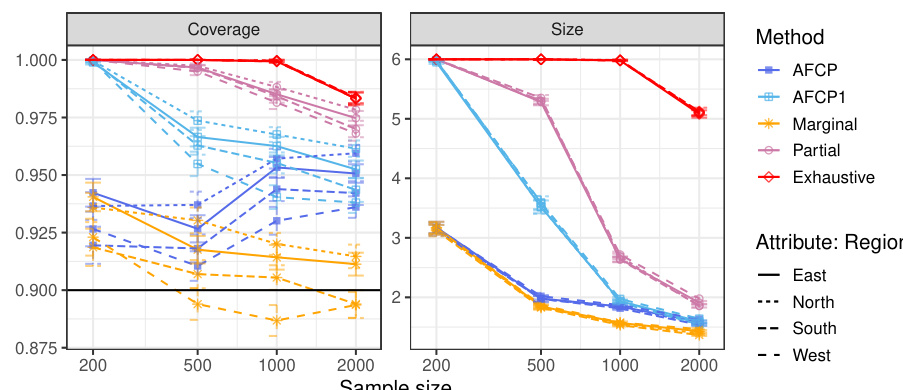
The figure displays the performance of different conformal prediction methods on a synthetic medical diagnosis task. The x-axis represents the sample size used for training and calibration. The y-axis shows three different metrics: coverage for a specific group (Blue), average coverage across all groups, and the average prediction set size. The results indicate that the proposed method (AFCP) achieves a good balance between efficiency (smaller prediction sets) and fairness (higher conditional coverage, especially for the disadvantaged group). Comparison is made against marginal coverage, exhaustive equalized coverage, and a partial equalized coverage benchmark.
The figure compares prediction sets generated by different methods for individuals in groups disproportionately affected by algorithmic bias. The Marginal method produces small prediction sets but fails to cover the true label in several cases, indicating undercoverage. The Exhaustive method guarantees equalized coverage across all groups, but at the cost of significantly larger prediction sets, reducing their informativeness. In contrast, the proposed AFCP method identifies the groups most affected by bias and generates prediction sets that are both informative (small sizes) and well-calibrated (valid coverage) within those groups.
This figure compares prediction sets generated by different methods for patients in groups negatively affected by algorithmic bias. The marginal method produces small prediction sets but suffers from low coverage for specific groups. The exhaustive method provides valid coverage for all groups but produces overly conservative (large) prediction sets. The partial method attempts a compromise, but it’s still too conservative. The AFCP method (developed by the authors) is shown to provide prediction sets that achieve a balance between efficiency (small sets) and fairness (valid coverage for affected groups) by dynamically selecting the appropriate sensitive attribute.
The figure compares prediction sets generated by four different methods for two example patients from a group negatively affected by algorithmic bias. The methods are Marginal (only considers overall accuracy), Exhaustive (equalizes coverage across all sensitive attributes), Partial (equalizes coverage for each individual sensitive attribute), and AFCP (adaptively selects the most relevant sensitive attribute to equalize coverage). The figure highlights that the Marginal approach results in prediction sets that fail to cover the true label for the biased group, while the Exhaustive method yields sets that are too large and uninformative. The Partial method is an improvement, but AFCP offers the best compromise: accurate and informative prediction sets.

This figure compares prediction sets generated by four different methods for two example patients. The methods are: Marginal (ignores group fairness), Exhaustive (ensures equal coverage across all subgroups, potentially producing very large sets), Partial (a compromise between the previous two), and AFCP (the authors’ method, which aims for equal coverage but only where the model shows bias). The figure illustrates that the marginal method fails to accurately reflect uncertainty for patients in biased subgroups. The exhaustive method is overly cautious and uninformative. AFCP, by contrast, produces relatively small and accurate prediction sets, striking a balance between efficiency and fairness.
The figure compares the prediction sets generated by different methods for patients in groups disproportionately affected by algorithmic bias. It shows that the marginal method produces sets that are too small and fail to cover the true label for biased groups, leading to invalid coverage. The exhaustive method, aiming for equalized coverage across all sensitive attributes, produces sets that are too large and uninformative. In contrast, the proposed AFCP method dynamically selects the relevant sensitive attribute, creating prediction sets that are well-calibrated for the biased group while maintaining informativeness (smaller set size).

The figure compares prediction sets generated by four methods: Marginal, Exhaustive, Partial and the proposed AFCP method. For two example patients from a group negatively affected by algorithm bias, Marginal prediction sets fail to cover the true label. Exhaustive prediction sets are too conservative to be informative. The AFCP method generates efficient and fair prediction sets by using an automatically identified sensitive attribute to calibrate prediction sets only for groups actually affected by algorithmic bias, achieving a balance between accuracy and fairness.
This figure compares the prediction sets generated by different methods for patients in groups negatively impacted by algorithmic bias. The methods are: 1. Marginal: Prediction sets with only marginal coverage guarantees (i.e., overall coverage, but not necessarily equal coverage across all subgroups). 2. AFCP: The authors’ proposed method (Adaptively Fair Conformal Prediction), which aims for valid coverage conditional on an adaptively chosen sensitive attribute. The attribute is selected based on which group is most negatively affected by bias. 3. Exhaustive: Prediction sets that guarantee equal coverage across all subgroups defined by all sensitive attributes. This often leads to overly large, uninformative prediction sets. The figure showcases that marginal prediction sets fail to cover the true labels for some patients in the biased group, while the exhaustive method’s prediction sets are too broad. The authors’ AFCP method, however, aims to strike a balance between efficiency and fairness, achieving valid coverage within the biased group with more manageable prediction set sizes.

This figure shows the results of a comparison of several methods for constructing prediction sets on synthetic medical diagnosis data. The x-axis represents the sample size used for training and calibration, and the y-axis shows various metrics including conditional coverage, average coverage, and average set size. The key finding is that the proposed AFCP method produces smaller prediction sets while maintaining good conditional coverage, which is particularly important for mitigating algorithmic bias.
The figure compares prediction sets generated by four different methods for two example patients from a group negatively impacted by algorithmic bias. The methods compared are: 1. Marginal: Prediction sets with marginal coverage only (no fairness considerations). 2. Exhaustive: Prediction sets that guarantee valid coverage across all sensitive attributes (most conservative, potentially uninformative). 3. Partial: Prediction sets that guarantee valid coverage across each sensitive attribute individually (less conservative than exhaustive, still potentially uninformative). 4. AFCP (Adaptively Fair Conformal Prediction): The authors’ proposed method, which aims to provide a practical compromise between efficiency and fairness by adaptively choosing the most relevant sensitive attribute for equalized coverage. For each method, prediction sets are shown for two patients (one for asthma, the other for stroke). Note that only the AFCP method provides prediction sets that are both informative and demonstrate valid coverage for the negatively impacted group.
The figure compares prediction sets generated by four different methods: Marginal, Exhaustive, Partial, and AFCP for two patients from groups negatively affected by algorithm bias. The Marginal method produces small prediction sets but exhibits invalid coverage. Conversely, the Exhaustive method produces valid coverage but the sets are too large to be informative. The Partial method shows a compromise between Marginal and Exhaustive, but it is still conservative. The AFCP method provides well-calibrated and efficient prediction sets.

This figure compares prediction sets generated by four different methods for two example patients from a group negatively impacted by algorithmic bias. The methods compared are: 1. Marginal: Prediction sets with only marginal coverage guarantees. 2. AFCP: Prediction sets from the authors’ proposed method (Adaptively Fair Conformal Prediction), which guarantees coverage conditional on the most biased group, dynamically identified by the algorithm. 3. Exhaustive: Prediction sets using all sensitive attributes to ensure equalized coverage across all groups (very conservative). 4. Partial: Prediction sets obtained by taking the union of those generated using each sensitive attribute separately (less conservative than exhaustive, but still less informative than AFCP). The figure shows that for the two example patients, the marginal method fails to cover the true label, while the exhaustive method is overly conservative. AFCP strikes a balance, providing well-calibrated prediction sets while effectively mitigating the algorithmic bias for the most sensitive group.

The figure shows the performance comparison of different conformal prediction methods on a synthetic medical diagnosis task, varying the sample size used for training and calibration. The key metric is conditional coverage (accuracy of predictions within specific groups) and average prediction set size (informativeness). AFCP demonstrates improved conditional coverage for a group disproportionately affected by algorithmic bias, achieving this with smaller prediction sets than other methods.
This figure compares prediction sets generated by four different methods for two example patients from a group negatively affected by algorithmic bias. The methods compared are Marginal, Exhaustive, Partial, and the proposed AFCP method. The figure highlights how the Marginal method fails to provide valid coverage while the Exhaustive method produces overly conservative predictions. The AFCP method, in contrast, provides informative predictions that are well-calibrated for the group by accounting for algorithmic bias.
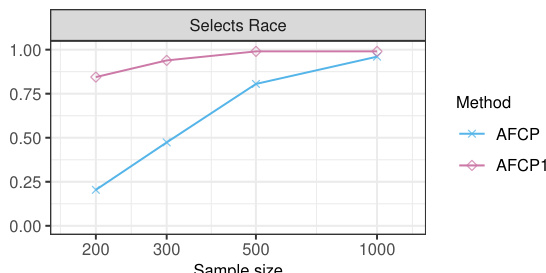
This figure shows how often each sensitive attribute is selected by the AFCP and AFCP1 methods as the sample size increases. AFCP1 always selects an attribute regardless of a statistical test for bias, while AFCP only selects if bias is detected. As the sample size grows, AFCP becomes more reliable at selecting the attribute showing the greatest bias (Color).

The figure compares prediction sets generated by four different methods for two example patients from a group negatively impacted by algorithmic bias. The methods are: Marginal (only considers overall average coverage), Exhaustive (guarantees equal coverage across all sensitive attributes), Partial (guarantees equal coverage for each sensitive attribute individually), and AFCP (the proposed method that adaptively selects the most relevant sensitive attribute for equalized coverage). The figure shows that Marginal fails to accurately reflect the uncertainty for the biased group, Exhaustive produces overly large and uninformative prediction sets, and Partial is less informative than AFCP. AFCP strikes a balance between accuracy and fairness, producing more useful predictions.

This figure compares the performance of different conformal prediction methods on synthetic medical diagnosis data. The x-axis represents the sample size used for training and calibration, and the y-axis shows three different metrics: conditional coverage for the ‘Blue’ group (a group designed to have algorithmic bias), average coverage across all groups, and the average size of the prediction sets. AFCP consistently achieves higher conditional coverage for the biased group compared to other methods (Marginal, Exhaustive, Partial) while maintaining relatively small prediction set sizes, demonstrating its effectiveness in mitigating bias. Error bars indicate 2 standard deviations.
The figure compares the performance of different conformal prediction methods on synthetic medical diagnosis data. It shows how prediction set size and coverage vary with the total number of training and calibration data points. The proposed AFCP method outperforms other methods in terms of providing smaller (more informative) prediction sets while maintaining or improving coverage, especially for the group most affected by algorithmic bias.
The figure compares prediction sets generated by different methods for individuals from groups negatively impacted by algorithmic bias. The methods compared include Marginal (only considering overall accuracy), Exhaustive (considering all sensitive attributes for equalized coverage, which can be overly conservative), and the proposed AFCP method. AFCP adaptively selects a sensitive attribute to focus on, leading to prediction sets that provide a balance between accuracy and fairness by equalizing coverage for only the groups truly needing it. The examples shown highlight that AFCP avoids both the undercoverage issues of the Marginal method and the overly conservative predictions of the Exhaustive method, providing more informative results.
This figure compares the performance of several conformal prediction set construction methods on a synthetic medical diagnosis dataset. The x-axis shows the total sample size used for training and calibration. The y-axis displays three metrics: coverage for the ‘Blue’ group, average coverage across all groups, and average set size. The results show that the AFCP method achieves good coverage while maintaining relatively small prediction set sizes, outperforming other methods, especially in mitigating algorithmic bias affecting the ‘Blue’ group. Error bars represent two standard errors.
The figure compares prediction sets generated by several methods for two example patients from a group negatively affected by algorithmic bias. The ‘Marginal’ method produces small prediction sets but with invalid coverage for the biased group. The ‘Exhaustive’ method guarantees valid coverage but results in overly large, uninformative sets. The proposed ‘AFCP’ method provides prediction sets that are both efficient and fair, achieving valid coverage for the biased group without being overly conservative.
The figure compares prediction sets generated by four different methods for patients in groups disproportionately affected by algorithmic bias. The methods are: Marginal, Exhaustive, Partial, and AFCP (the authors’ proposed method). The example shows that the Marginal method fails to cover the true label for two example patients. The Exhaustive method produces valid but overly conservative prediction sets. The Partial method offers an improvement over Marginal but is still relatively large. The authors’ AFCP method provides informative and well-calibrated prediction sets conditional on the automatically selected sensitive attribute.
This figure compares the prediction sets generated by four different methods for two example patients from a group negatively impacted by algorithmic bias. The methods compared are: Marginal (baseline), Exhaustive (ensures equalized coverage across all sensitive attributes, which can be too conservative), Partial (ensures equalized coverage for each sensitive attribute individually, but might not be sufficient), and AFCP (the proposed method, which adaptively selects the most critical attribute for equalized coverage). The figure shows that the Marginal method fails to cover the true label for both patients, Exhaustive generates overly conservative sets, and Partial provides improvements but is still not optimal. AFCP effectively balances efficiency and fairness, generating informative and well-calibrated prediction sets.
The figure shows the performance of different conformal prediction methods on synthetic medical diagnosis data. The x-axis represents the sample size (total number of training and calibration data points), and the y-axis shows different metrics: coverage for the Blue group, average coverage across all groups, and average set size. The results show that the proposed AFCP method provides prediction sets with smaller average size and better coverage, especially for the underrepresented Blue group, compared to standard marginal conformal prediction, exhaustive equalized coverage, and partial equalized coverage. Error bars represent 2 standard errors, indicating the variability in the results.
The figure compares prediction sets generated by different methods for individuals in groups disproportionately affected by algorithmic bias. The methods shown are: * Marginal: Standard conformal prediction sets with marginal coverage guarantees. * AFCP: Adaptive Fair Conformal Prediction, the authors’ proposed method, which selects a sensitive attribute to equalize coverage within subgroups and provides more informative prediction sets. * Exhaustive: Conformal prediction sets with exhaustive equalized coverage, which guarantee valid coverage for all possible combinations of sensitive attributes. These sets tend to be overly conservative, leading to less informative predictions. The figure highlights that standard marginal methods can fail to cover the true label for individuals in biased groups. The exhaustive method provides valid coverage but generates overly large prediction sets that are not useful. The authors’ AFCP method is designed to provide a balance between the two approaches, offering valid coverage and informative prediction sets. The example showcases the superior performance of AFCP in addressing biases.
The figure compares prediction sets generated by four different methods for two example patients from a group negatively affected by algorithmic bias. The methods compared are: Marginal (no bias correction), Exhaustive (bias correction for all sensitive attributes), Partial (bias correction for each sensitive attribute separately), and AFCP (adaptive bias correction for the most relevant attribute). For both patients, the Marginal method fails to cover the true label, indicating bias, while the Exhaustive method produces overly conservative sets. The Partial method is better, but still not as informative as the AFCP method, which produces appropriately sized and well-calibrated prediction sets.
The figure compares prediction sets generated by different methods for individuals from groups disproportionately affected by algorithmic bias. The methods compared are: Marginal (standard conformal prediction), Exhaustive (equalized coverage across all sensitive attributes), and AFCP (the proposed method). The figure shows that Marginal prediction sets fail to cover the true label for two example patients from a disadvantaged group. Exhaustive prediction sets achieve fair coverage but are too conservative, leading to uninformative predictions. The AFCP method provides a more practical solution with both efficient and fair prediction sets.
The figure shows the performance comparison of different conformal prediction methods on a synthetic medical diagnosis task. The x-axis represents the total sample size used for training and calibration. The y-axis shows three different metrics: coverage for the group with algorithmic bias (Color=Blue), average coverage across all groups, and the average size of prediction sets. The results demonstrate that the proposed AFCP method provides a good balance between efficiency and fairness. It offers informative predictions (smaller set sizes) while achieving valid coverage for groups affected by algorithmic bias, unlike the marginal method which undercovers, and the exhaustive method that is too conservative. AFCP1, a variation always selecting an attribute, exhibits slightly more robust performance at smaller sample sizes.
The figure compares prediction sets generated by different methods for individuals in groups disproportionately affected by algorithmic bias. It highlights three methods: Marginal (ignoring fairness), Exhaustive (guaranteeing equalized coverage across all groups but potentially inefficient and uninformative), and the proposed Adaptive Fair Conformal Prediction (AFCP) method. AFCP adaptively selects the most relevant sensitive attribute to address bias. The figure shows that, for certain patients, the marginal method produces prediction sets that do not achieve proper coverage, exhaustive methods produce large, uninformative sets, and only AFCP achieves good coverage within the affected group while maintaining efficiency.
The figure shows the performance comparison of different conformal prediction methods on a synthetic medical diagnosis task. The x-axis represents the sample size, and the y-axis shows three metrics: coverage for the ‘Blue’ group (a specific group that suffers from algorithmic bias), average coverage across all groups, and average prediction set size. The results demonstrate that AFCP achieves a good balance between efficiency (smaller prediction sets) and fairness (higher coverage for the minority group), outperforming other methods.
More on tables

This table presents the results of an experiment evaluating different methods for constructing prediction sets, focusing on groups defined by the feature ‘Color’. It shows the average coverage and size of the prediction sets for each group (Blue and Grey) for four different methods: AFCP, AFCP1, Marginal, Partial, and Exhaustive. The performance metrics are calculated across varying sample sizes (200, 500, 1000, 2000). Green values indicate that coverage falls below the desired threshold (likely 0.9), and red numbers highlight prediction sets that are smaller than desirable. This table offers a detailed breakdown of the performance of these methods, focusing on the bias and efficiency tradeoff.

This table presents the results of the coverage and size of prediction sets from different methods for groups based on the color attribute. The performance of AFCP, AFCP1, Marginal, Partial, and Exhaustive methods are compared for various sample sizes (200, 500, 1000, 2000). The results highlight the effectiveness of AFCP and AFCP1 in providing valid coverage and maintaining small prediction set sizes compared to other methods, especially for the ‘Blue’ group which suffers from algorithmic bias.

This table presents the performance of different conformal prediction methods on groups formed by the color attribute. It shows the coverage and average size of prediction sets for each method (AFCP, AFCP1, Marginal, Partial, Exhaustive) across different sample sizes (200, 500, 1000, 2000). Green numbers highlight low coverage rates, indicating potential bias, while red numbers indicate small prediction set sizes, suggesting higher efficiency. The results allow for a comparison of the methods’ ability to balance equalized coverage and prediction set size.

This table presents the performance comparison of four methods for constructing prediction sets on synthetic medical diagnosis data. The performance is evaluated based on coverage and size of the prediction sets, focusing on the group with algorithmic bias. The table shows that AFCP provides better performance by balancing efficiency and fairness.
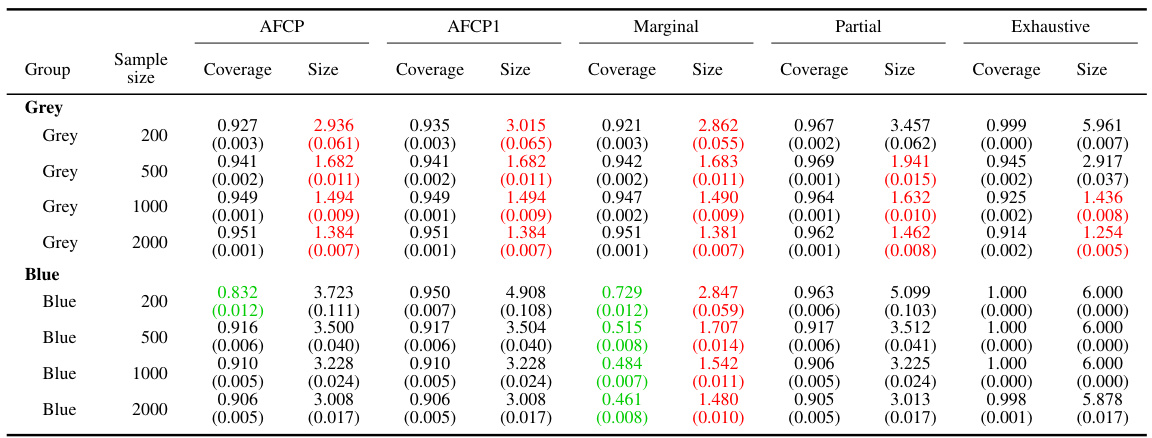
This table presents the results of applying different conformal prediction methods (AFCP, AFCP1, Marginal, Partial, Exhaustive) on synthetic data grouped by the sensitive attribute ‘Color’. For each method, the average coverage and size of prediction sets are shown for different sample sizes (200, 500, 1000, 2000). The table highlights instances of low coverage (green) and small prediction set sizes (red) for different methods and sample sizes, particularly for the ‘Blue’ group. This illustrates the ability of the proposed AFCP methods to mitigate algorithmic bias while producing informative predictions.
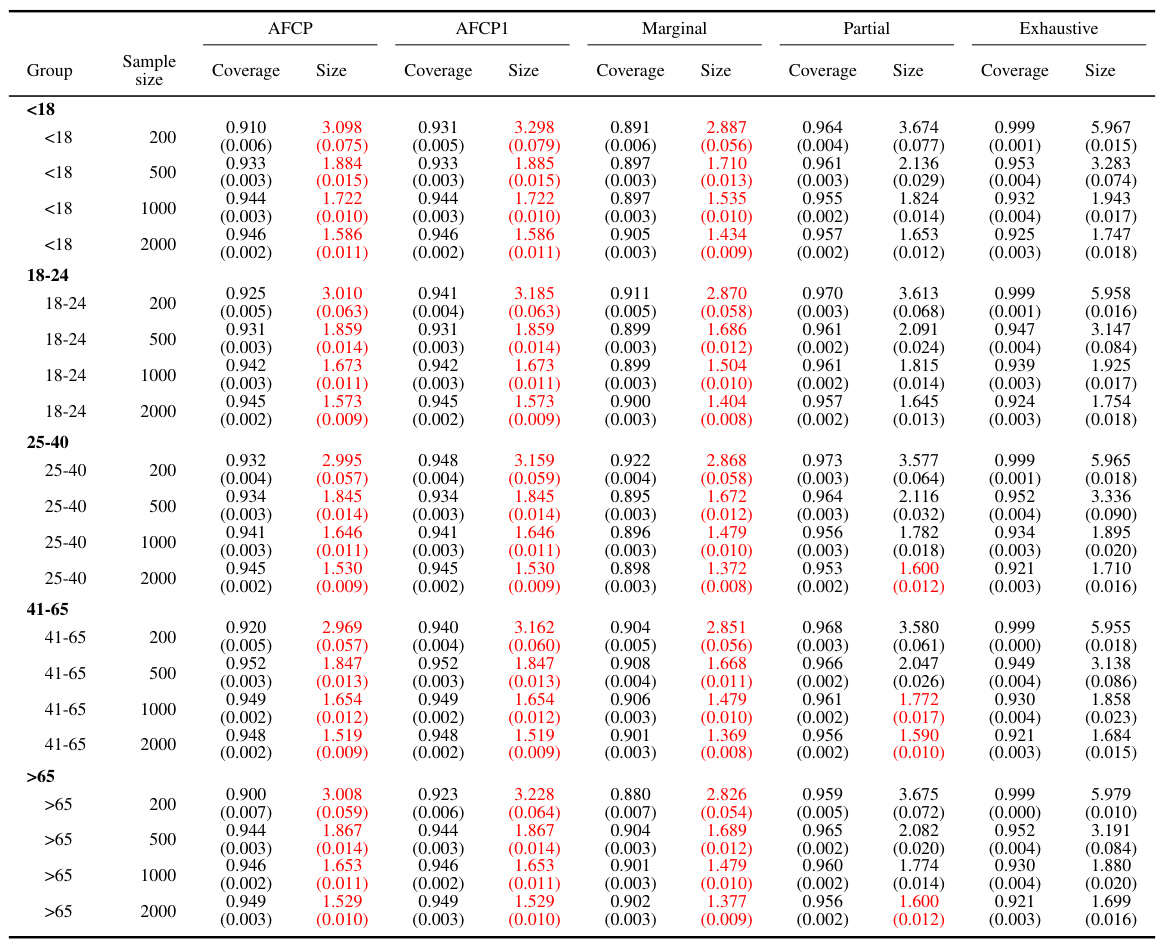
This table presents a comparison of different methods for constructing prediction sets, focusing on groups based on the ‘Color’ attribute. The methods evaluated include AFCP, AFCP1, Marginal, Partial, and Exhaustive. For each method and sample size (200, 500, 1000, 2000), the average coverage and average size of prediction sets are reported for the Blue and Grey groups. Green indicates coverage below the target level, and red indicates small, potentially uninformative, prediction sets.
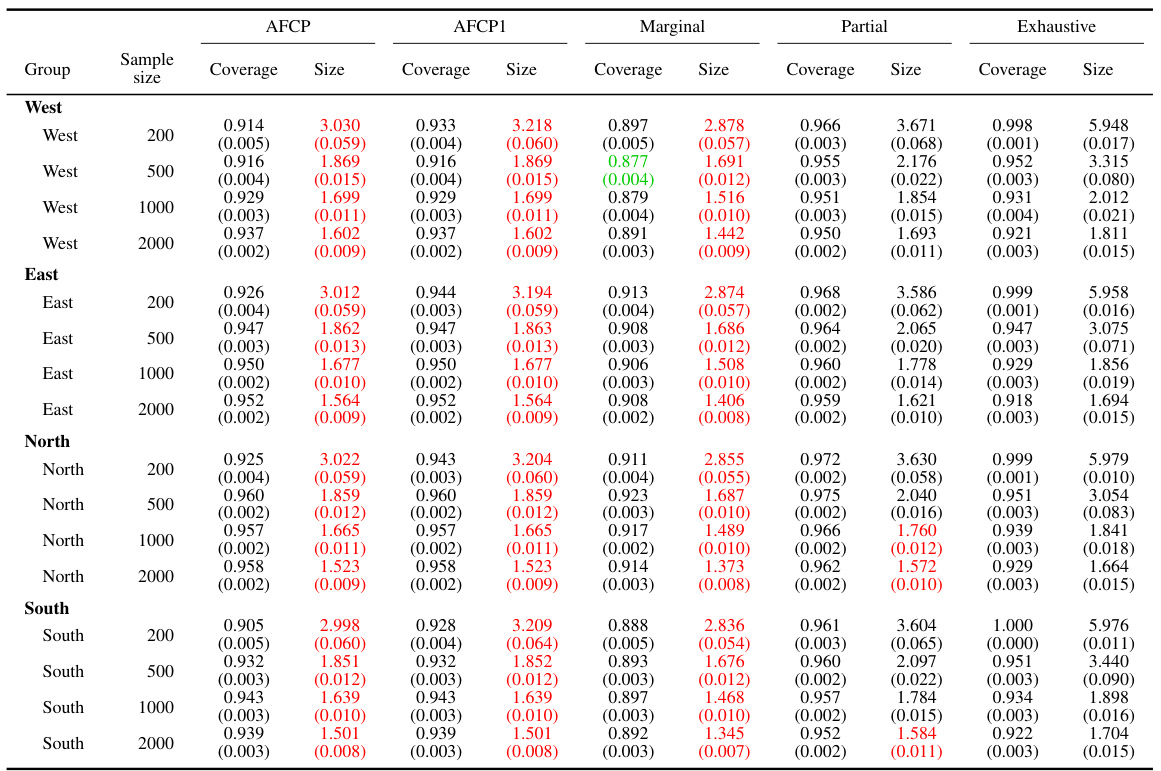
This table presents the performance comparison of different conformal prediction methods (AFCP, AFCP1, Marginal, Partial, and Exhaustive) for groups based on the attribute ‘Color’. The performance is evaluated in terms of coverage and prediction set size. The table shows that the AFCP methods consistently achieve valid coverage, particularly for the group with algorithmic bias, while also maintaining smaller prediction set sizes compared to other methods.
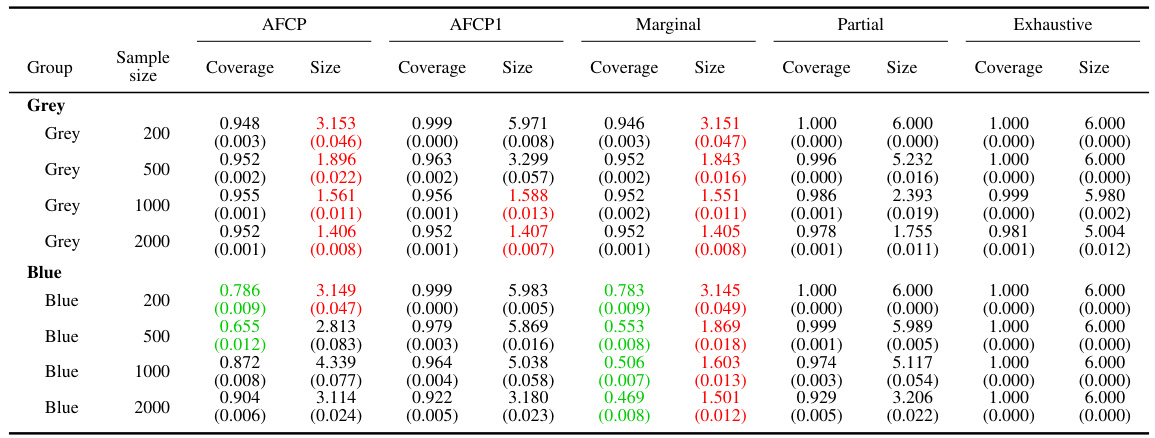
The table shows the performance of different methods (AFCP, AFCP1, Marginal, Partial, and Exhaustive) for constructing prediction sets for groups formed by the ‘Color’ attribute. It presents the coverage and average size of these prediction sets at different sample sizes (200, 500, 1000, and 2000) for both the ‘Blue’ and ‘Grey’ groups. Green numbers highlight cases where the coverage falls below the desired level, while red numbers indicate that the prediction sets are smaller in size. This allows for comparison across methods in terms of bias mitigation and prediction set informativeness.

This table presents the results of the performance comparison of different methods for groups based on the color attribute in a synthetic dataset. It compares the coverage and size of prediction sets for each method across various sample sizes (200, 500, 1000, 2000) and for two color groups (Blue and Grey). Green numbers highlight instances where the coverage is below the desired level, while red indicates small prediction set sizes.
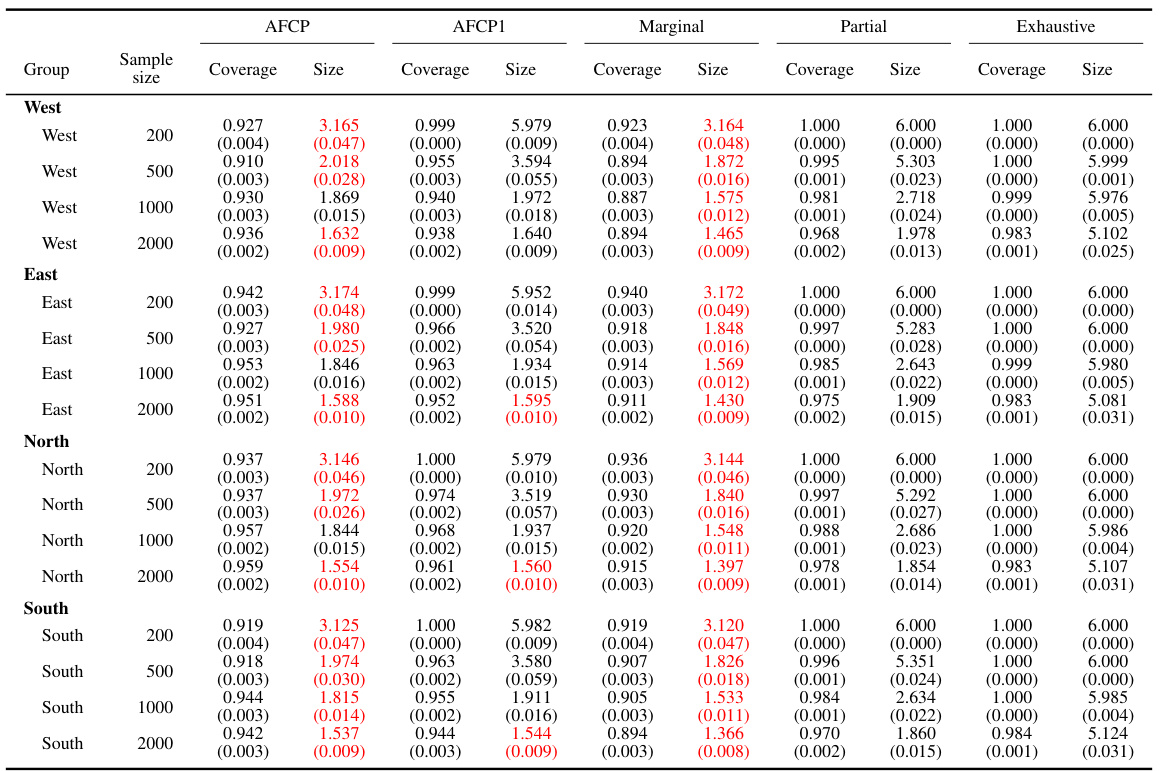
This table presents the performance of different conformal prediction methods on groups formed by the attribute ‘Color’ (Blue or Grey). It displays the coverage and average size of the prediction sets for each method (AFCP, AFCP1, Marginal, Partial, Exhaustive) at different sample sizes (200, 500, 1000, 2000). Green numbers highlight instances where the coverage is below the desired level, indicating potential algorithmic bias, while red numbers indicate unusually small prediction set sizes.
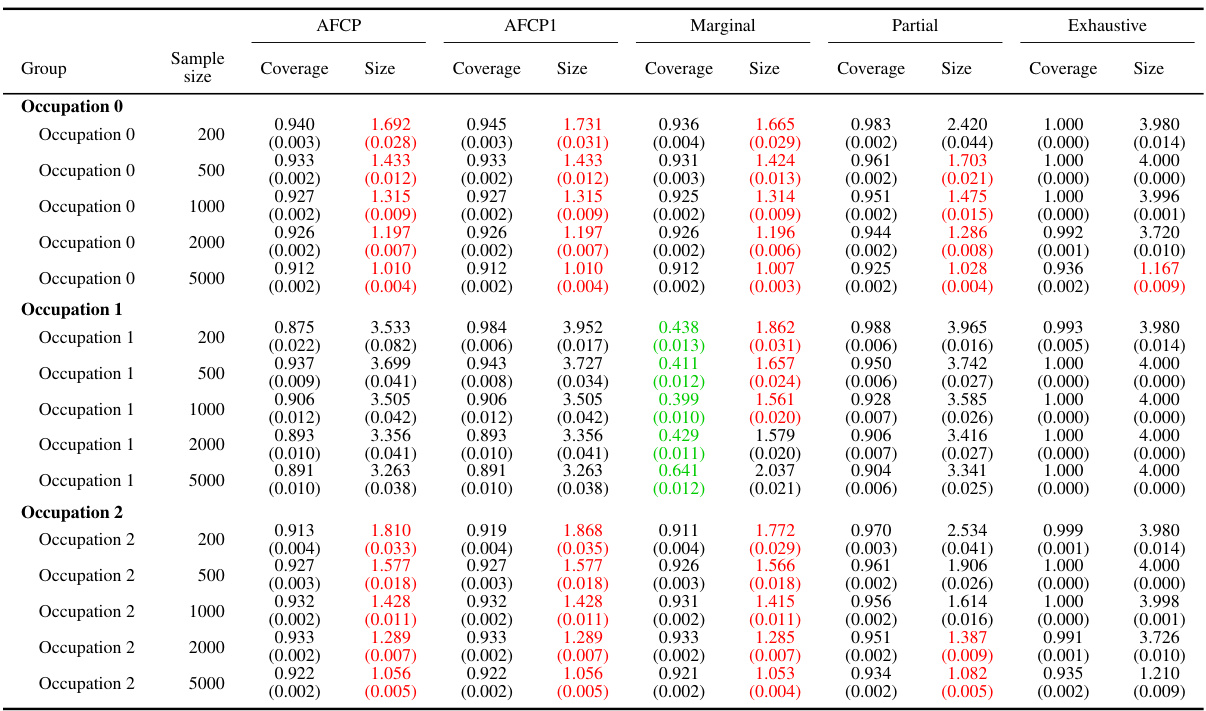
This table shows the performance of different conformal prediction methods for groups based on the color attribute, comparing coverage and prediction set size. The color attribute is manipulated to simulate algorithmic bias, with the ‘Blue’ group designed to have undercoverage. The table presents results for four different methods (AFCP, AFCP1, Marginal, Partial, and Exhaustive) across different sample sizes.

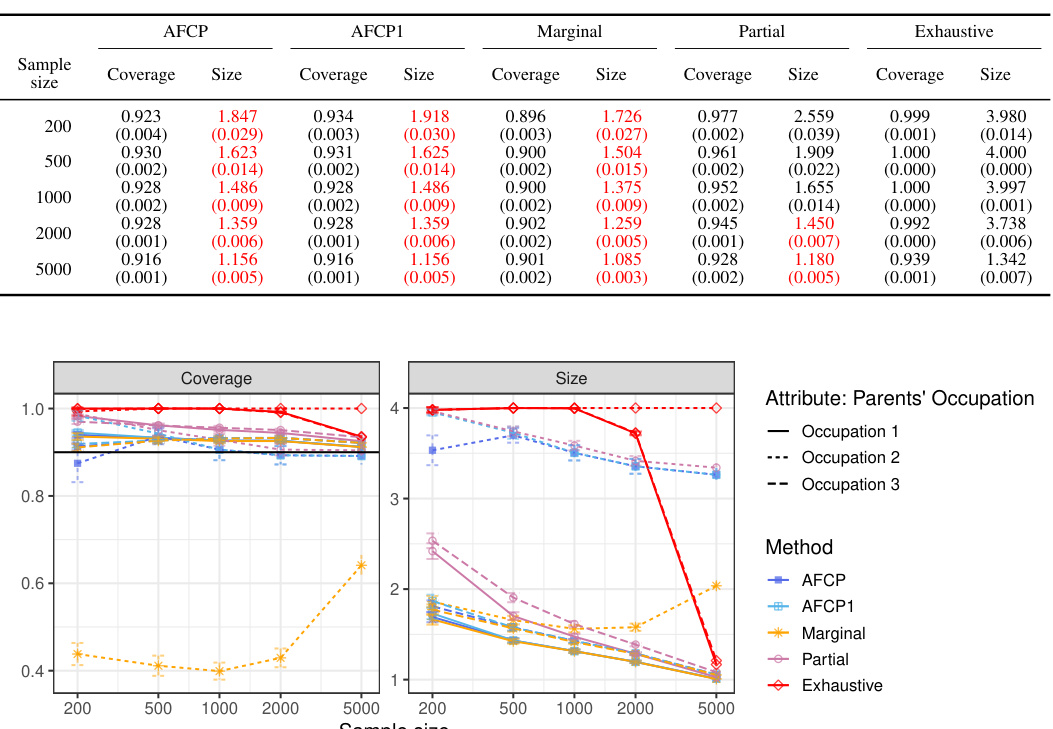
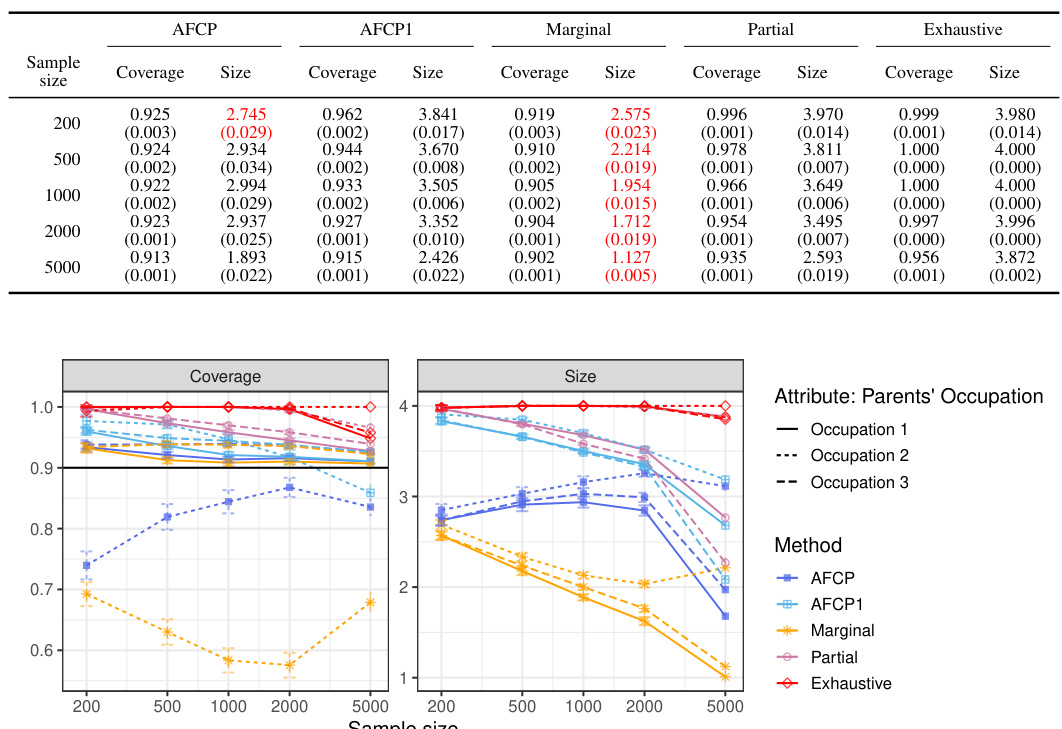
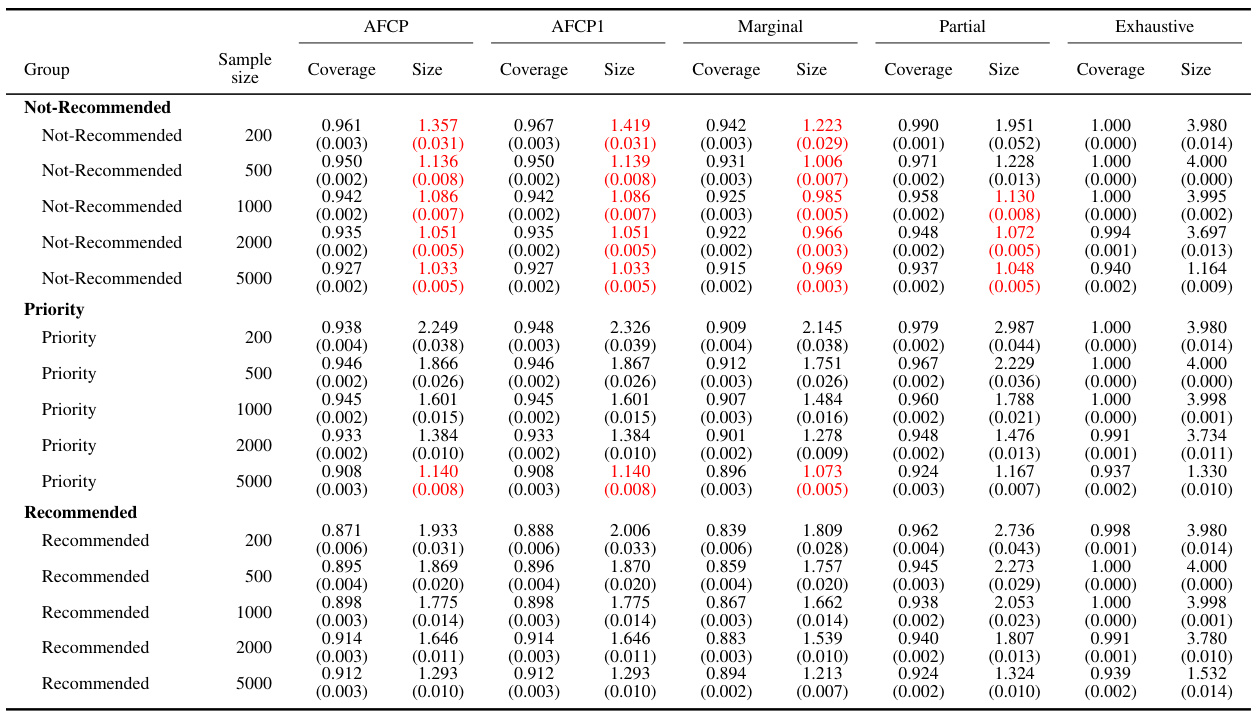
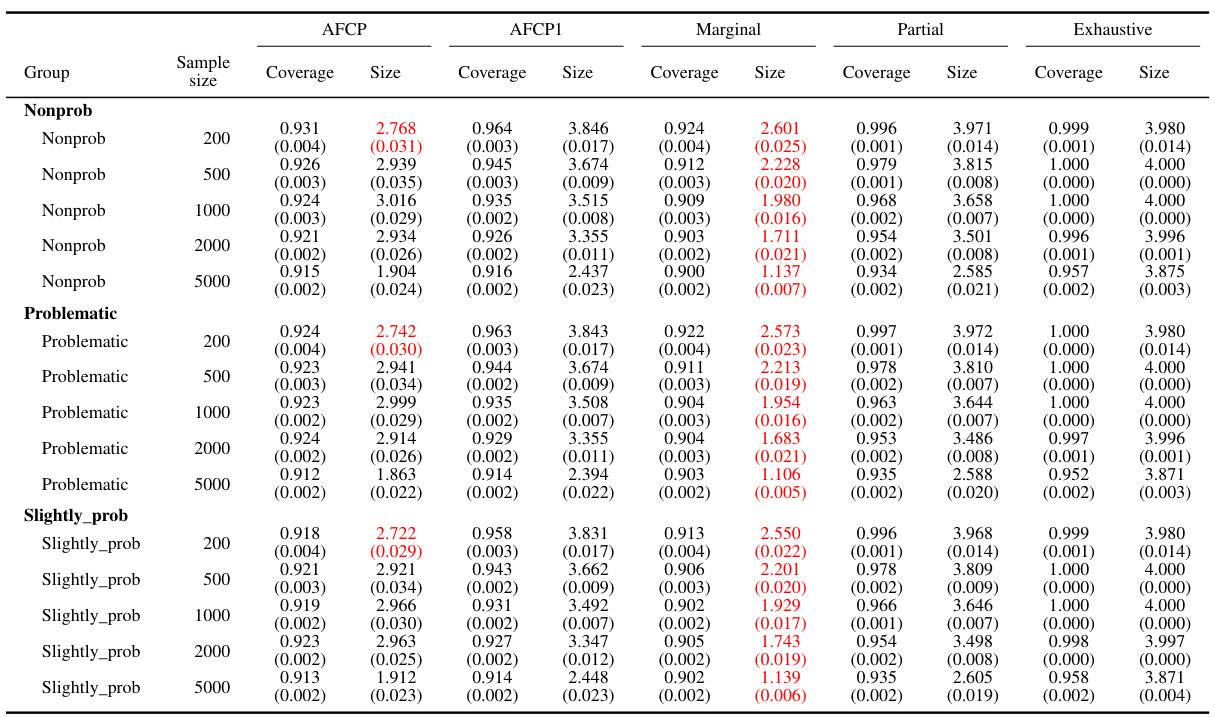
This table presents a comparison of four conformal prediction methods (AFCP, AFCP1, Marginal, and Exhaustive) across different sample sizes (200, 500, 1000, 2000, 5000). The performance metrics reported are coverage (the percentage of prediction sets that include the true label) and size (the average number of labels included in each prediction set). The table shows that AFCP and AFCP1 achieve good coverage with smaller prediction sets than the Exhaustive method, which has very large prediction sets, and similar to the Marginal method, which has slightly lower coverage. This table provides empirical evidence supporting the findings and claims in the paper.

The table shows the performance of different conformal prediction methods on groups formed by the color attribute. It displays the coverage and average size of prediction sets for different sample sizes (200, 500, 1000, 2000). The methods compared are: AFCP, AFCP1, Marginal, Partial, and Exhaustive. The table highlights the tradeoff between coverage and prediction set size, with AFCP and AFCP1 generally showing a balance between high coverage and relatively small prediction set sizes, especially for the groups with low coverage in the Marginal method.

This table presents the results of the comparison of the performance of different conformal prediction methods for groups formed by the sensitive attribute Color, using a simulated medical diagnosis dataset. It shows the coverage and the average size of the prediction sets for different sample sizes (200, 500, 1000, 2000) for the groups defined by the Color attribute (Blue and Grey). It also shows the performance of the Exhaustive, Partial, and Marginal methods, and the proposed AFCP and AFCP1 methods. Green numbers indicate that the coverage is below the desired level (90%), and red numbers indicate prediction sets with average size below 2.
This table presents the coverage and average size of prediction sets generated by different methods for groups based on the Color attribute. It shows the performance of AFCP, AFCP1 (always selects an attribute), Marginal (no attribute selection), Partial (separate calibration for each attribute), and Exhaustive (all attributes selected simultaneously) methods, across various sample sizes (200, 500, 1000, 2000). Green values indicate low coverage, and red values represent small prediction set sizes. This allows for a comparison of the methods’ ability to maintain adequate coverage while producing informative (small) prediction sets, particularly in the context of fairness.
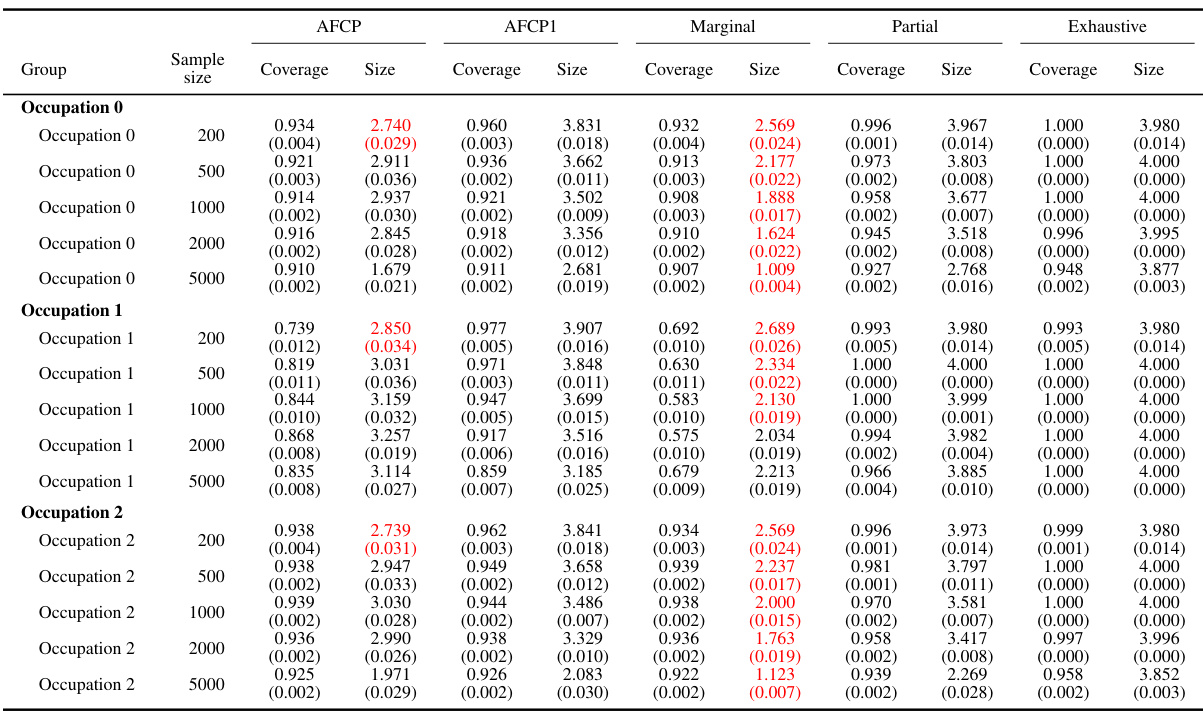
This table presents the results of an experiment comparing different methods (AFCP, AFCP1, Marginal, Partial, Exhaustive) on their ability to generate prediction sets for groups formed by the attribute ‘Color’. Each method’s performance is evaluated in terms of coverage (how often the true label is within the prediction set) and size (the number of labels in the prediction set). The table shows that AFCP and AFCP1 provide a better trade-off between high coverage and small size, particularly for the ‘Blue’ group which shows low coverage in other methods. The table is broken down by sample size and each method’s performance is summarized using both average and standard error.
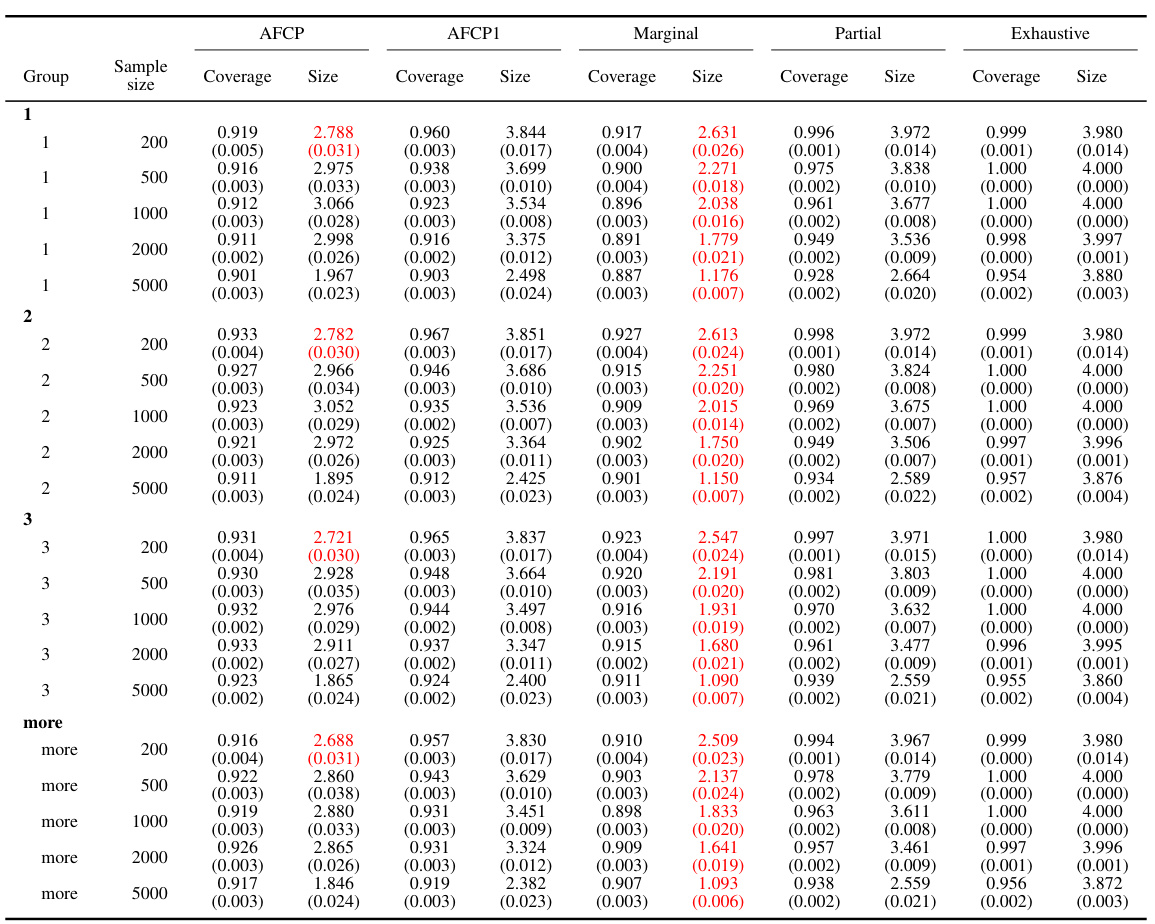
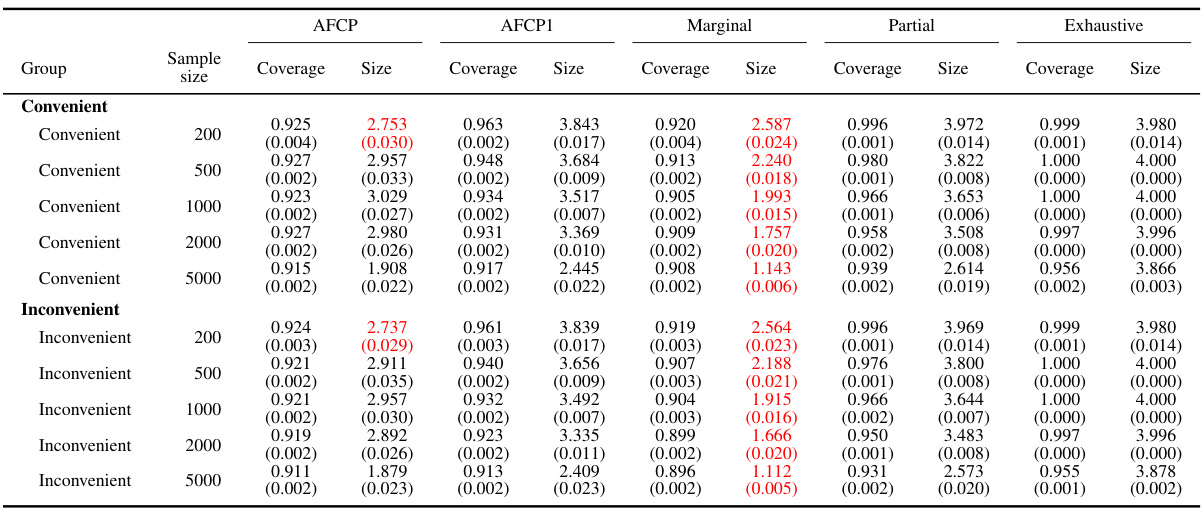
This table presents a quantitative comparison of the performance of different conformal prediction methods across various sample sizes. The methods compared include the proposed AFCP and AFCP1, along with marginal, partial, and exhaustive methods. Key metrics presented are the average coverage and size of prediction sets. The table highlights that AFCP and AFCP1, along with the Marginal method, tend to generate the smallest prediction sets while maintaining a coverage rate above 90%.
This table presents the performance of different conformal prediction methods for groups defined by the color attribute. It shows the coverage and average size of prediction sets for each method across different sample sizes (200, 500, 1000, 2000). The ‘Green’ numbers highlight groups with coverage below the target level, indicating algorithmic bias, while ‘Red’ numbers indicate unexpectedly small prediction sets, which may also be a sign of bias or model limitations. This data is intended to illustrate how the proposed AFCP method achieves a balance between coverage accuracy and set size, in contrast to more simplistic approaches.
This table presents the performance comparison of different conformal prediction methods for groups based on the ‘Color’ attribute. It shows the coverage and average size of prediction sets produced by AFCP, AFCP1, Marginal, Partial, and Exhaustive methods for the ‘Blue’ and ‘Grey’ groups at various sample sizes (200, 500, 1000, and 2000). Green values highlight groups with low coverage, while red values indicate small prediction sets. The table complements Figure A1 which visually represents this data.
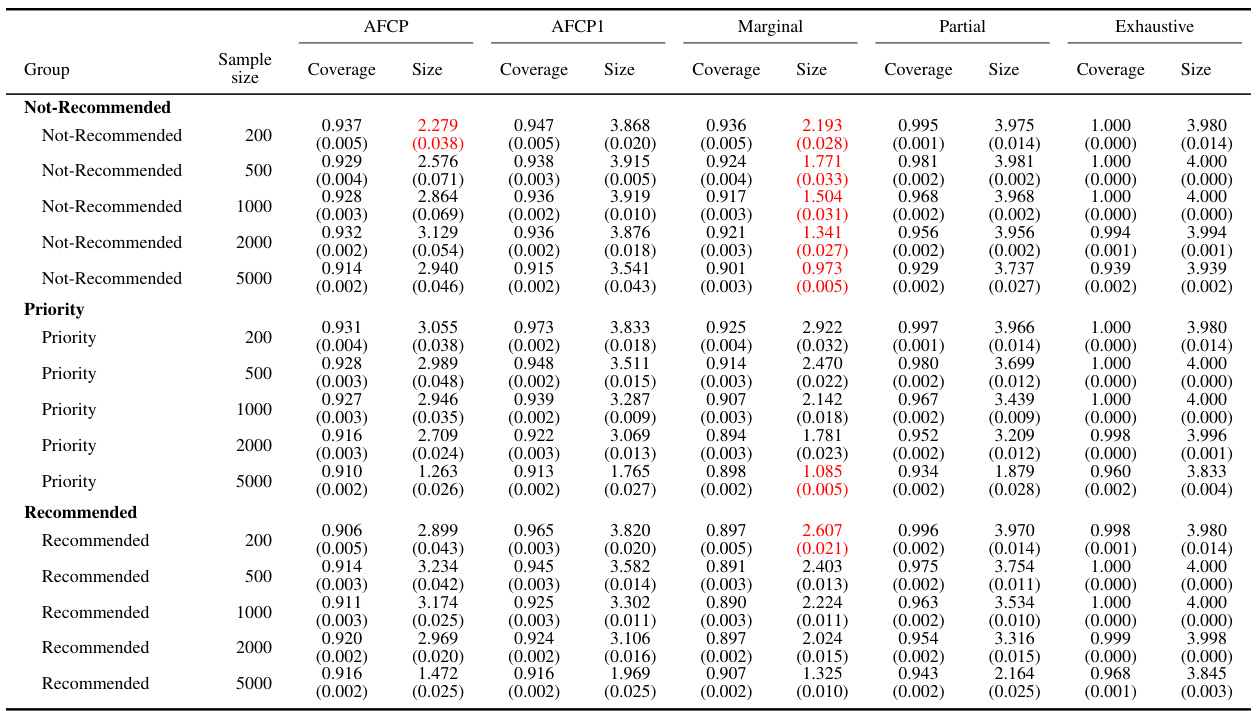
This table presents the performance of different conformal prediction methods for various sample sizes (200, 500, 1000, 2000) on groups formed by the color attribute. The methods compared include AFCP, AFCP1, Marginal, Partial, and Exhaustive. For each method and sample size, the table shows the coverage and average size of prediction sets for the Blue and Grey groups. Green numbers highlight instances where coverage falls below the desired level (indicating potential bias), while red numbers highlight instances where the prediction sets are unusually small (indicating overly precise predictions).

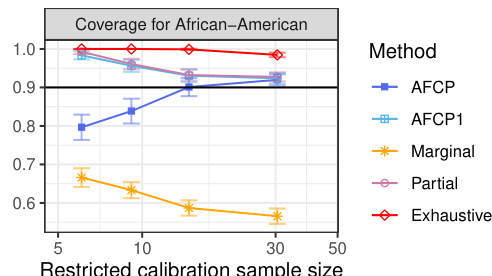
This table presents the average prediction accuracy and the prediction accuracy specifically for the African-American group using the COMPAS dataset. The results are shown for different sample sizes (200, 300, 500, and 1000). It demonstrates how prediction accuracy varies with sample size, highlighting potential disparities in performance between the African-American group and the overall dataset.
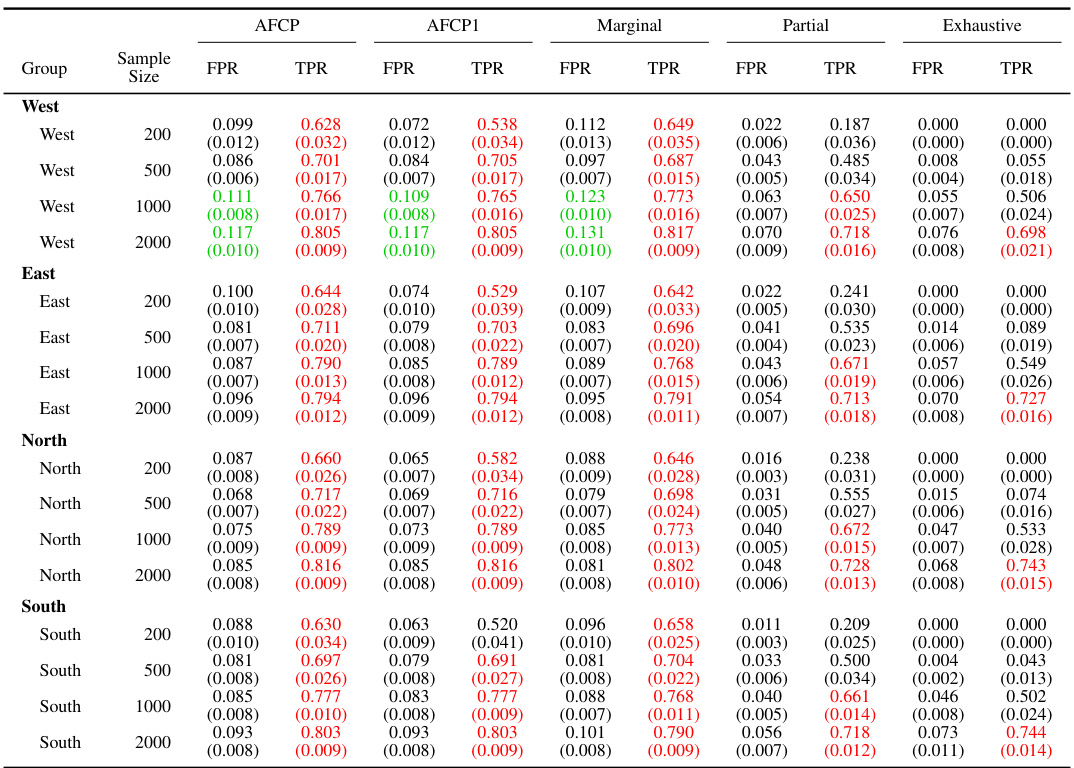
This table presents a detailed breakdown of the performance of various methods in constructing prediction sets for groups categorized by the attribute ‘Color’. The methods compared include AFCP, AFCP1, Marginal, Partial, and Exhaustive, each with varying levels of coverage guarantees. The table shows the coverage and average size of the prediction sets generated by each method for different sample sizes (200, 500, 1000, and 2000). Green numbers highlight instances where coverage is below the desired threshold, while red numbers indicate cases where the prediction set size is unexpectedly small, suggesting potential efficiency issues.
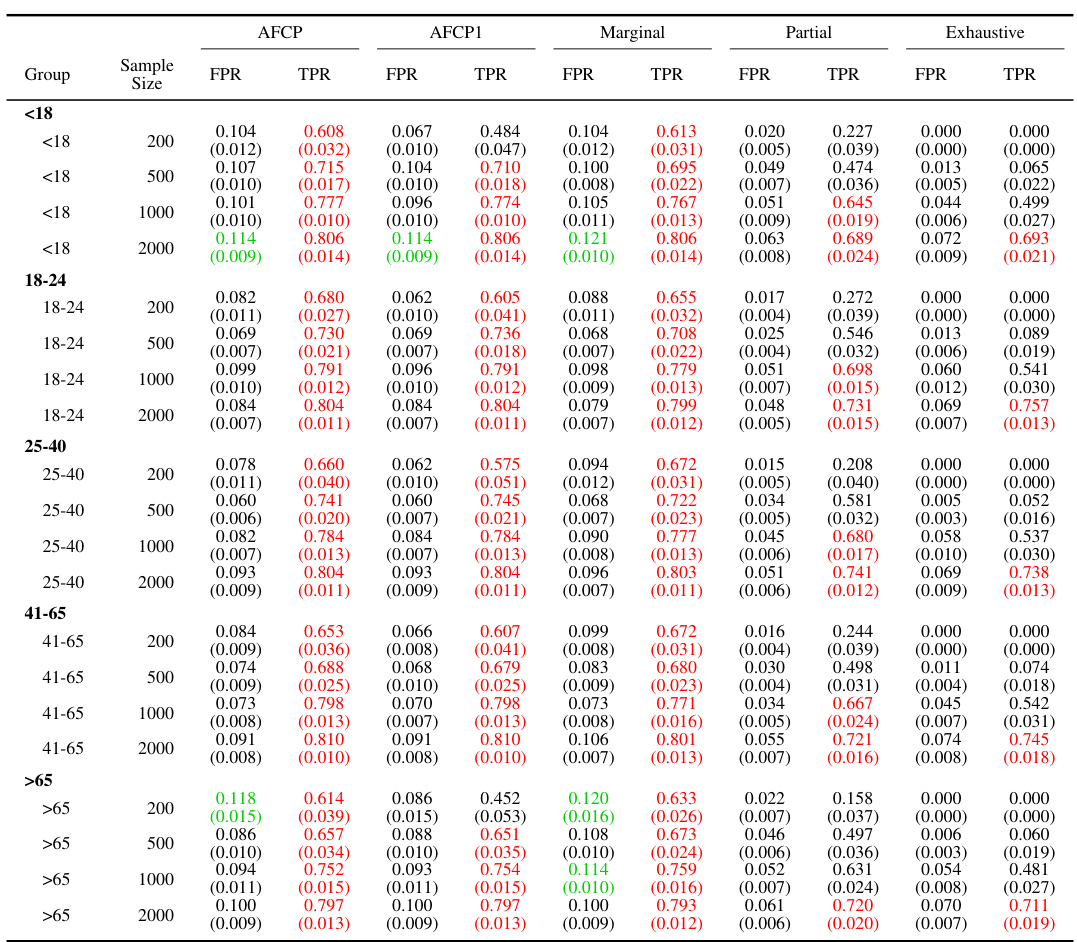
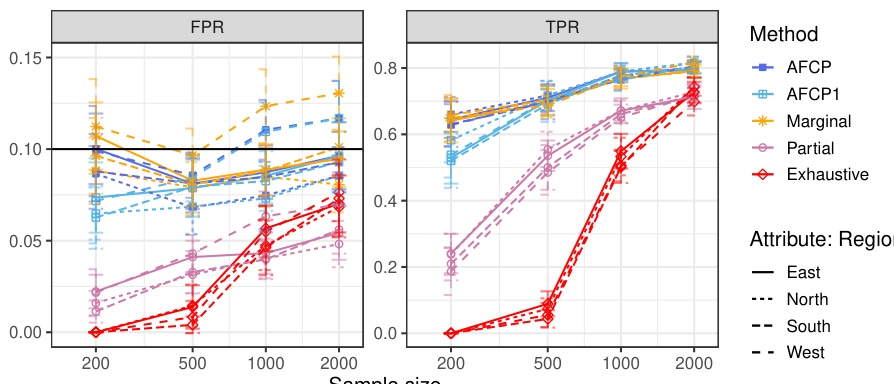
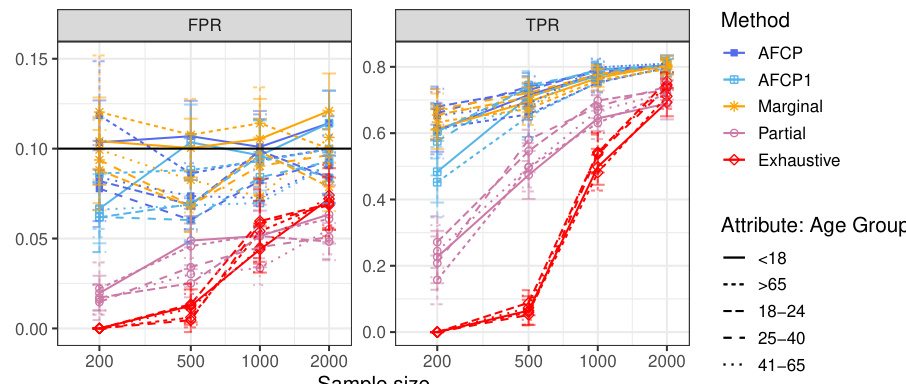
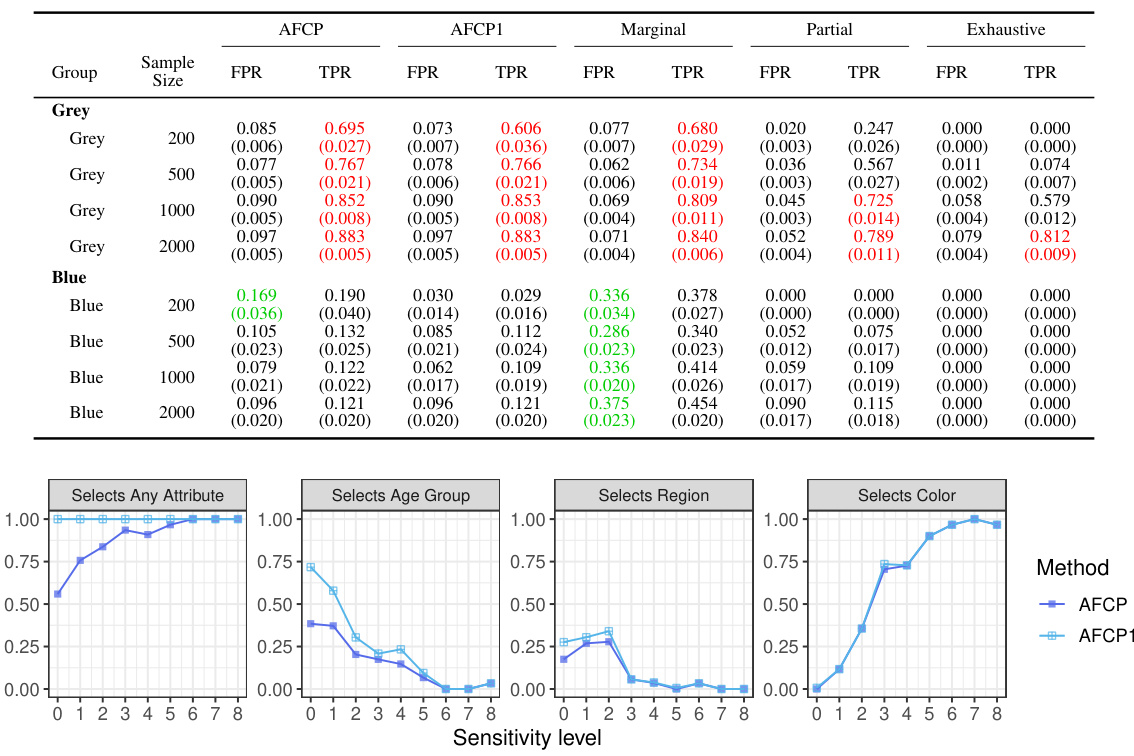
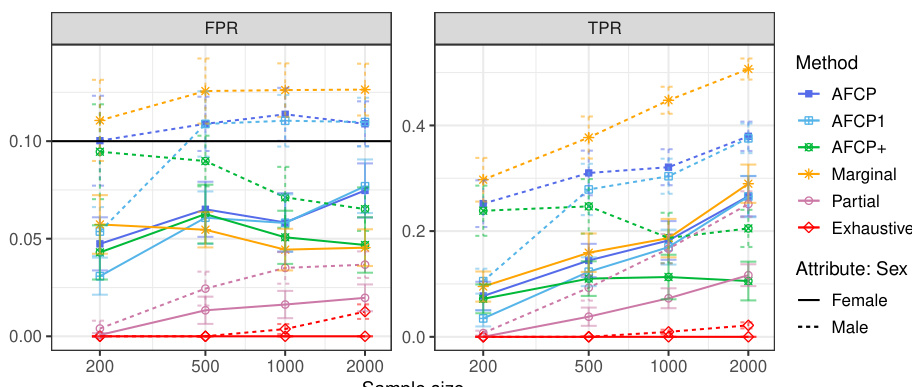
This table presents the performance of different conformal prediction methods (AFCP, AFCP1, Marginal, Partial, and Exhaustive) on a synthetic dataset, focusing on groups defined by the color attribute. The results show average false positive rates (FPR) and true positive rates (TPR) for each method, broken down by color group (Blue and Grey) and sample size. This allows a comparison of the methods’ ability to control false positives while maximizing true positives, especially in the presence of algorithmic bias, which in this experiment is introduced by disproportionate representation in the data.

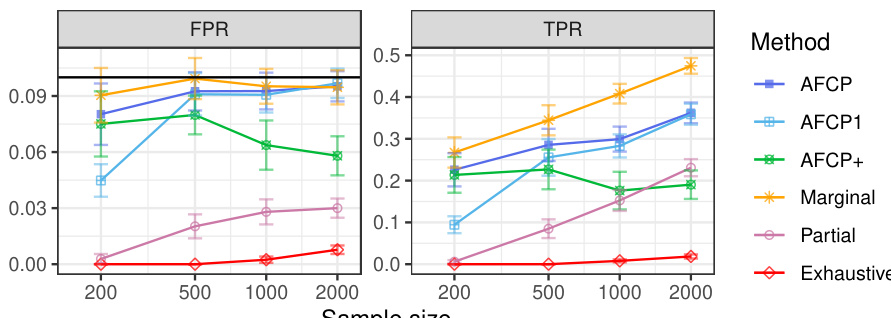
This table presents a comparison of the False Positive Rate (FPR) and True Positive Rate (TPR) achieved by several conformal prediction methods for outlier detection on synthetic data with varying sample sizes. The methods being compared are AFCP, AFCP1, Marginal, Partial, and Exhaustive. The results highlight that while all methods successfully control FPR below 0.1, AFCP and AFCP1 achieve significantly higher TPR than other methods, particularly for the ‘Blue’ group where bias is present, indicating better performance in identifying outliers.

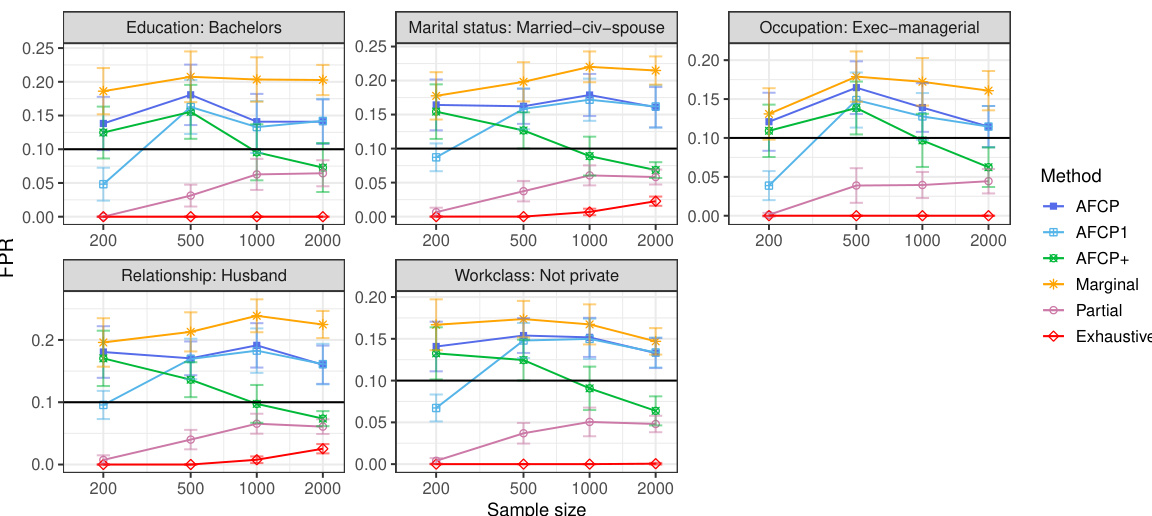
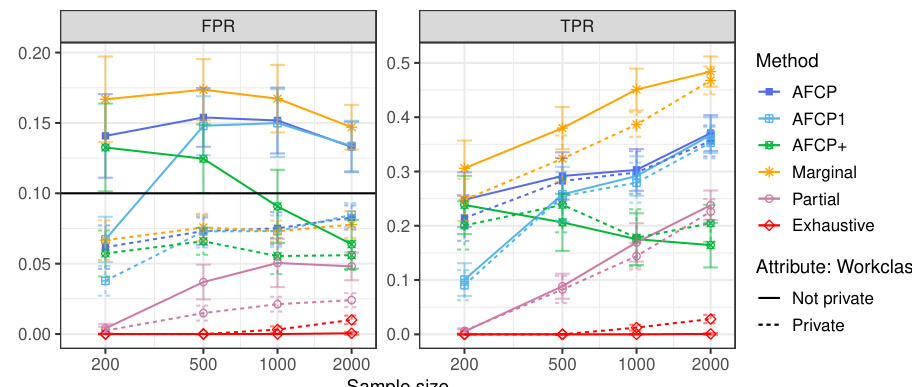
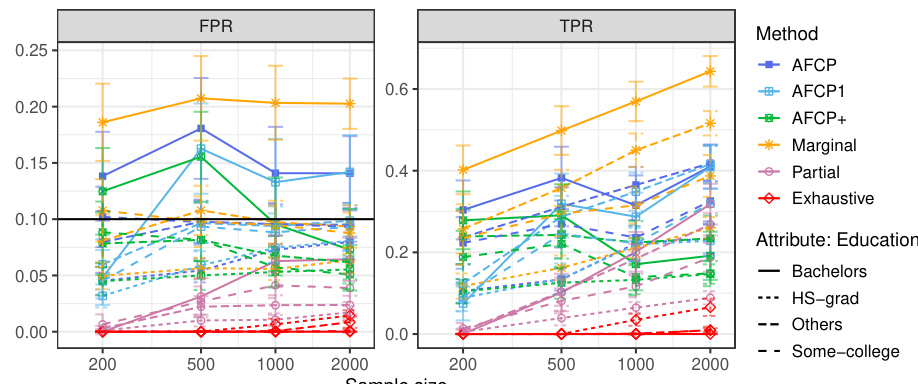
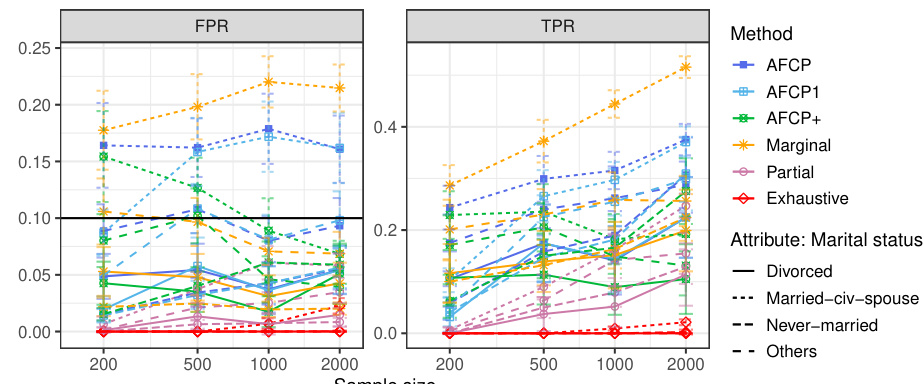
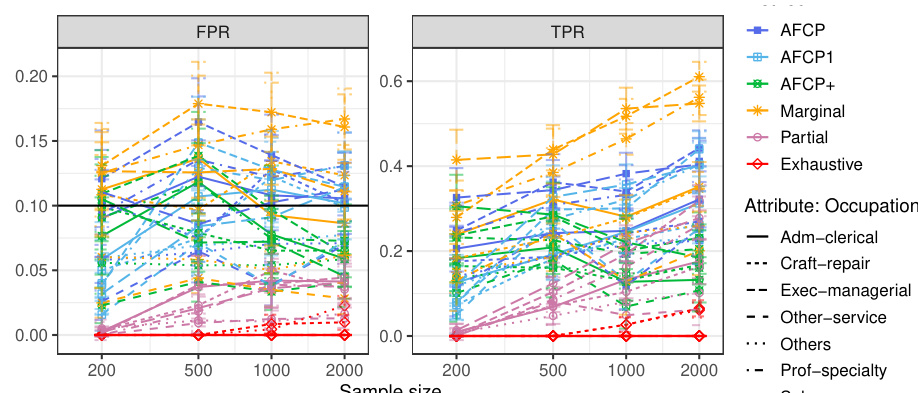
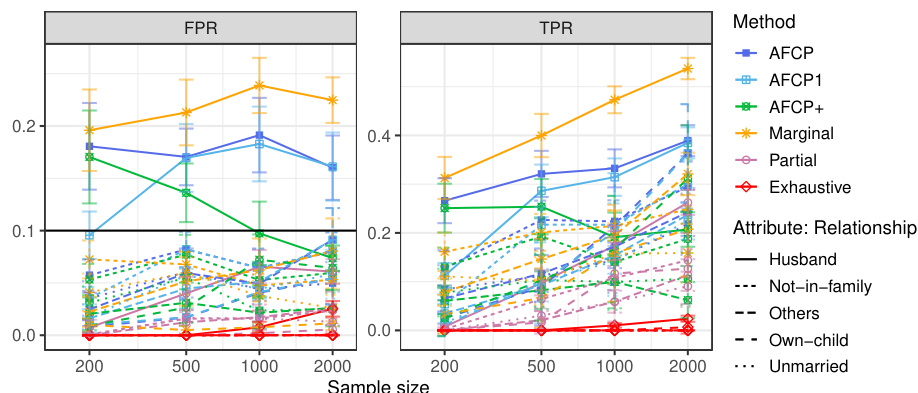
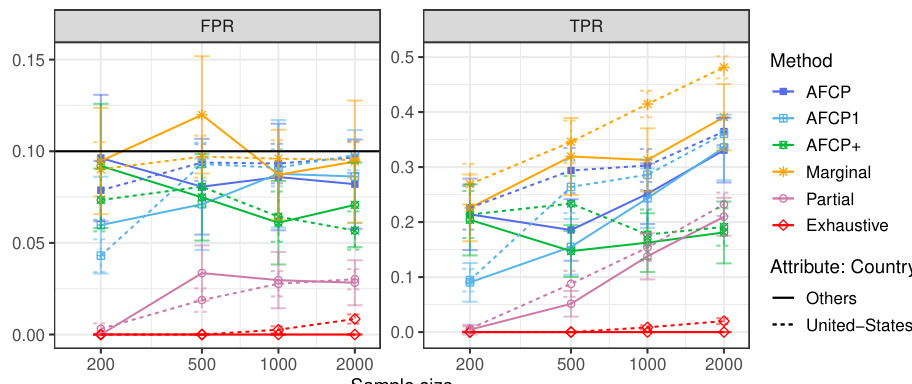
This table presents the results of applying various methods for outlier detection to subgroups of the Adult Income dataset based on their work class. The methods compared include AFCP, AFCP1, AFCP+, Marginal, Partial, and Exhaustive. For each method and work class subgroup, the table shows the false positive rate (FPR) and true positive rate (TPR) along with the average prediction set size. The results illustrate the performance of each method in controlling FPR while maximizing TPR, particularly focusing on any potential bias present in specific groups.
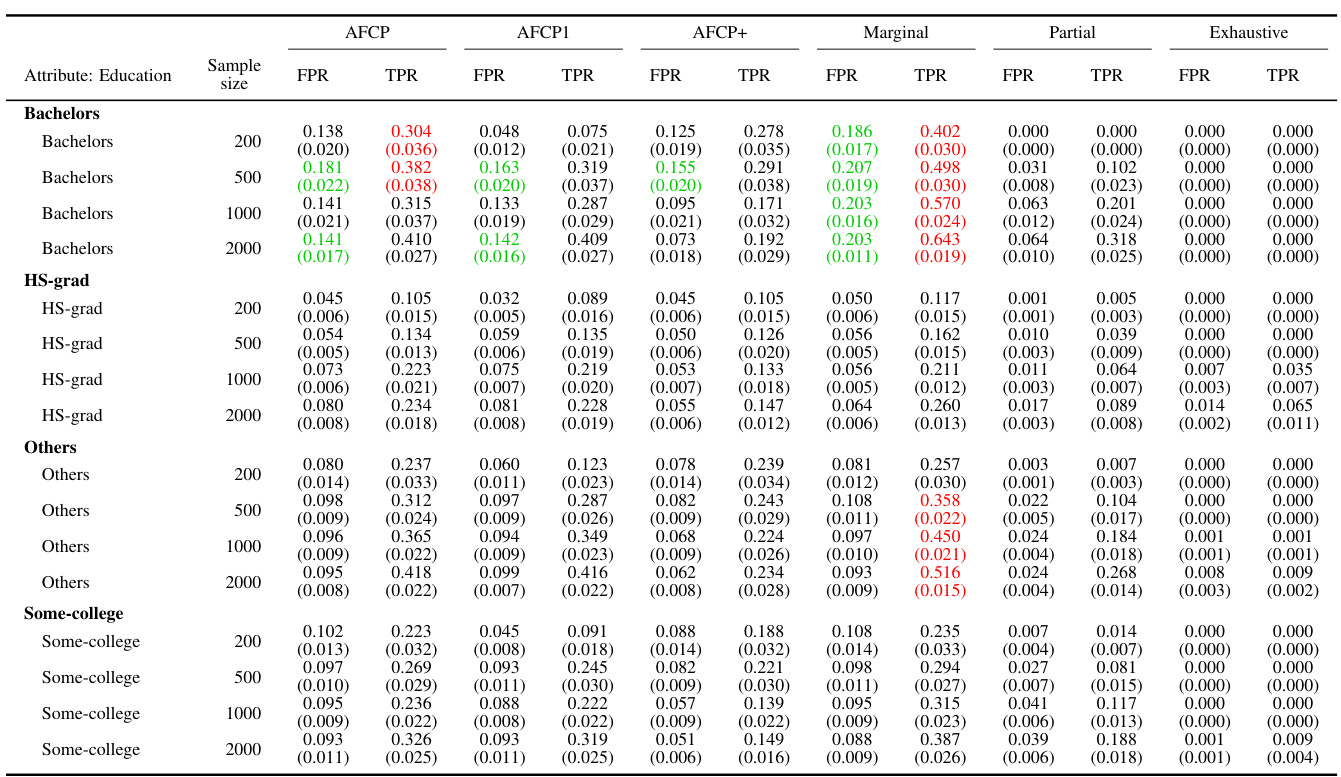
This table presents the results of applying various conformal prediction methods to subgroups based on the ‘Work Class’ attribute. The methods compared are AFCP, AFCP1, AFCP+, Marginal, Partial, and Exhaustive. For each method, the average false positive rate (FPR) and true positive rate (TPR) are shown, along with the average prediction set size, for different sample sizes (200, 500, 1000, 2000). This allows for a comparison of the different methods’ performance and their ability to achieve coverage while controlling for bias across different Work Class subgroups.

This table presents the results of applying different conformal prediction methods to the Adult Income dataset. It shows the false positive rate (FPR) and true positive rate (TPR) for each group formed by work class. The methods compared include AFCP, AFCP1, AFCP+, Marginal, Partial, and Exhaustive, with sample sizes ranging from 200 to 2000.
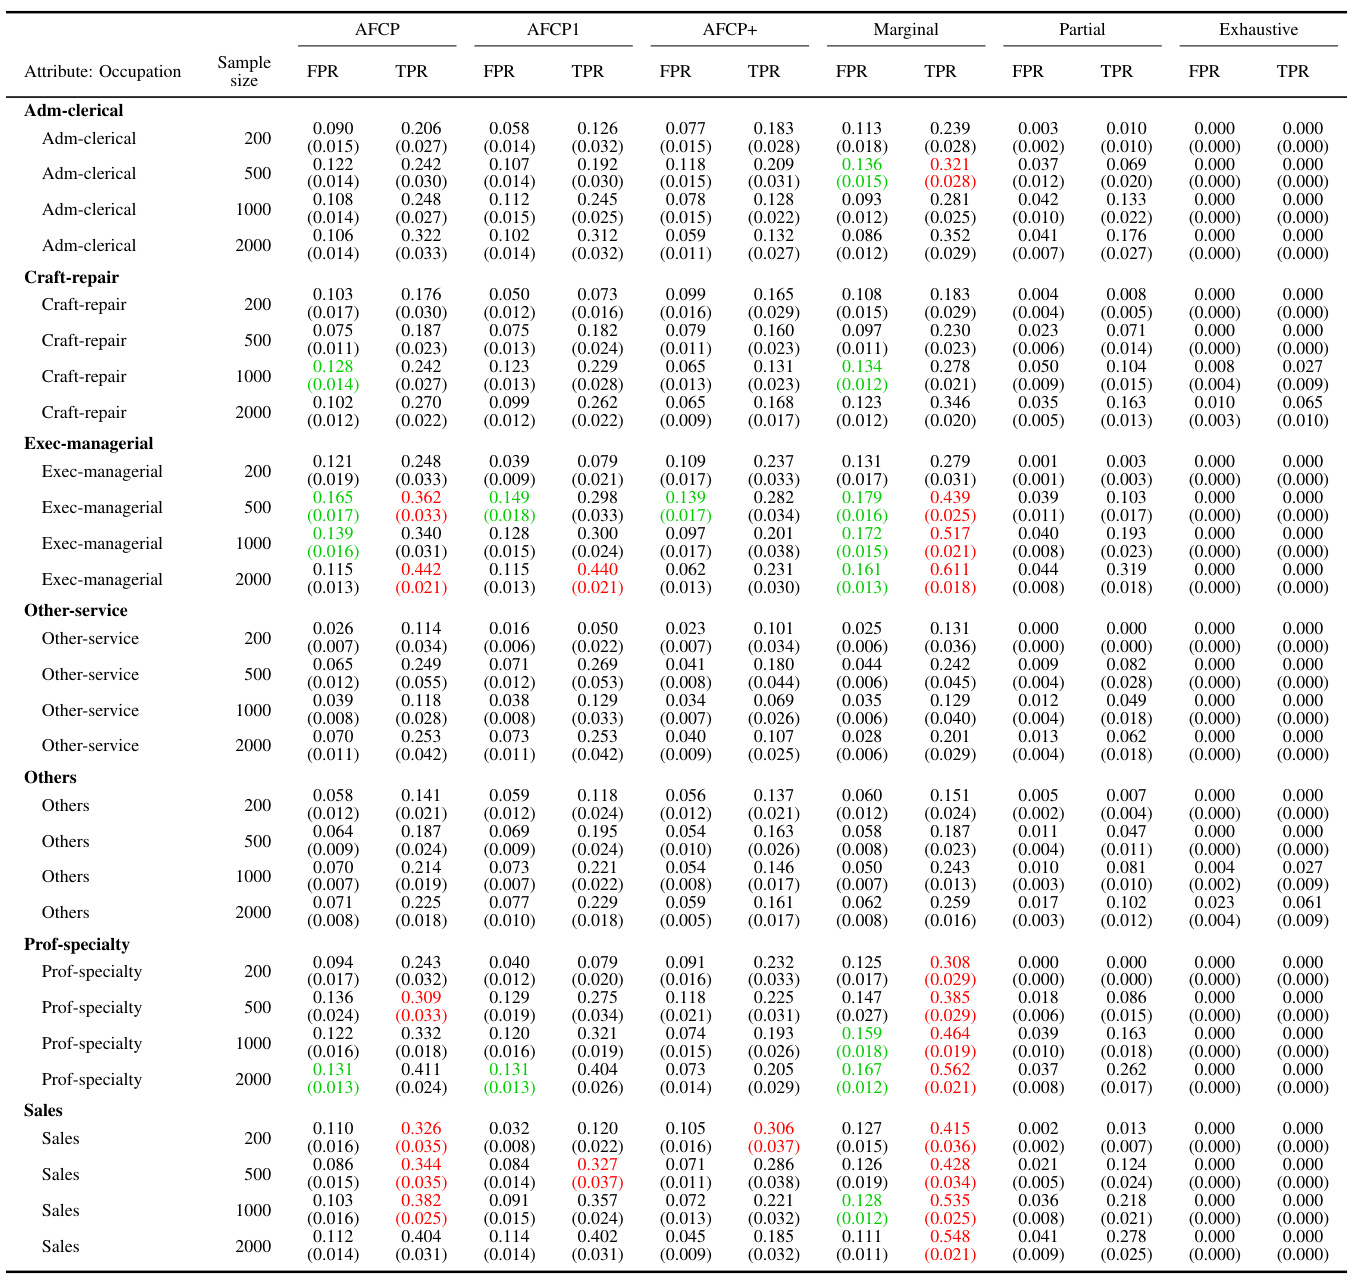
This table presents a detailed breakdown of the performance of various conformal prediction methods (AFCP, AFCP1, AFCP+, Marginal, Partial, and Exhaustive) across different subgroups defined by the ‘Work Class’ attribute. For each method, the table shows the false positive rate (FPR) and true positive rate (TPR) of the constructed prediction sets, along with their average sizes. The results are shown for several sample sizes (200, 500, 1000, 2000) to illustrate how the performance of the methods varies with data availability. The table complements Figure A29, which graphically depicts the same information.
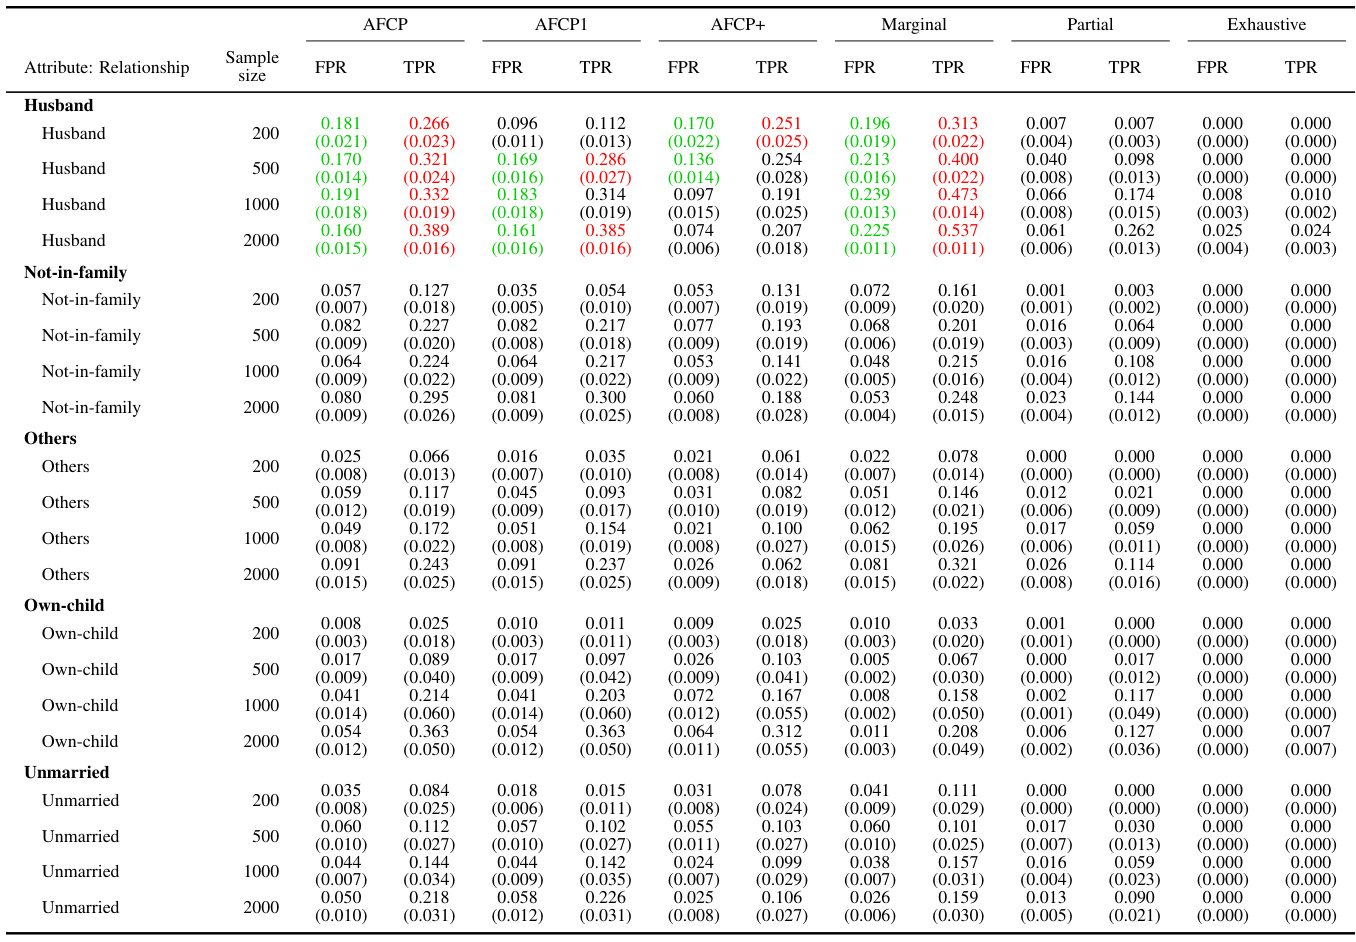
This table shows the empirical performance of different conformal prediction methods in terms of coverage and prediction set size for various subgroups based on the ‘Work Class’ attribute. It complements Figure A29, providing detailed numerical results to support the visual trends shown in that figure. The table shows how the AFCP, AFCP1, and AFCP+ methods compare to marginal, partial, and exhaustive methods. Green shading indicates low coverage, and red numbers indicate small prediction set sizes.
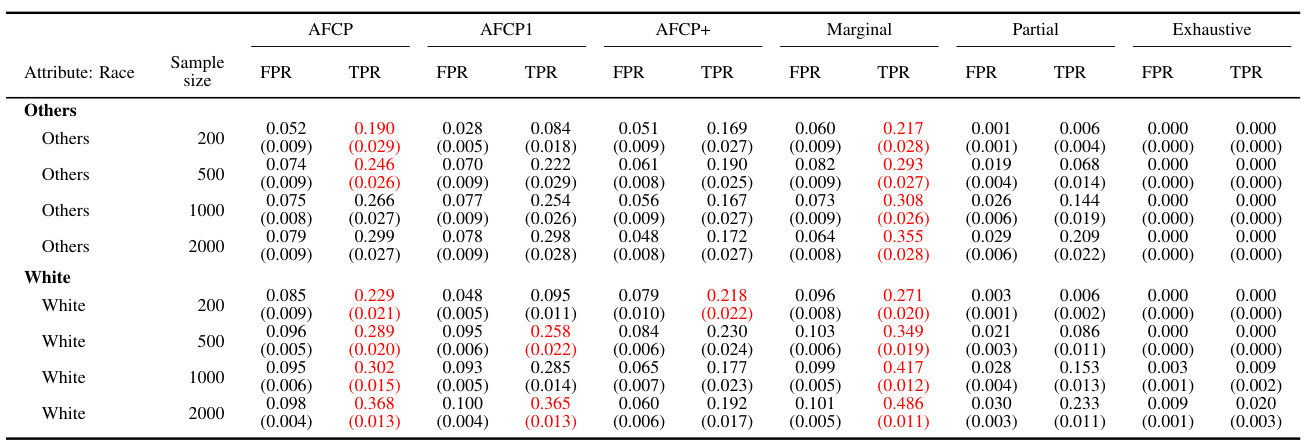
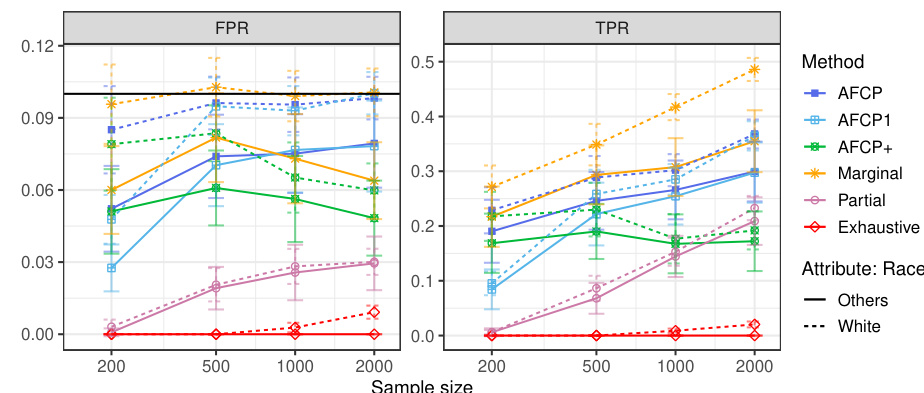
This table presents the results of different conformal prediction methods for groups based on the color attribute. It shows the False Positive Rate (FPR), True Positive Rate (TPR), and average set size for each method (AFCP, AFCP1, AFCP+, Marginal, Partial, Exhaustive) across different sample sizes (200, 500, 1000, 2000). The results are presented separately for the Blue and Grey groups, allowing for a comparison of method performance across different groups and sample sizes. The table complements Figure A23.
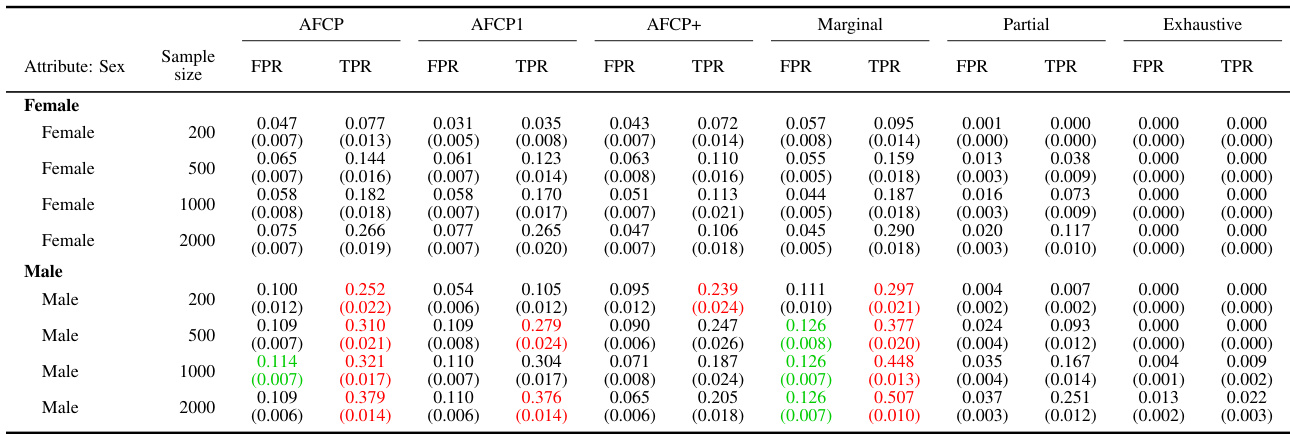
This table presents the results of the outlier detection experiments on synthetic data, focusing on the groups formed by the color attribute (Blue or Grey). It compares the performance of different conformal prediction methods (AFCP, AFCP1, AFCP+, Marginal, Partial, Exhaustive) in terms of the False Positive Rate (FPR) and True Positive Rate (TPR). The results are shown for various sample sizes (200, 500, 1000, 2000). The table helps to illustrate how the chosen methods handle algorithmic bias and achieve the desired coverage guarantees. Green numbers indicate low coverage and red numbers indicate the small size of prediction sets.

This table presents the results of the outlier detection experiments on synthetic data for groups formed by the sensitive attribute Color (Blue and Grey). It shows the false positive rate (FPR), true positive rate (TPR), and average size of prediction sets produced by several different methods: AFCP, AFCP1, AFCP+, Marginal, Partial, and Exhaustive. The results are broken down by sample size (200, 500, 1000, and 2000), and the table allows for a comparison of the methods’ performance in controlling the false positive rate while maximizing true positives. Red numbers highlight small prediction set sizes.
Full paper#


