↗ OpenReview ↗ NeurIPS Homepage ↗ Chat
TL;DR#
Deep reinforcement learning (DRL) suffers from issues like sample inefficiency and instability. Understanding the learning dynamics of DRL agents, specifically how policy networks evolve, is crucial for finding remedies to these problems. This paper empirically investigates how policy networks of DRL agents change over time in popular benchmark environments like MuJoCo and DeepMind Control Suite (DMC).
To address the issues, the authors propose a method called Policy Path Trimming and Boosting (PPTB). PPTB leverages a novel temporal SVD analysis to identify major and minor parameter directions. It trims policy updates in minor directions and boosts updates in major directions. The results show that PPTB improves the learning performance (scores and efficiency) of TD3, RAD, and DoubleDQN across various benchmark environments. This simple plug-in method is highly effective and readily applicable to various DRL algorithms.
Key Takeaways#
Why does it matter?#
This paper is important because it offers a novel perspective on improving deep reinforcement learning (DRL) by analyzing the learning dynamics of policy networks. It introduces a practical and easily implementable method, PPTB, showing improvements in DRL algorithms across various benchmark tasks. This opens new avenues for research in understanding and enhancing the efficiency and stability of DRL, a crucial area in AI research. The findings challenge conventional DRL training approaches and suggest that focusing on specific, important parameter directions can significantly boost performance.
Visual Insights#

This figure displays the results of an empirical investigation on the policy parameter change and detour. The left panels show the CDF histograms of the accumulated parameter change for each layer (1, 2, 3) of the policy network in the MuJoCo Hopper and DMC walker environments. The right panels show the CDF histograms of the detour ratio for each layer, indicating the extent of detours during the parameter update process. The results highlight the asymmetry in parameter changes and the significant detours observed in many parameters.

This table presents the performance evaluation of the proposed method, PPTB, when applied to the TD3 algorithm across four MuJoCo environments. It compares the performance of TD3 with and without PPTB using two metrics: Score (best average return across multiple runs) and AUC (mean of average returns over the learning process). The results demonstrate that PPTB improves the learning performance of TD3 in terms of both effectiveness (Score) and efficiency/stability (AUC). The Aggregate rows show the relative improvement across all environments.
In-depth insights#
Policy Path Dynamics#
Analyzing policy path dynamics in reinforcement learning (RL) offers crucial insights into the learning process. Understanding how policy parameters evolve over time is key to addressing challenges like sample inefficiency and instability. By examining the parameter trajectories, researchers can identify patterns and trends, potentially revealing inherent limitations or biases in the learning process. This analysis can inform the design of improved algorithms by revealing suboptimal learning patterns, such as unnecessary oscillations or detours in the parameter space. Techniques such as singular value decomposition (SVD) can help reduce the dimensionality of the parameter space, highlighting the principal directions of learning and providing opportunities to streamline the learning process. This approach has practical implications for algorithm design, enhancing training efficiency and leading to more robust and effective RL agents. Further study of these dynamics holds the promise of unraveling the complex interplay between algorithm design and the inherent characteristics of the RL environment.
PPTB Method#
The core of the paper centers around the proposed Policy Path Trimming and Boosting (PPTB) method, a novel technique designed to enhance the efficiency and performance of Deep Reinforcement Learning (DRL) algorithms. PPTB leverages the observation that DRL policy networks evolve predominantly along a limited number of major parameter directions, while exhibiting oscillatory behavior in minor directions. The method cleverly trims the learning path by canceling updates in minor parameter directions and boosts progress along major directions. This is achieved using temporal Singular Value Decomposition (SVD) to identify these principal directions of change. The practical impact is demonstrated through improved performance across several benchmark environments, showcasing PPTB’s effectiveness as a general improvement applicable to various DRL agents.
Low-Dim. Analysis#
Low-dimensional analysis of high-dimensional data is a powerful technique to uncover hidden structures and simplify complex systems. In the context of reinforcement learning, this approach focuses on identifying the most significant directions of parameter evolution within the policy learning path. By applying dimensionality reduction methods, such as Singular Value Decomposition (SVD), one can discover a low-dimensional subspace that captures the essence of the learning process, effectively filtering out the noise and simplifying the representation. This reduction can reveal asymmetric parameter activity, highlighting which directions are most important for learning success. Furthermore, it sheds light on the nature of the policy learning path itself, identifying the presence of significant detours and oscillations in some directions. This allows for a deeper understanding of how policies evolve, aiding in the development of more efficient and stable algorithms. Pinpointing the major and minor directions also enables techniques like Policy Path Trimming and Boosting (PPTB), which leverages this understanding to improve learning performance and efficiency. In essence, low-dimensional analysis helps distill crucial insights from the complexity of high-dimensional deep reinforcement learning, leading to a more profound understanding of the underlying dynamics and paving the way for improved algorithms.
Empirical Findings#
The empirical findings section of this research paper would likely present a detailed analysis of the data collected during the experiments, focusing on how the policy networks of deep reinforcement learning (DRL) agents evolve during the training process. Key findings would probably center on the asymmetric activity of policy network parameters, where some parameters change significantly while others remain relatively static. The observed phenomena might show that policy networks advance monotonically along a small number of major parameter directions while undergoing harmonic-like oscillations in minor directions. The analysis would likely use techniques like temporal singular value decomposition (SVD) to identify these major and minor directions, supporting the hypothesis that DRL agents learn efficiently by concentrating their updates in a low-dimensional subspace of the entire parameter space. Detours in parameter updates are also an important finding, highlighting the non-monotonic nature of the learning process. The results of the empirical studies would support the proposed method’s effectiveness in improving the learning performance of several DRL algorithms.
Future Research#
Future research directions stemming from this work could explore several promising avenues. Extending the theoretical understanding of the observed phenomena, particularly the low-dimensional nature of policy evolution, is crucial. This might involve rigorously analyzing policy gradients and their interaction with the value function, potentially uncovering deeper connections to optimization theory and the dynamics of deep neural networks. Investigating the generalizability of Policy Path Trimming and Boosting (PPTB) to a broader range of DRL algorithms and environments, including sparse-reward scenarios and those with high dimensionality, is essential for establishing its practical relevance. Exploring the potential synergy between PPTB and other techniques such as curriculum learning or meta-learning is another important area. Furthermore, studying the relationship between the low-dimensional policy path and the expressiveness of the policy network could lead to novel insights for architecture design and improving sample efficiency. Finally, developing more robust and adaptive versions of PPTB, such as methods that automatically determine the number of principal components or dynamically adjust the boosting coefficient, would significantly enhance its practicality and performance.
More visual insights#
More on figures

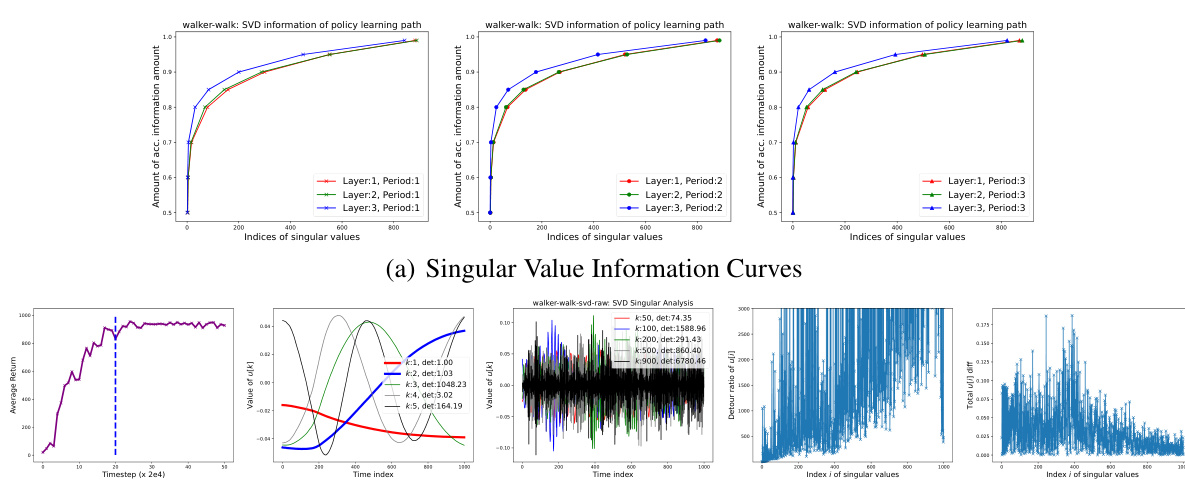
This figure presents the results of a temporal singular value decomposition (SVD) analysis applied to policy learning paths generated by the RAD algorithm on the DMC walker-walk task. Panel (a) shows how the dimensionality of the policy learning path changes depending on the information threshold. Panel (b) illustrates the evolving paths of different dimensions of the policy (major and minor directions) along with their detour ratios and final parameter changes.

This figure conceptually illustrates the Policy Path Trimming and Boosting (PPTB) method. The left panel shows a 2D representation of a typical policy learning path in the policy parameter space. The path is depicted as a sequence of points (θt) connected by lines, showing the evolution of policy parameters during training. Major directions are represented by green arrows, while minor directions are shown in red. The right panel shows how PPTB improves the learning path. PPTB trims the updates in minor directions (red crosses), effectively smoothing the path. Additionally, it boosts the updates in major directions (yellow arrows), enhancing the learning progress. The trimmed and boosted path is now more direct and efficient, highlighting the improvement achieved by PPTB.

This figure presents the results of an empirical investigation on policy learning paths using behavior cloning with Adam and SGD optimizers. It shows the parameter analysis (CDFs of accumulated parameter change) and temporal SVD analysis (singular values and left unitary matrix) for both Adam and SGD. The goal was to examine how parameters change during training and identify the dominant directions of parameter evolution using temporal SVD. This allows for a comparison of learning dynamics under different optimizers (Adam and SGD) in an offline reinforcement learning setting.

This figure displays the results of an empirical investigation into how policy parameters change and detour during the training process of two different deep reinforcement learning (DRL) agents: TD3 and RAD. It uses CDF histograms to visualize the accumulated parameter changes and detour ratios for each layer (1, 2, and 3) of the policy network across multiple trials in the Hopper (MuJoCo) and walker-walk (DMC) environments. The asymmetry in parameter changes and the significant detours observed highlight key phenomena discussed in the paper.

This figure shows the results of an empirical investigation on the policy parameter change and detour. It presents Cumulative Distribution Function (CDF) histograms of the accumulated parameter change and the detour ratio for each layer (1, 2, and 3) of the policy network in two different environments (MuJoCo Hopper and DMC walker-walk). The left panels show the CDF of accumulated change, while the right panels illustrate the CDF of the detour ratio. The analysis reveals asymmetries in parameter changes and significant detours during the policy learning process.

This figure presents the cumulative distribution functions (CDFs) of the accumulated parameter change and the detour ratio for each layer (1,2,3) of the policy networks in the Hopper (MuJoCo) and walker-walk (DMC) environments. The left panels show the distribution of the total parameter change during training, highlighting the asymmetry in changes across layers and parameters. The right panels illustrate the distribution of the detour ratio, revealing that many parameters deviate significantly from their initial values during training. These results visually support Phenomena 1.1 and 2.1 in the paper, showing asymmetric parameter changes and substantial detours during policy learning.

This figure shows the results of an empirical investigation on SVD left unitary matrix of policy learning paths in four MuJoCo environments (HalfCheetah-v4, Hopper-v4, Walker2d-v4, and Ant-v4). For each environment, it presents five subfigures: (1) The learning curve, showing the average return over time steps. (2-5) The temporal evolution of the k-th coordinate (u*,k), with each curve illustrating the evolving path of the k-th coordinate, where k represents the index of the singular value. The detour ratio (rpud) and final change (∆PC) of the policy parameters along the learning path are also shown. This figure helps illustrate the phenomena observed in the paper, specifically Phenomenon 2.2 regarding the behavior of policy parameter updates in major and minor SVD directions.

This figure shows the results of a temporal singular value decomposition (SVD) analysis of policy learning paths from the RAD algorithm on the DMC walker-walk environment. Panel (a) shows how the dimensionality of the policy path changes as a function of an information threshold (β), separately for three layers of the network and three different learning periods. Panel (b) presents a detailed analysis of the dominant and less significant singular vectors (u∗,k), showing how parameters evolve along those directions, along with their detour ratios and final changes.

This figure displays the learning curves for both TD3 and TD3-PPTB across four different MuJoCo tasks. The gray lines represent the performance of the TD3 algorithm, while the red lines represent the performance of the TD3 algorithm enhanced with the PPTB method. Error bars indicating standard errors across six different seeds are included for each task. This visualization helps in comparing the performance and stability of both algorithms across various environments.

This figure shows the learning curves for the RAD algorithm and the improved RAD-PPTB algorithm across four different DeepMind Control Suite (DMC) environments. The x-axis represents the number of timesteps, and the y-axis represents the average return. The shaded regions indicate the standard error across six independent runs with different random seeds. The curves show that RAD-PPTB generally outperforms RAD in terms of both final performance and learning speed, indicating the effectiveness of the proposed method.

This figure shows the complete results of an empirical investigation on policy parameter change amount in MuJoCo environments. It includes CDF histograms of the accumulated parameter change and the detour ratio of the parameters for different layers (Layer 1, 2, 3) of the network in six different MuJoCo environments (HalfCheetah-v4, Hopper-v4, Walker2d-v4, Ant-v4, Humanoid-v4). The results reveal the asymmetry in parameter changes across layers and the significant detours present in parameter updates.
More on tables

This table presents the performance evaluation results of the RAD algorithm with and without PPTB in four different DeepMind Control Suite environments. The metrics used are Score (the best average return across multiple runs) and AUC (the mean average return over the learning process). The table shows the improvement in both metrics achieved by using PPTB, indicating its effectiveness in improving the performance of the RAD algorithm. Figure 11 visualizes the learning curves for a better understanding.

This table presents the results of experiments evaluating the performance of the Policy Path Trimming and Boosting (PPTB) method when applied to the DoubleDQN algorithm on three MinAtar environments: SpaceInvaders, Seaquest, and Breakout. The table shows the average scores achieved by the standard DoubleDQN algorithm and the DoubleDQN algorithm enhanced with PPTB, along with standard deviations across six independent runs for each environment. It demonstrates the effectiveness of PPTB in value-based reinforcement learning.

This table presents the results of an experiment evaluating the performance of a temporal singular value decomposition (SVD) reconstruction method applied to RAD policies on the cartpole-wingup task. The experiment varied the number of major dimensions retained during the reconstruction, and the table shows the average return (AVG(AR(θi))), average absolute return difference (AVG(|∆R(θi)|)), maximum return (MAX(AR(θi))), and minimum return (MIN(AR(θi))) for each number of major dimensions. These metrics provide insights into the effectiveness of the reconstruction method and how the number of retained dimensions impacts performance.

This table presents the results of reconstructing RAD policies using Temporal SVD with varying numbers of major dimensions retained. The data is specifically for the second period of the cartpole-wingup task. The table shows the average absolute return (AVG({AR(θi)}i)), the average absolute change in return (AVG({|∆R(θi)|}i)), the maximum absolute return (MAX({AR(θi)}i)), and the minimum absolute return (MIN({AR(θi)}i)) for different numbers of major dimensions.

This table presents the results of an experiment evaluating the performance of a temporal singular value decomposition (SVD) reconstruction method on RAD policies in the finger-spin environment. The experiment varied the number of major dimensions kept during reconstruction (1, 2, 4, 8, 16, 32, 64, 128). For each number of major dimensions, the table shows the average and standard deviation of the average return (AVG({AR(θ)}i)), the average absolute return (AVG({|∆R(θ)|}i)), the maximum average return (MAX({AR(θ)}i)), and the minimum average return (MIN({AR(θ)}i)). This data helps quantify the impact of dimensionality reduction on policy performance. The first period refers to an early stage of the training process.

This table presents the results of a temporal singular value decomposition (SVD) reconstruction experiment on RAD policies in the finger-spin environment during the second learning period. It shows the average absolute return (AVG({AR(θi)}i)), average absolute return change (AVG({|∆R(θi)|}i)), maximum absolute return (MAX({AR(θi)}i)), and minimum absolute return (MIN({AR(θi)}i)) obtained by reconstructing the policies using different numbers of major dimensions (from 1 to 128). The results are used to study the effects of dimensionality reduction on policy reconstruction in the context of deep reinforcement learning (DRL).

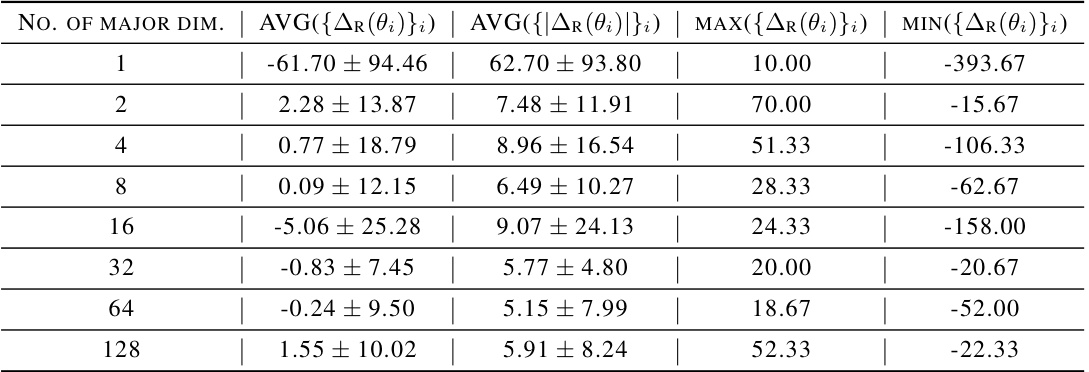
This table presents the results of a temporal singular value decomposition (SVD) reconstruction experiment on RAD policies in the walker-walk environment. The experiment varied the number of major dimensions kept during reconstruction (from 1 to 128). For each number of major dimensions, the table shows the average and standard deviation of the absolute return (AVG({AR(θi)}i)), average and standard deviation of the absolute change in return (AVG({|∆R(θi)|}i)), maximum return (MAX({AR(θi)}i)), and minimum return (MIN({AR(θi)}i)). This data helps to evaluate the effectiveness of reducing the dimensionality of the policy learning path using temporal SVD.

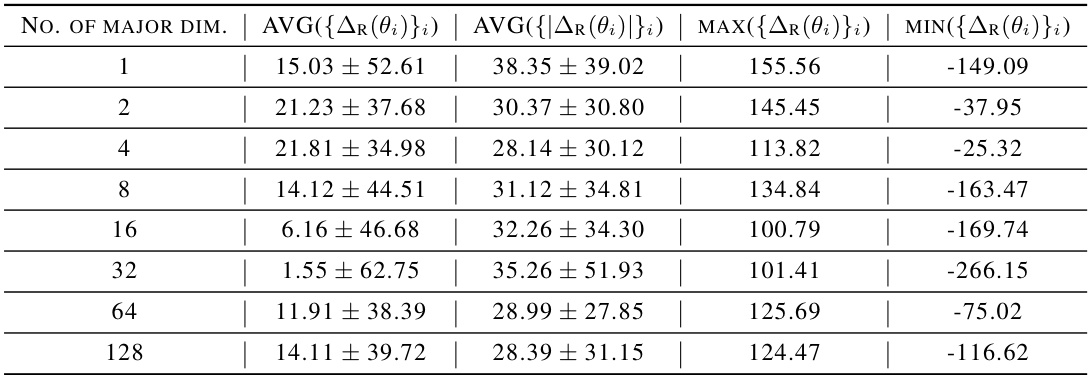
This table presents the results of a temporal singular value decomposition (SVD) reconstruction of RAD policies on the walker-walk task in the DeepMind Control Suite (DMC). The reconstruction is performed using different numbers of major dimensions (1, 2, 4, 8, 16, 32, 64, 128) to assess the impact on reconstruction accuracy. The average absolute return (AVG({AR(θi)}i)), average absolute return difference (AVG({|∆R(θ)|}i)), maximum absolute return (MAX({∆R(θ)}i)), and minimum absolute return (MIN({∆R(θ)}i)) are reported for each number of major dimensions. This analysis helps evaluate the method’s effectiveness in capturing the essential aspects of the policy path during learning. The data shown is for the second period of the learning process.
Full paper#


