↗ OpenReview ↗ NeurIPS Homepage ↗ Chat
TL;DR#
The gold standard for evaluating machine learning models is typically cross-validation (CV). However, this paper investigates whether this wide-spread assumption is always valid. The research highlights that CV’s computational cost can be substantial, especially for large datasets, and its statistical benefits are not always clear, particularly when dealing with complex nonparametric models and slow convergence rates. The authors also observe that the statistical benefits of CV remain less understood in nonparametric regimes.
This paper proposes to systematically analyze the plug-in approach where one reuses training data for testing evaluation compared with the CV methods. It leverages higher-order Taylor analysis to dissect the limit theorems of testing evaluations. The research demonstrates that for several model classes and evaluation criteria, the plug-in approach performs just as well as CV. The findings suggest that the plug-in method can be a valuable, less computationally expensive alternative to CV for various model classes, potentially improving efficiency and resource allocation in machine learning projects.
Key Takeaways#
Why does it matter?#
This paper challenges the conventional wisdom in machine learning by questioning the supremacy of cross-validation. It offers new theoretical insights and empirical evidence, demonstrating that simpler methods can be just as effective, especially in complex scenarios. This has significant implications for computational efficiency and resource allocation in machine learning projects.
Visual Insights#

The figure shows the evaluation bias and coverage probabilities of interval estimates for different cross-validation methods (2-fold, 5-fold, LOOCV) and the plug-in approach. The bar chart displays the bias, showing how much the estimated performance deviates from the true performance. The lines show the coverage probability, indicating how often the true performance falls within the calculated confidence intervals. The results are based on 500 experimental replications of a random forest regressor trained on different sample sizes (n).

This table summarizes the asymptotic bias and coverage validity of three methods (plug-in, k-fold CV, LOOCV) for estimating out-of-sample model performance. It shows the bias (how much the estimate differs from the true value) and the coverage validity (whether the confidence interval correctly contains the true value) for general models and specific models (Linear ERM, kNN, Random Forest). The results are categorized based on the model’s convergence rate (γ), distinguishing between fast and slow convergence scenarios. A checkmark indicates valid asymptotic coverage, while an ‘X’ indicates invalid coverage. The big O notation describes the rate at which the bias approaches zero as the sample size increases.
In-depth insights#
CV’s Statistical Limits#
The heading “CV’s Statistical Limits” prompts a discussion on the limitations of cross-validation (CV) in reliably estimating out-of-sample model performance. A core issue is the inherent bias in CV, particularly k-fold CV, which arises from the partitioning of data into training and validation sets. This bias is often underestimated, especially in nonparametric models with slow convergence rates. Leave-one-out CV (LOOCV), while less biased, suffers from high computational cost. The analysis reveals that the apparent advantage of LOOCV over simpler ‘plug-in’ approaches (reusing training data for testing) might be negligible in many practical scenarios, given the variability inherent in performance evaluations. The study emphasizes the need for a more nuanced understanding of CV’s statistical properties, particularly concerning bias and coverage, and stresses the limitations of relying solely on CV as a gold standard for model evaluation. Higher-order Taylor expansions and novel stability conditions are crucial tools for dissecting these issues. The analysis ultimately suggests a careful consideration of the model’s convergence rate and evaluation variability when choosing between CV and the computationally more efficient plug-in method.
Plug-in’s Surprise#
The heading “Plug-in’s Surprise” aptly captures a core finding: the surprisingly strong performance of the simple plug-in method for estimating out-of-sample model performance. Contrary to the widespread belief in the superiority of cross-validation (CV), this research demonstrates that, for a broad range of models (parametric and non-parametric), plug-in often performs comparably or even better than CV in terms of bias and coverage accuracy. This is particularly unexpected in non-parametric settings, where slow model convergence rates were anticipated to severely disadvantage plug-in. The surprise stems from the nuanced interaction of model convergence rates, bias, and variability in evaluation, an aspect thoroughly investigated in the paper. The higher-order Taylor analysis employed provides a novel theoretical framework that clarifies this behavior, moving beyond previous sufficient conditions to reveal necessary conditions for plug-in’s success. Plug-in’s simplicity and computational efficiency offer significant advantages over CV, especially when dealing with complex models requiring multiple retraining steps. The results challenge long-held assumptions about CV’s dominance and offer valuable practical guidance for choosing estimation methods.
Higher-Order Taylor#
The application of a higher-order Taylor expansion in a research paper is a significant methodological choice, especially when dealing with complex functions or models. A standard first-order Taylor expansion linearizes the function around a point, which is suitable for approximating the function locally. However, a higher-order expansion captures more of the function’s curvature and behavior, leading to a more accurate approximation, especially when the function is non-linear or the point of approximation is far from the true value. This increased accuracy comes at the cost of added computational complexity. The choice of higher-order is justified if the accuracy gains outweigh the added computational burden. The paper likely uses the higher-order Taylor expansion to precisely analyze the error in estimating out-of-sample performance of models, accounting for subtle interdependencies that a simpler linear approximation might miss. This rigorous approach is crucial when evaluating model generalization ability in complex scenarios, as the study is concerned with the subtle inter-dependence of model convergence and other characteristics, and seeks to improve the accuracy of out-of-sample evaluation.
Beyond Parametric#
The heading ‘Beyond Parametric’ suggests an exploration of statistical methods that move beyond the limitations of traditional parametric models. Parametric models assume data follows a specific probability distribution characterized by a fixed set of parameters. However, real-world data is often complex and doesn’t adhere to these assumptions. The ‘Beyond Parametric’ section likely delves into techniques that relax or eliminate these distributional assumptions, offering greater flexibility and robustness. This could involve discussions of nonparametric methods such as kernel density estimation, nearest-neighbor approaches, or machine learning algorithms that learn complex relationships from data without explicit distributional constraints. The advantages of such methods include better handling of outliers, skewed data, and multimodal distributions, providing more accurate models for diverse datasets. Limitations of nonparametric techniques, such as increased computational cost or sensitivity to dimensionality, might also be addressed. Ultimately, this section aims to highlight the strengths and weaknesses of moving beyond the confines of parametric modeling, showcasing the power and challenges of more flexible approaches to statistical analysis.
Future Directions#
Future research could explore high-dimensional settings where both dimensionality and sample size grow, investigating whether the observed trends in bias and coverage extend to such scenarios. Relaxing smoothness and stability assumptions would broaden the applicability of the theoretical framework, potentially revealing how various model classes behave under less stringent conditions. Analyzing model selection, where the goal is to rank models rather than estimate absolute performance, presents another avenue for future work. Investigating the performance of alternative methods like approximate leave-one-out and bias-corrected techniques, particularly in the context of high-dimensional data or computationally expensive models, is crucial. Finally, developing a deeper understanding of nonasymptotic behavior and deriving finite-sample guarantees for the interval estimates is highly desirable for practical implementation.
More visual insights#
More on tables

This table summarizes the theoretical findings of the paper regarding the asymptotic bias and coverage validity of three different model evaluation methods (plug-in, K-fold CV, and LOOCV) across various model specifications (parametric and nonparametric) and convergence rates. It provides a concise overview of the performance of each method under different scenarios, indicating whether the resulting interval estimates provide valid coverage guarantees (✓) or not (X) for the true out-of-sample performance. The asymptotic bias is also shown in terms of the order of convergence. This information is crucial for practitioners to choose the appropriate model evaluation method based on the model and context.

This table summarizes the theoretical findings of the paper regarding the asymptotic bias and coverage validity of three different methods (plug-in, K-fold CV, and LOOCV) for estimating out-of-sample model performance. It shows under what conditions each method provides valid coverage and the asymptotic bias of each method for both parametric and nonparametric models, categorized by convergence rate (γ). The table also shows specific examples demonstrating the theoretical results.

This table summarizes the asymptotic bias and coverage validity of three model evaluation methods (plug-in, K-fold CV, and LOOCV) across different model types (specific parametric, general parametric, and nonparametric). It shows whether the methods produce valid coverage intervals (✓) or not (X) for the out-of-sample model performance, considering both fast and slow model convergence rates. The bias values are expressed using Big O notation to illustrate their asymptotic behavior relative to the sample size.

This table summarizes the asymptotic bias and coverage validity of three model evaluation methods (plug-in, K-fold CV, LOOCV) across different model types (specific parametric models, general parametric models, and nonparametric models). The bias and coverage are assessed based on the convergence rate of the model (γ). The table shows conditions under which each method provides valid (✓) or invalid (X) coverage of the out-of-sample model performance.

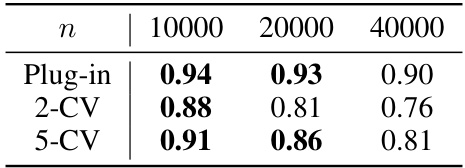
This table presents the coverage probabilities for the mean-squared error of a k-Nearest Neighbors model on the puma32H dataset, using different sample sizes and evaluation methods. The methods include plug-in, 2-fold cross-validation, and 5-fold cross-validation. A valid coverage is considered to be within the range [0.85, 0.95]. The results show that plug-in provides valid coverage across all sample sizes, while cross-validation methods perform less well, especially at larger sample sizes.

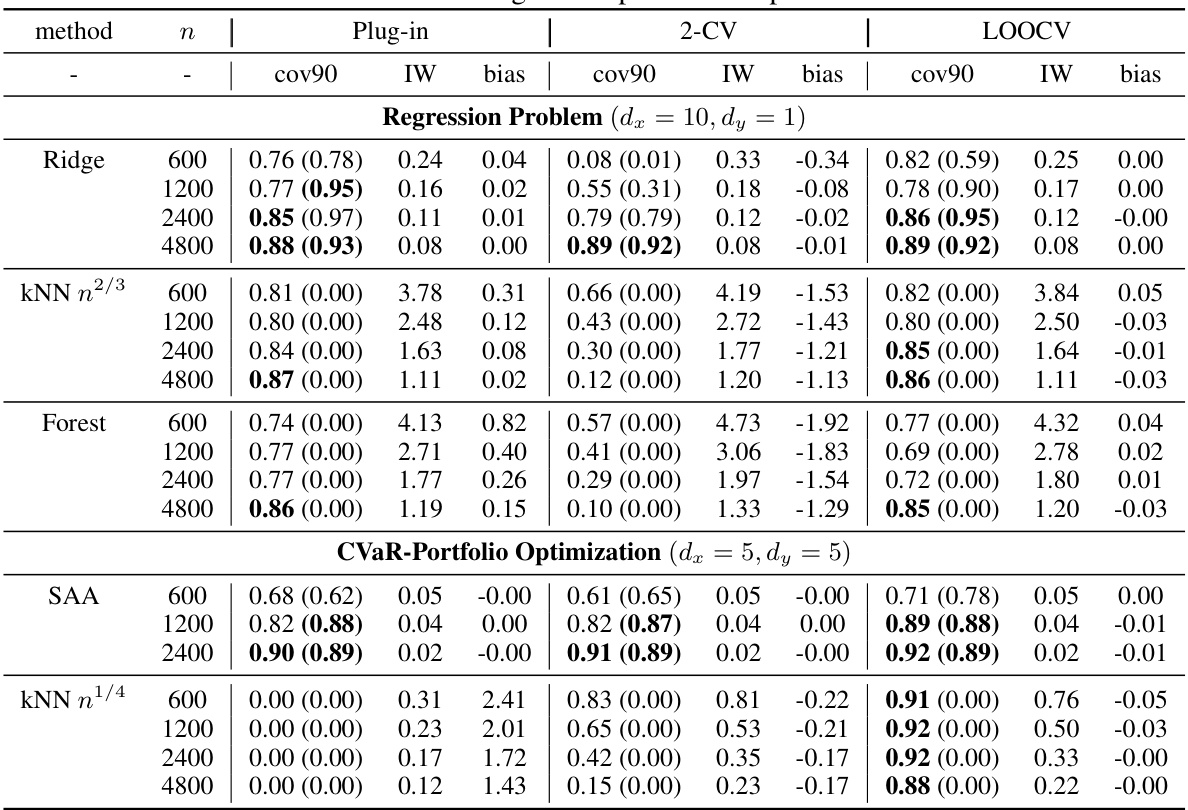
This table summarizes the asymptotic bias and coverage probability for three methods (plug-in, 5-fold CV, LOOCV) across various model settings. It shows the bias and interval width for each method, indicating the accuracy of the out-of-sample performance estimation. Bold values highlight when the 90% confidence interval successfully covers the true out-of-sample performance. The table also notes that additional results with different sample sizes and standard errors are provided in supplementary tables.

This table presents the results of evaluating the performance of plug-in, 5-fold cross-validation, and leave-one-out cross-validation for different models and sample sizes. The metrics reported are coverage probability (at 90% nominal level), interval width, and bias. The results show how the bias and coverage vary depending on the model and the sample size, supporting the paper’s claims on when plug-in is a good alternative to cross-validation. Additional details and standard errors are provided in supplementary tables.
Full paper#


