↗ OpenReview ↗ NeurIPS Homepage ↗ Chat
TL;DR#
Reinforcement learning algorithms heavily depend on hyperparameter tuning, yet existing methods for evaluating algorithms often neglect the impact of hyperparameter sensitivity. This lack of understanding poses a significant challenge, as algorithms that perform well in specific environments may not generalize across diverse settings due to a critical reliance on per-environment hyperparameter tuning. This makes it challenging to design robust algorithms and limits reproducibility.
This paper introduces a novel empirical methodology for studying, comparing, and quantifying hyperparameter sensitivity. It proposes two key metrics: hyperparameter sensitivity (measuring reliance on per-environment tuning) and effective hyperparameter dimensionality (number of hyperparameters needing tuning for near-peak performance). The methodology is applied to various PPO normalization variants, revealing that performance improvements often come with increased sensitivity. The paper’s findings emphasize the importance of considering hyperparameter sensitivity during algorithm development and evaluation, paving the way for more robust and efficient reinforcement learning systems.
Key Takeaways#
Why does it matter?#
This paper is crucial because hyperparameter tuning is a major challenge in reinforcement learning, significantly impacting performance and reproducibility. The proposed methodology offers a novel way to quantify and analyze hyperparameter sensitivity, leading to more efficient algorithms and improved model reliability. It bridges the gap between performance-only evaluation and the need for understanding algorithm behaviour with respect to hyperparameters, opening avenues for the development of robust and efficient reinforcement learning agents. This research is timely and highly relevant given the increased complexity of modern reinforcement learning algorithms.
Visual Insights#

This figure shows the number of hyperparameters used in several reinforcement learning algorithms over time. It demonstrates the significant increase in the number of hyperparameters from early algorithms like DQN to more recent ones like DreamerV3. The figure highlights the increasing complexity of modern reinforcement learning algorithms and the growing challenge of hyperparameter tuning.

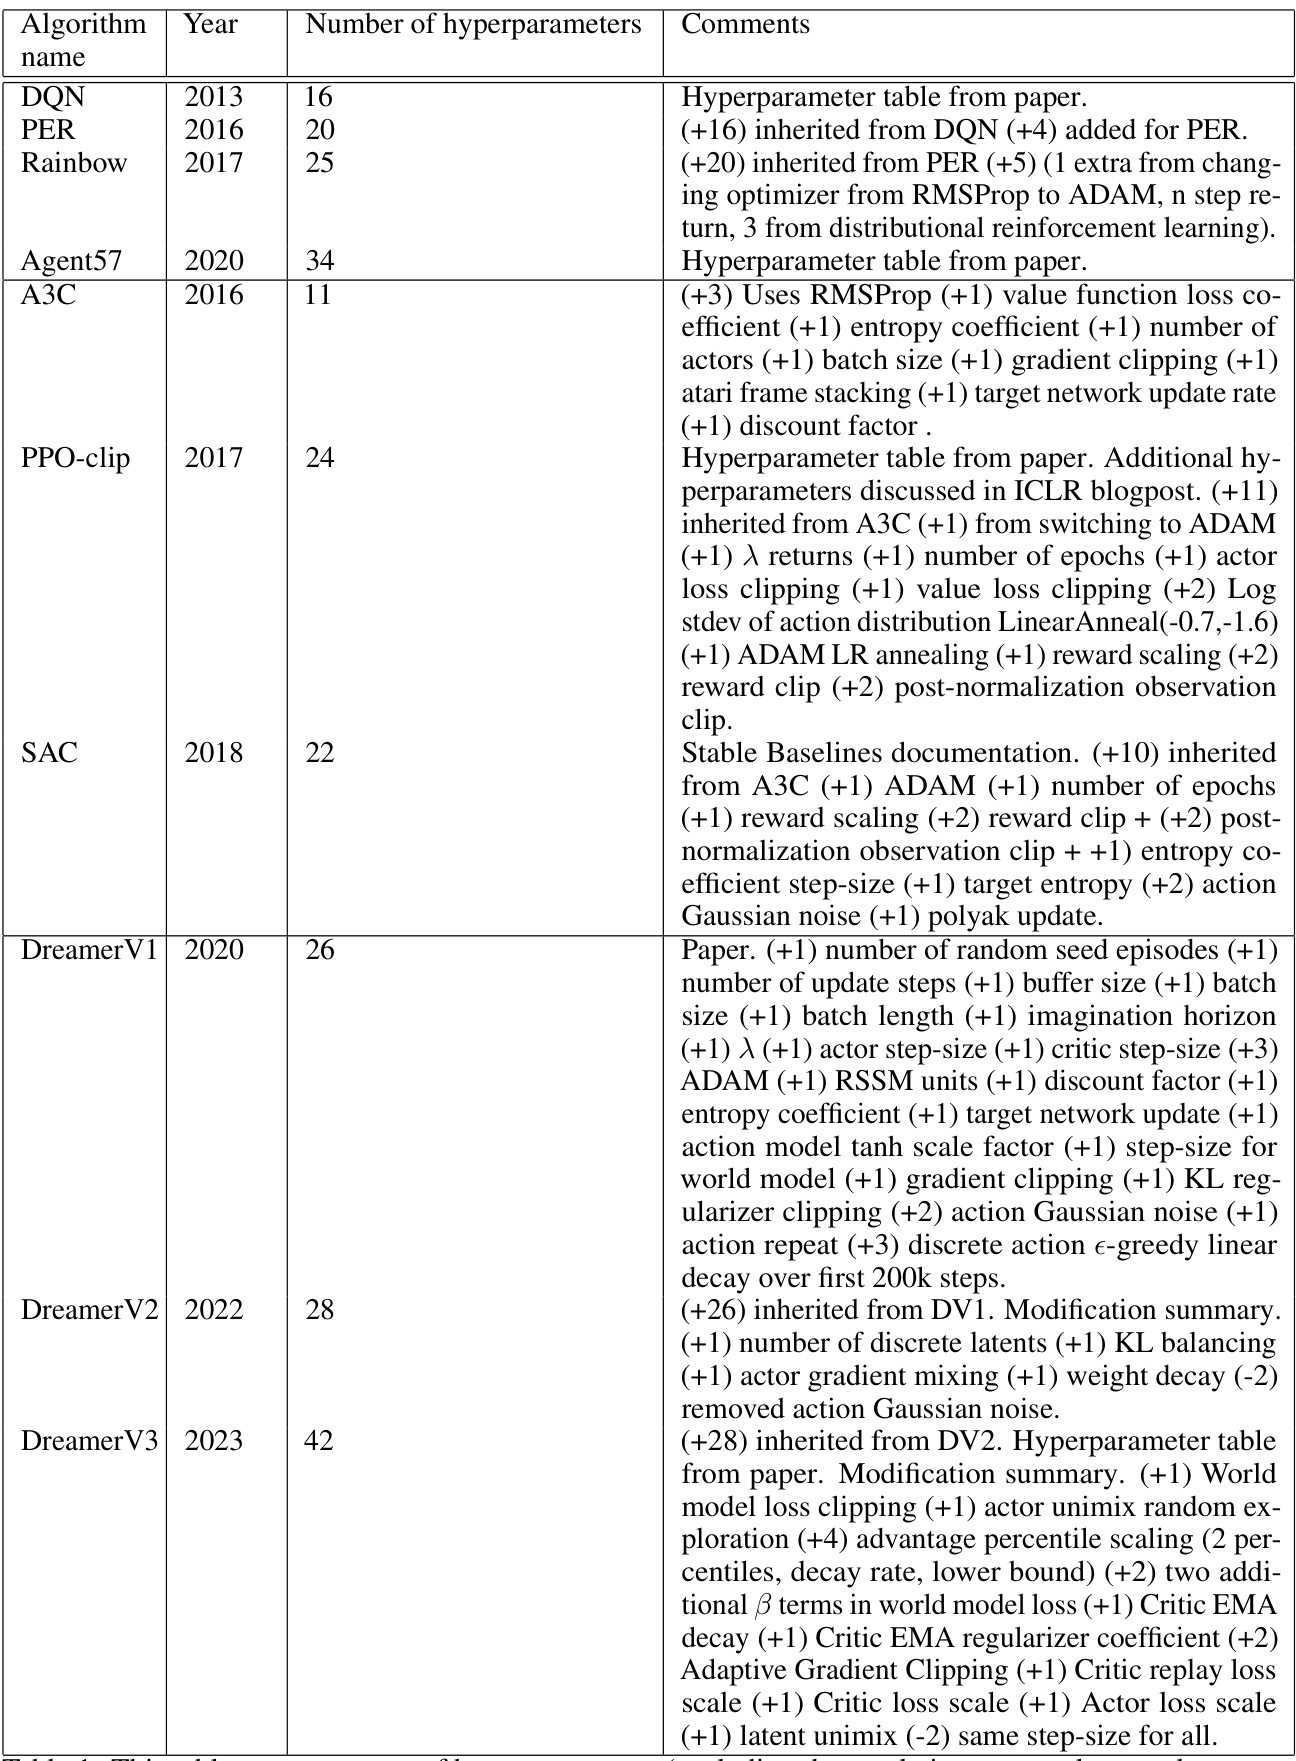
This table presents the number of hyperparameters for various reinforcement learning algorithms proposed over the last decade. It categorizes algorithms by type (value-based, policy-gradient, model-based), indicating the year of proposal and the count of hyperparameters. The ‘Comments’ column provides further details on the hyperparameter counts, referencing sources such as original papers or popular implementations.
In-depth insights#
Hyperparameter Sensitivity#
The concept of ‘Hyperparameter Sensitivity’ in the context of reinforcement learning is explored in depth, revealing how crucial it is to understand an algorithm’s performance dependency on its hyperparameters. The authors highlight the significant performance variations resulting from seemingly small changes in hyperparameter settings, particularly across different environments. This sensitivity poses a challenge, as a hyperparameter configuration optimized for one environment might perform poorly in another. Scalability issues arising from a large hyperparameter space are also addressed, emphasizing the need for efficient and widely applicable methodologies to study hyperparameter sensitivity. The paper’s innovative methodology focuses on quantifying this sensitivity, enabling researchers to better understand the relative importance of hyperparameter tuning in achieving state-of-the-art results. This approach helps separate true algorithmic improvements from those primarily stemming from enhanced hyperparameter tuning, offering a more nuanced evaluation of reinforcement learning algorithms.
PPO Variant Analysis#
Analyzing Proximal Policy Optimization (PPO) variants reveals crucial insights into the algorithm’s behavior. Normalization techniques, such as observation, value function, and advantage normalization, significantly impact performance. While some normalizations improve performance, they often increase hyperparameter sensitivity, demanding more meticulous tuning per environment. This trade-off highlights the need for careful consideration when selecting normalization strategies. The study’s findings challenge the conventional assumption that normalization simplifies hyperparameter tuning. Certain variants, like advantage per-minibatch zero-mean normalization, provide performance gains while maintaining relative insensitivity, demonstrating a balance between improved performance and ease of tuning. Conversely, others lead to considerable sensitivity increases, emphasizing the complexity of PPO variant selection and the importance of using comprehensive evaluation metrics beyond performance alone. The performance-sensitivity plane offers a valuable visualization tool to analyze the interplay between performance and sensitivity, enabling a more nuanced understanding of PPO variant selection.
Sensitivity Metrics#
The concept of ‘Sensitivity Metrics’ in a reinforcement learning research paper would likely involve quantifying how an algorithm’s performance changes in response to variations in its hyperparameters. A key aspect would be defining a suitable metric. Simple metrics such as the difference between best and worst performance across a range of hyperparameter values might be insufficient. More sophisticated approaches might involve analyzing the shape of the performance curve (e.g., U-shaped or monotonic) to reveal the algorithm’s robustness. Statistical measures, such as the variance or standard deviation of the performance across various hyperparameter settings, would offer valuable insights into the sensitivity. Furthermore, a crucial consideration would be whether the sensitivity is evaluated in a specific environment or across multiple environments. The latter would be important to determine an algorithm’s generalizability. Finally, visualizations, such as heatmaps or contour plots, can be highly valuable in conveying the relationships between performance and hyperparameters, making it easier to spot critical sensitivities and potential areas for optimization.
Empirical Methodology#
The paper introduces a novel empirical methodology for evaluating hyperparameter sensitivity in reinforcement learning. It addresses the critical issue of how algorithm performance relies on environment-specific hyperparameter tuning. The methodology proposes two key metrics: hyperparameter sensitivity, which quantifies the extent to which peak performance depends on per-environment tuning, and effective hyperparameter dimensionality, which measures the number of hyperparameters needing adjustment for near-optimal results. This approach moves beyond simple performance comparisons, offering a more nuanced understanding of algorithm behavior. The effectiveness is demonstrated through experiments on PPO variants, revealing the trade-off between performance gains and increased sensitivity. This methodology provides valuable tools for researchers and practitioners to develop more robust and less sensitive reinforcement learning algorithms.
Future Work#
The paper’s ‘Future Work’ section suggests several promising research directions. Expanding the methodology to a broader range of algorithms and environments is crucial for validating its generalizability and establishing its usefulness as a standard evaluation tool. Investigating the interplay between hyperparameter sensitivity and the choice of hyperparameter optimization methods is key. The authors acknowledge that the sensitivity metric is strongly tied to the environment distribution, indicating a need for further research into robust sensitivity metrics. Exploring the relationship between sensitivity and algorithm design choices (like normalization techniques) could potentially lead to new, less sensitive algorithms. Finally, a deeper dive into the interplay between hyperparameter sensitivity and AutoRL methods, comparing both methodologies’ sensitivities and dimensionalities, holds the potential for significant advancements in RL algorithm design and evaluation. The proposed research is well-defined, providing direction for future work and contributing significantly to the advancement of reinforcement learning.
More visual insights#
More on figures

This figure shows the distribution of performance (AUC) for 625 hyperparameter settings in two environments, Swimmer and Halfcheetah, before and after normalization. The left panel shows the raw AUC distributions which differ significantly in scale and range. The right panel shows the distributions after a percentile-based normalization, making them comparable across environments.

This figure shows the distributions of environment-normalized scores for 625 different hyperparameter settings of the PPO algorithm across two environments: Swimmer and Halfcheetah. It highlights the variability in performance across environments, even with the same algorithm and similar hyperparameter settings. The red stars represent a setting that performs exceptionally well in Halfcheetah but poorly in Swimmer, illustrating the challenge of finding universally good hyperparameter settings. In contrast, the blue stars represent a setting that achieves good performance in both environments, indicating a more robust configuration.

This figure shows a two-dimensional plane used for evaluating reinforcement learning algorithms. The x-axis represents the hyperparameter sensitivity, indicating how much an algorithm’s performance relies on per-environment hyperparameter tuning. The y-axis represents the per-environment tuned score, showing the average normalized performance when hyperparameters are tuned for each environment. The plane is divided into five regions, each representing a different combination of performance and sensitivity. Algorithms in the top-left quadrant (Region 1) are ideal, showing high performance and low sensitivity. Regions 2, 3, and 4 represent trade-offs between performance and sensitivity, while Region 5 shows low performance and high sensitivity, indicating less desirable algorithms.

This figure shows the performance-sensitivity plane, a visualization tool to analyze the relationship between an algorithm’s performance and its sensitivity to hyperparameter tuning across different environments. The x-axis represents hyperparameter sensitivity, while the y-axis shows the per-environment tuned performance. Each point on the plot represents a variant of the PPO algorithm, with error bars indicating 95% confidence intervals. This visualization helps to understand how different normalization variants affect both the performance and sensitivity of PPO.

This figure shows the relationship between the number of hyperparameters tuned and the normalized performance scores for different variants of the PPO algorithm. Each subplot represents a different PPO variant, and shows how performance improves as more hyperparameters are tuned. The dashed line in each subplot indicates the point where tuning the hyperparameters yields 95% of peak performance. This helps to quantify the effective hyperparameter dimensionality, showing how many hyperparameters really need tuning to achieve most of the performance gain.

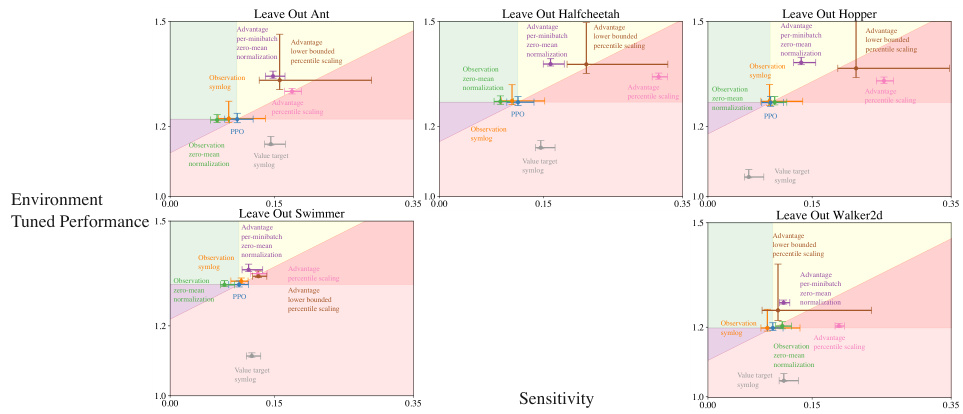
This figure shows five performance-sensitivity plots. Each plot is generated by removing one of the five environments (Ant, Halfcheetah, Hopper, Swimmer, Walker2d) from the original dataset used to create the main performance-sensitivity plot (Figure 5 in the paper). The x-axis represents the hyperparameter sensitivity, and the y-axis represents the per-environment tuned performance. Each point in the plots represents a specific variant of the PPO algorithm, with error bars indicating the 95% confidence intervals. By comparing these plots to the main performance-sensitivity plot, one can analyze how the removal of a specific environment affects the overall sensitivity and performance of the different PPO variants. This analysis helps to understand the robustness of the algorithms across different environments and how much reliance they have on hyperparameter tuning in each environment.

This figure shows the performance-sensitivity plane for different variants of the Proximal Policy Optimization (PPO) algorithm. The x-axis represents the hyperparameter sensitivity, measuring how much an algorithm’s performance relies on per-environment hyperparameter tuning. The y-axis represents the per-environment tuned performance. Each point represents a PPO variant, and the error bars indicate 95% confidence intervals based on 10,000 bootstrap samples. The plot helps visualize the trade-off between performance and sensitivity for various normalization techniques used in PPO.
More on tables

This table shows, for each algorithm variant, the subsets of hyperparameters that, when tuned, resulted in the most significant performance improvement. The table is organized by the size of the subset (1, 2, or 3 hyperparameters). For example, for the PPO algorithm, tuning only the λ hyperparameter (Size 1) provided the most benefit. In contrast, for the Advantage percentile scaling variant, tuning the αw hyperparameter alone (Size 1) was most impactful, but adding λ and αθ yielded further improvements (Size 3). This highlights the differing relative importance of hyperparameters across various algorithm implementations.

This table presents the mean and standard deviation of returns for various PPO algorithm variants across different environments and hyperparameter settings. The results show the average performance achieved by each algorithm variant under different conditions, providing insights into their relative effectiveness and sensitivity to hyperparameter tuning across various environments.
Full paper#


