TL;DR#
Current methods for 3D object detection in point clouds, especially those using transformers, face challenges in efficiently modeling long-range relationships and handling the sparsity of point cloud data. These limitations often lead to high computational costs and reduced accuracy, particularly when dealing with large-scale datasets. Existing approaches often resort to small group sizes for feature interaction due to the quadratic complexity of self-attention mechanisms, limiting their ability to capture global context effectively.
The paper introduces LION, a window-based framework that leverages linear group recurrent neural networks (RNNs) to address these challenges. LION allows for much larger group sizes for feature interaction, significantly reducing computational complexity compared to transformer-based methods while preserving accuracy. The key innovation lies in incorporating a 3D spatial feature descriptor to improve spatial modeling and a 3D voxel generation strategy to enhance the representation of foreground features in sparse point clouds. Experimental results demonstrate that LION achieves state-of-the-art performance on multiple benchmark datasets.
Key Takeaways#
Why does it matter?#
This paper is crucial for researchers in 3D object detection because it introduces LION, a novel and efficient framework that achieves state-of-the-art results by using linear group RNNs. This work addresses the limitations of transformer-based methods in handling long-range relationships and sparse point clouds, opening new avenues for research in computationally efficient and accurate 3D perception.
Visual Insights#
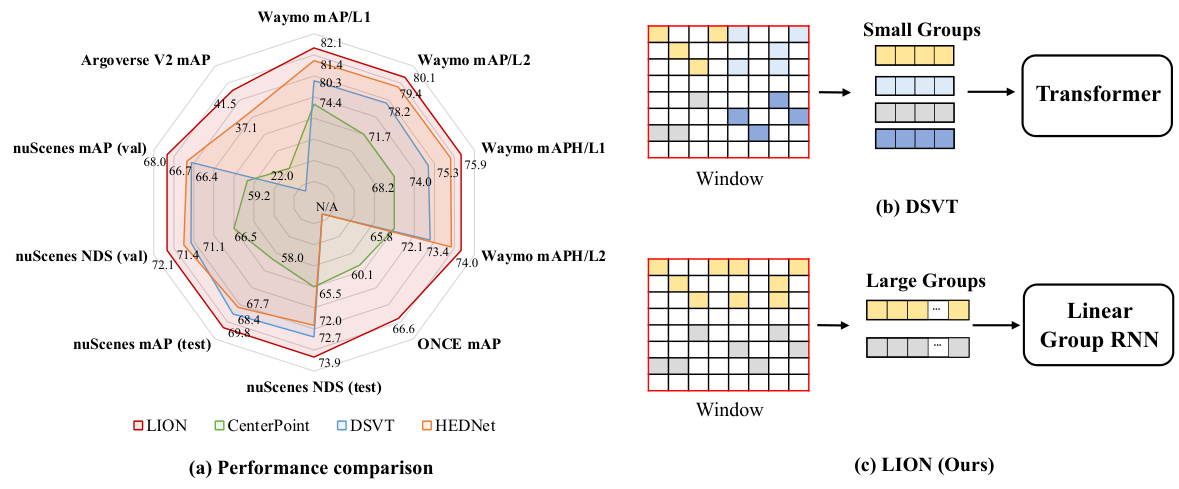
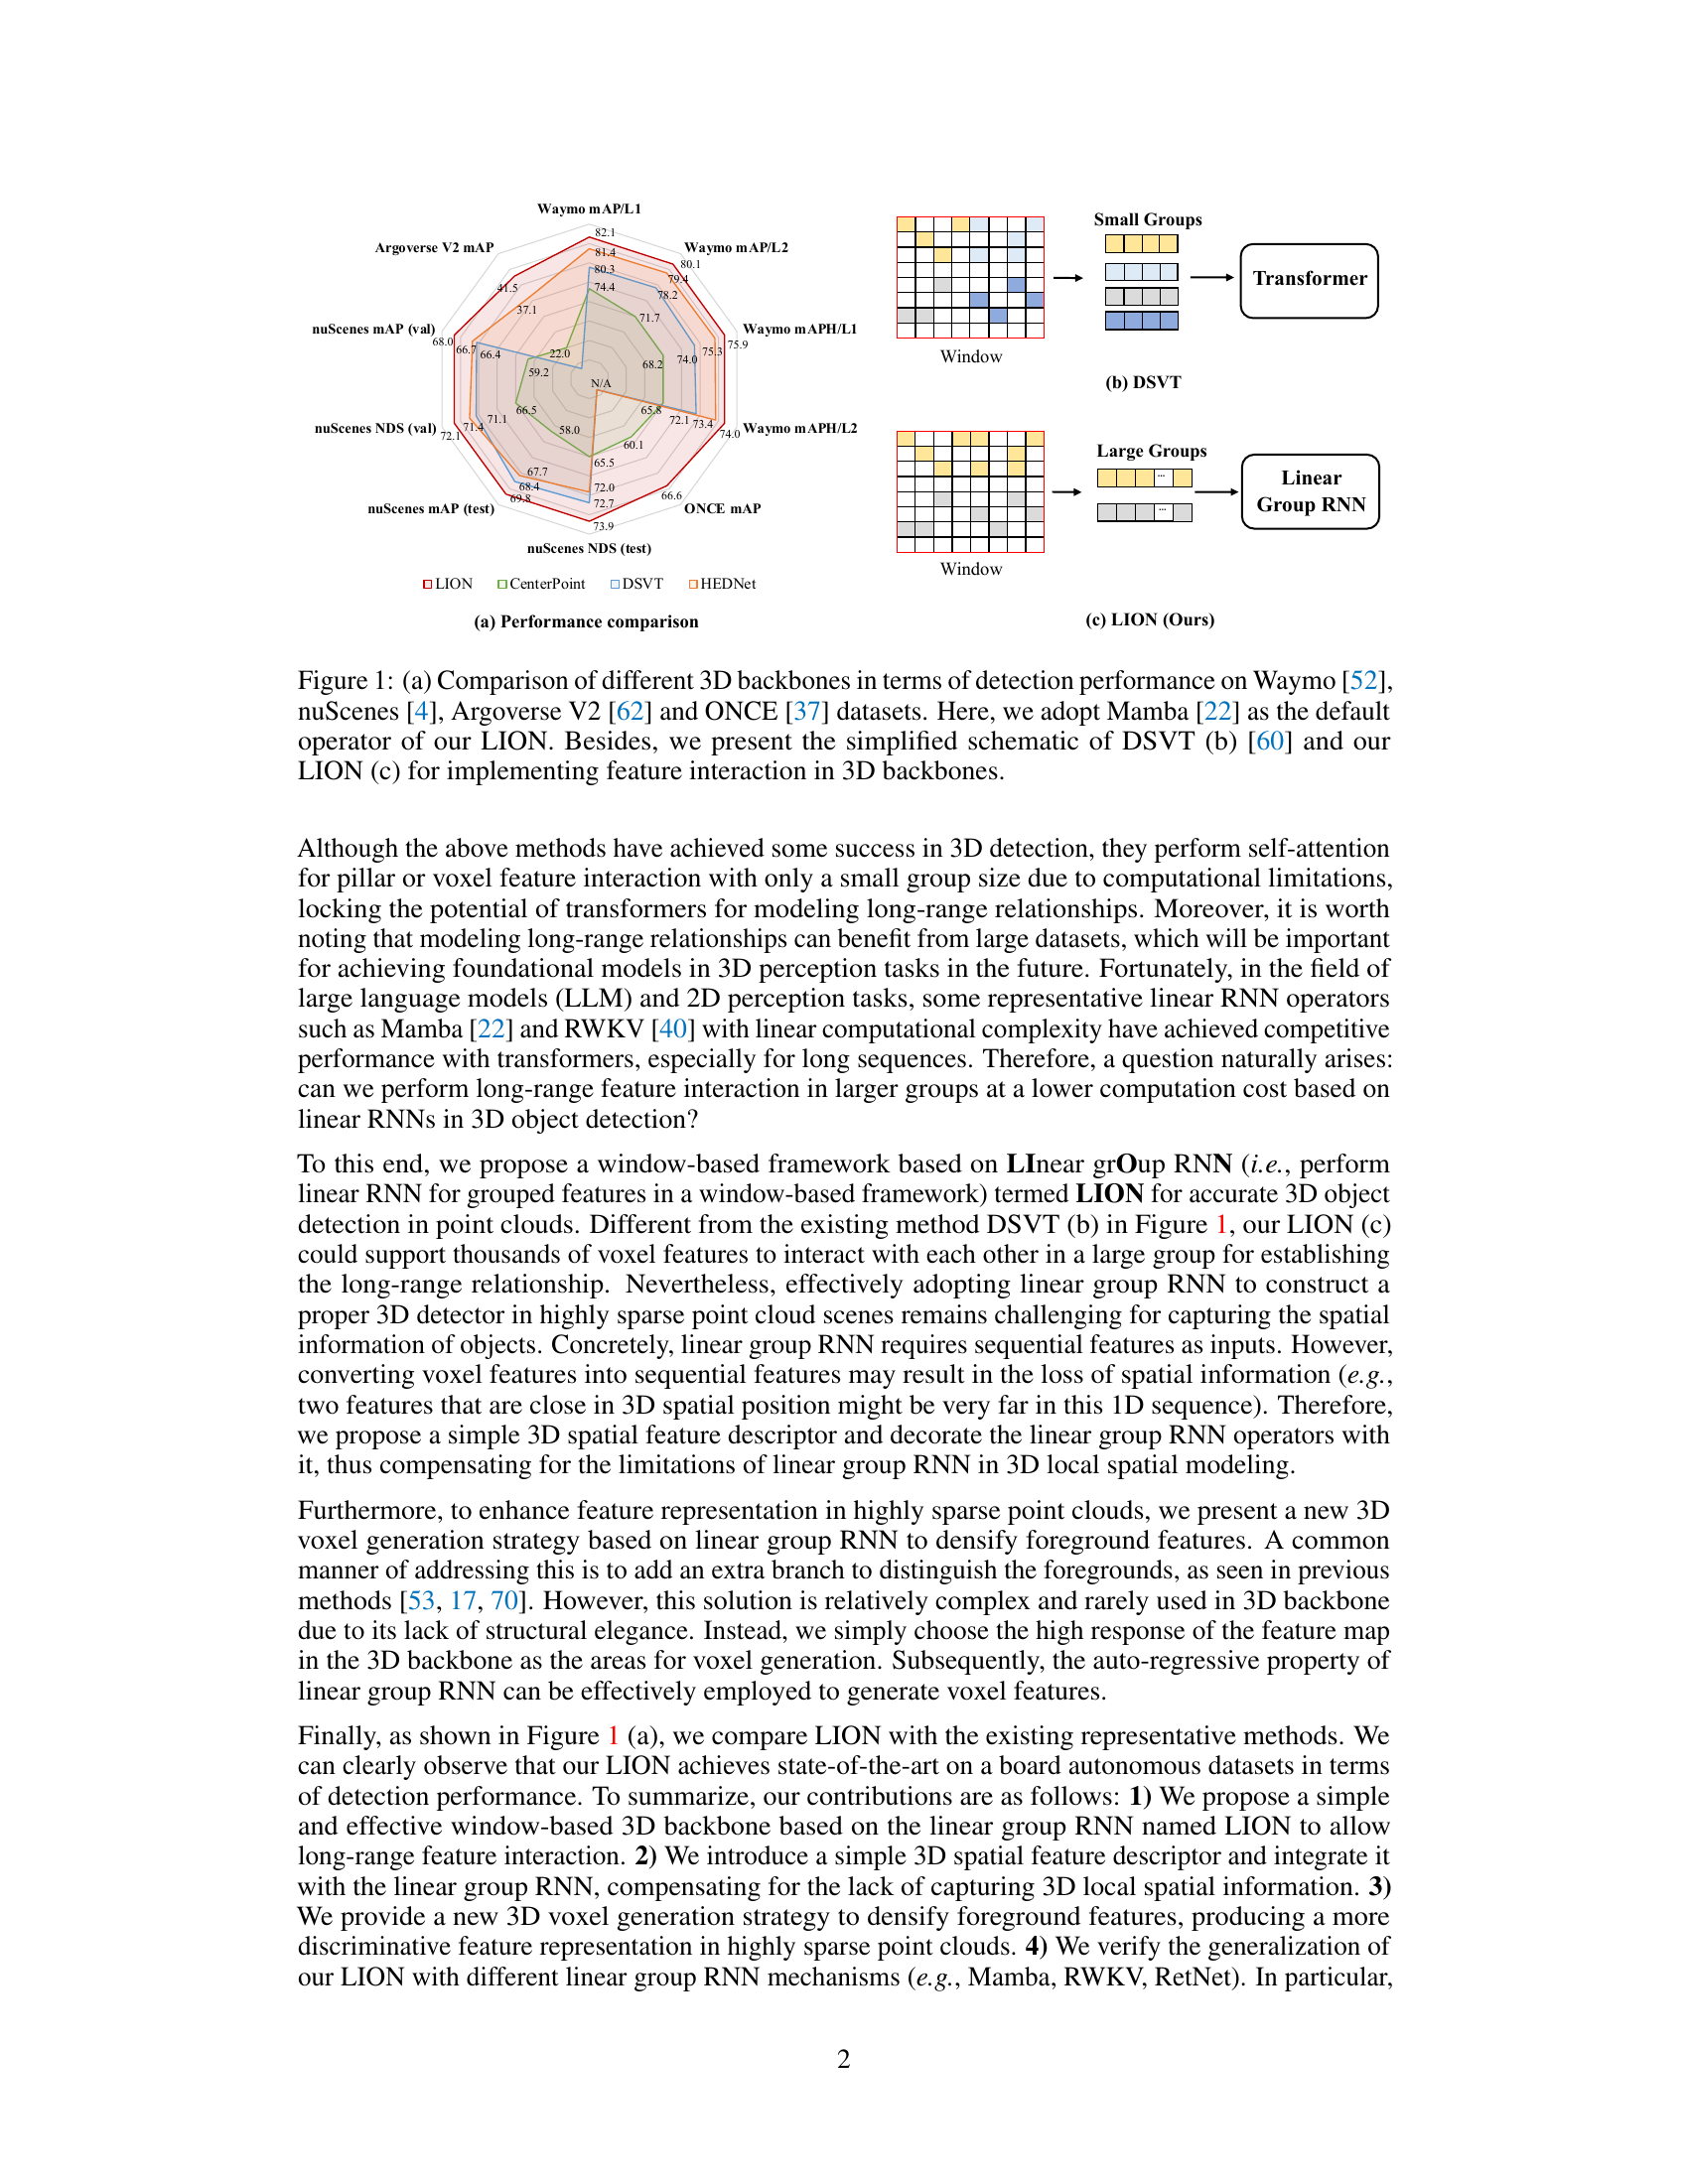
🔼 This figure compares the performance of different 3D object detection backbones on four benchmark datasets (Waymo, nuScenes, Argoverse V2, and ONCE). It shows that the proposed LION method (using the Mamba linear group RNN operator) outperforms existing methods like CenterPoint and DSVT. Subfigures (b) and (c) illustrate the key difference between the DSVT (using transformers with small feature groups) and LION (using linear group RNNs with larger feature groups) approaches for feature interaction.
read the caption
Figure 1: (a) Comparison of different 3D backbones in terms of detection performance on Waymo [52], nuScenes [4], Argoverse V2 [60] and ONCE [37] datasets. Here, we adopt Mamba [22] as the default operator of our LION. Besides, we present the simplified schematic of DSVT (b) [60] and our LION (c) for implementing feature interaction in 3D backbones.
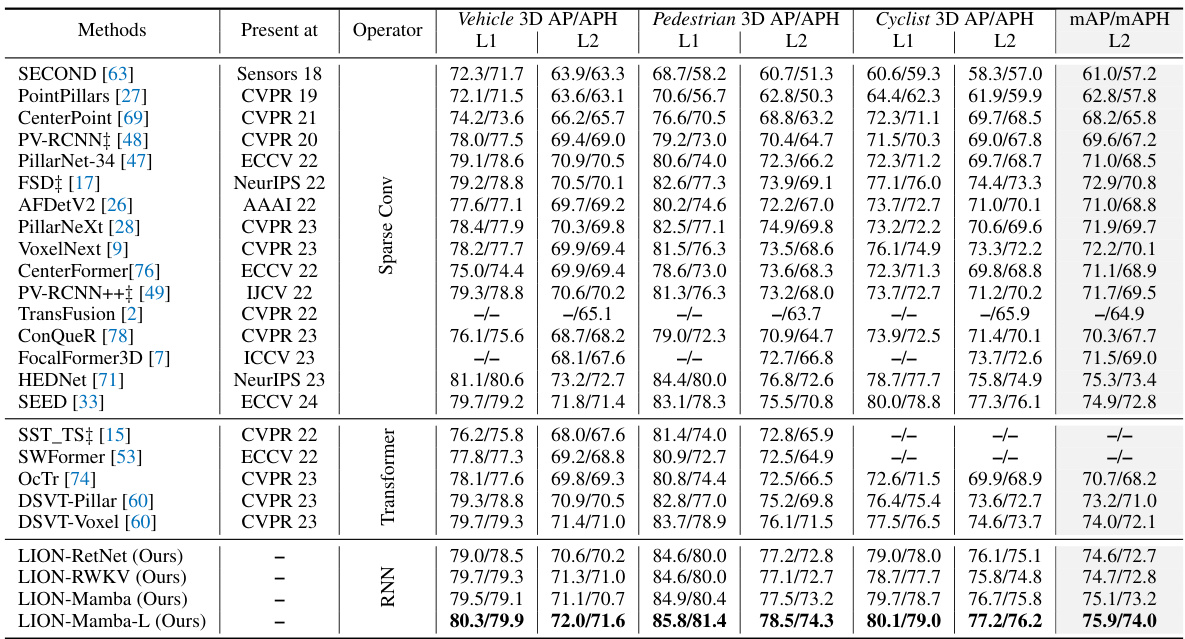
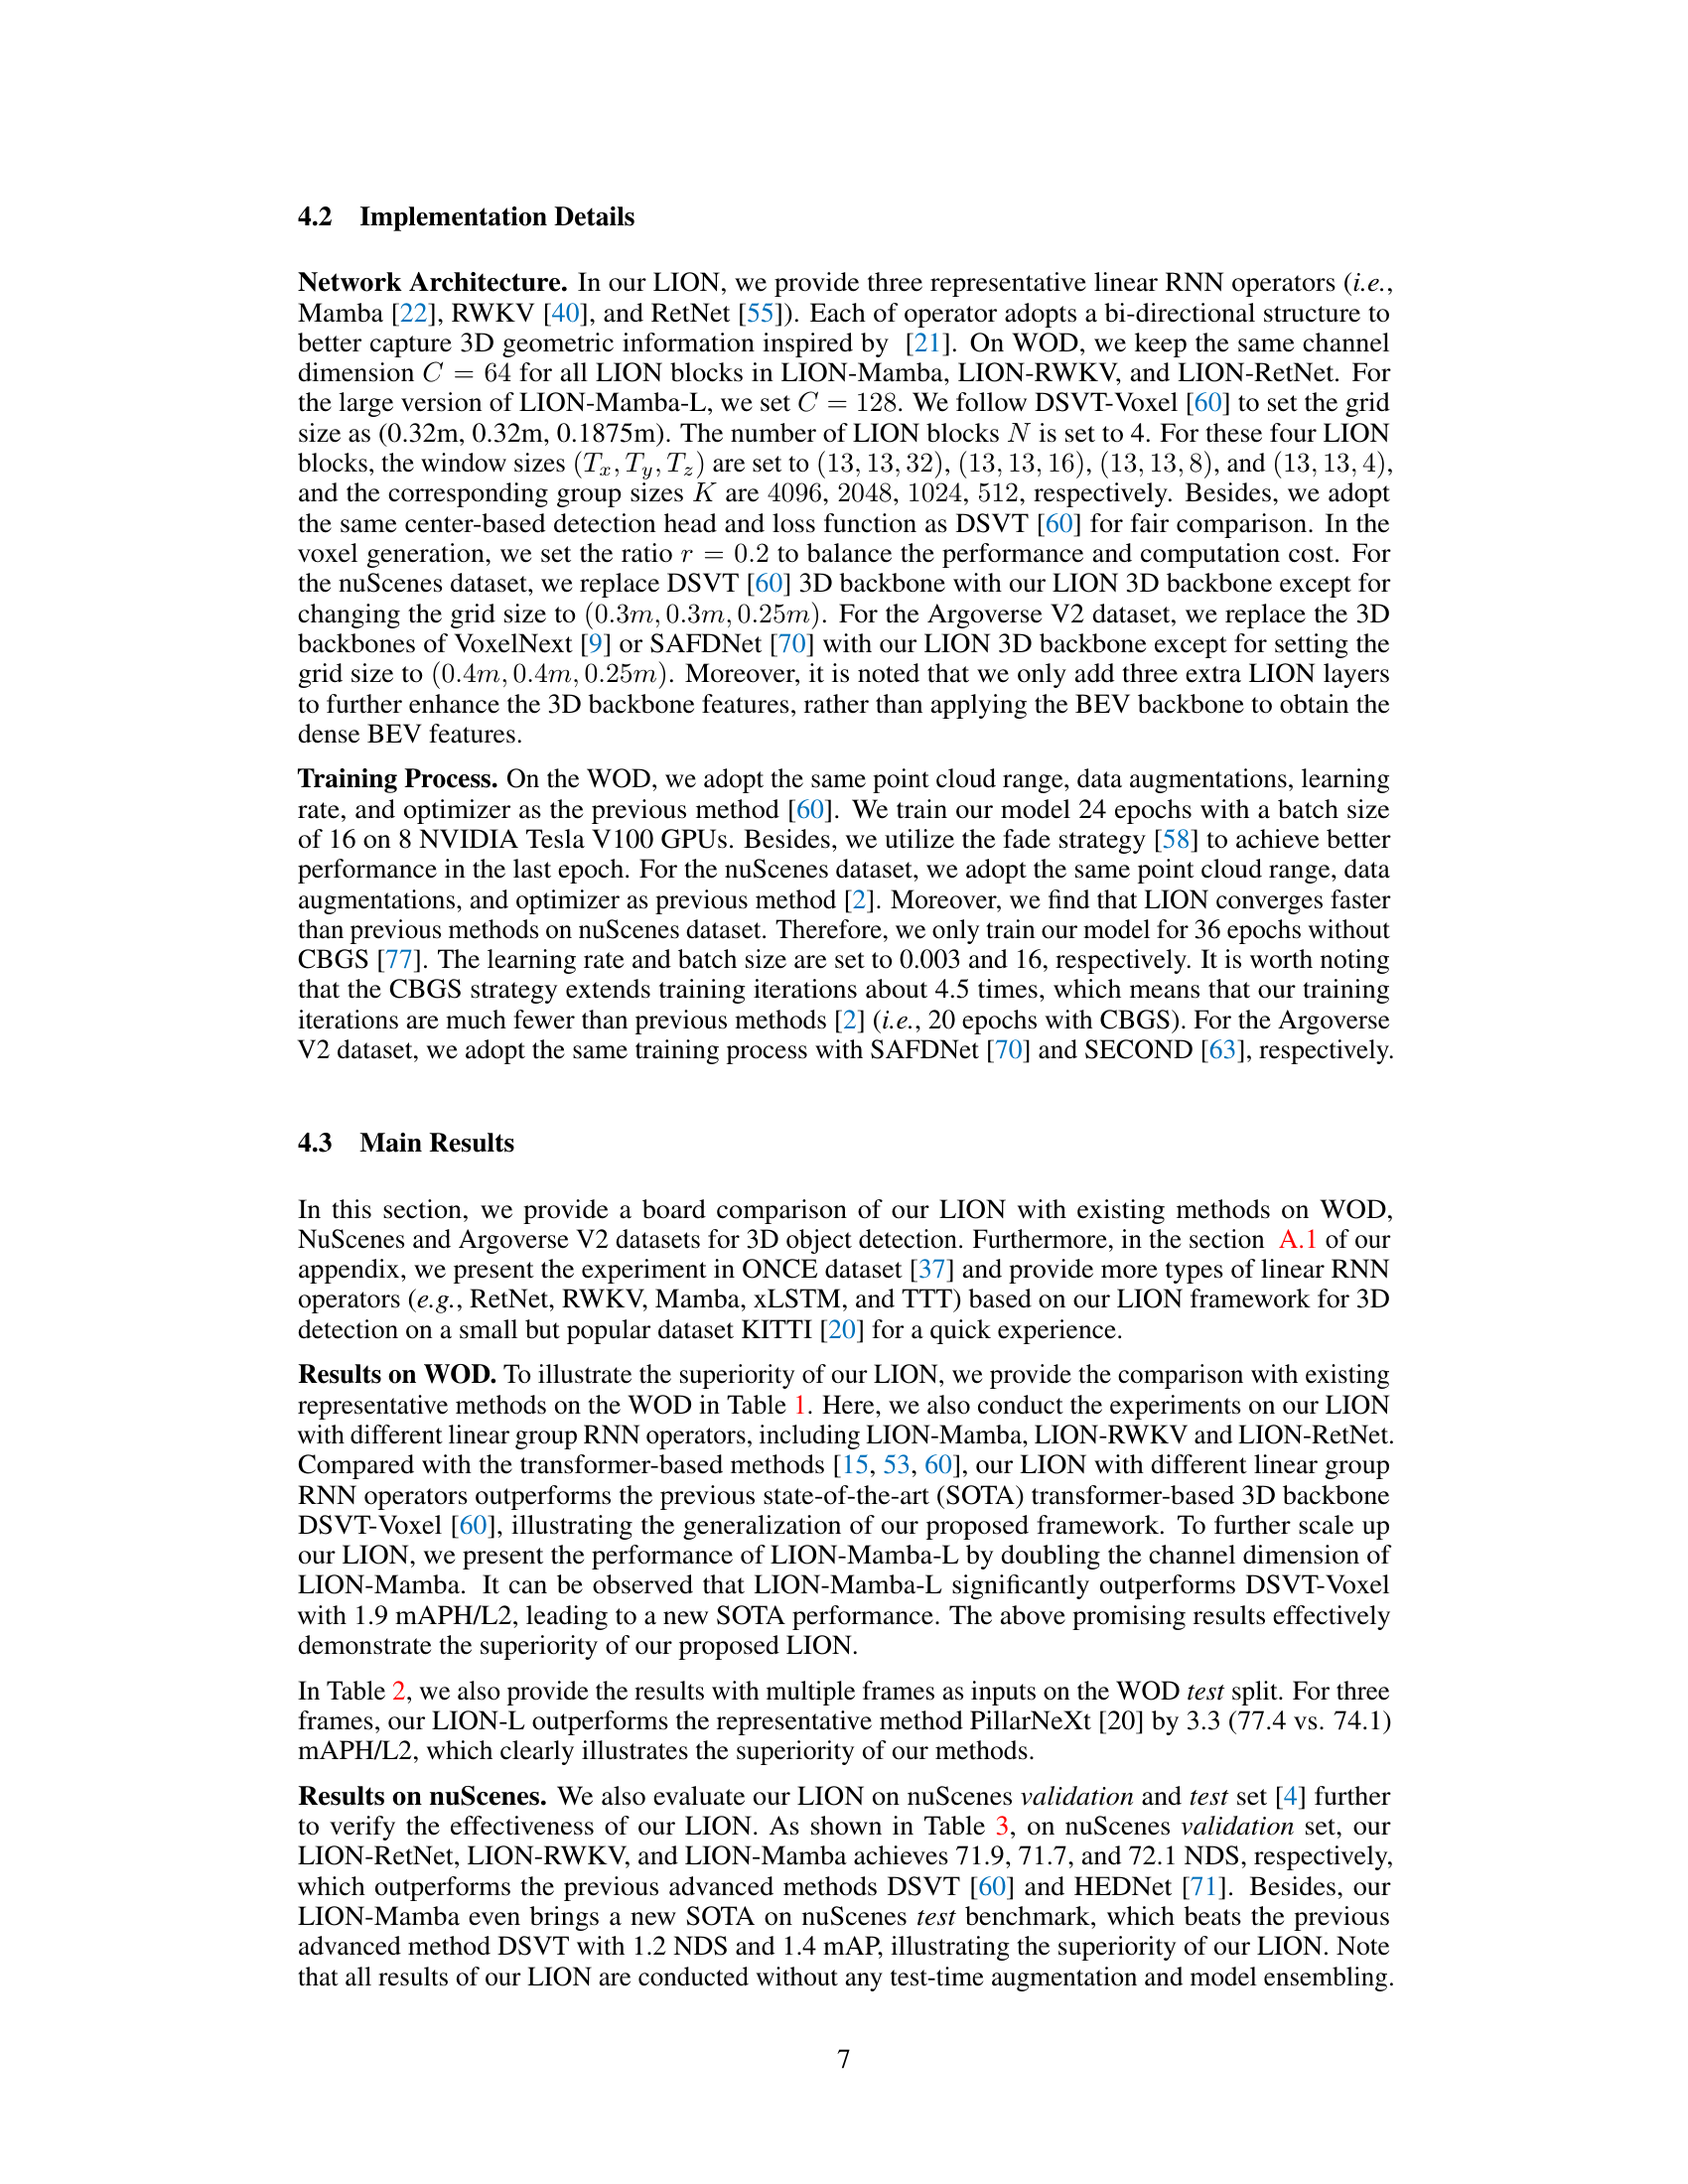
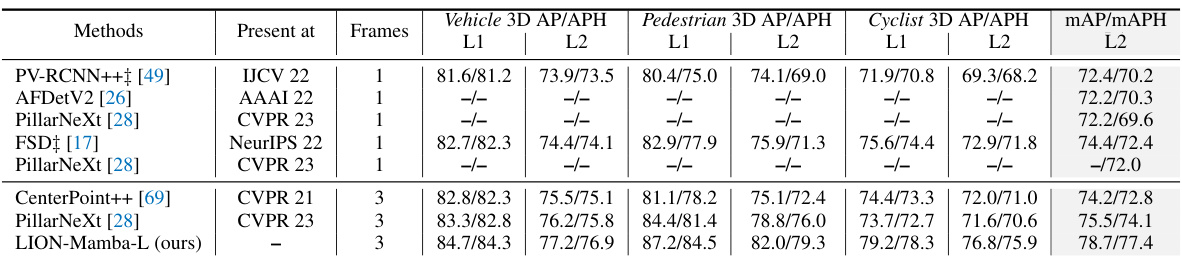
🔼 This table presents a comparison of the proposed LION model’s performance against various state-of-the-art 3D object detection methods on the Waymo Open Dataset validation set. The table shows metrics (3D AP/APH) for vehicle, pedestrian, and cyclist categories, broken down by difficulty levels (L1 and L2). Different models are compared, including those using various backbones (Transformer, Sparse Convolution, and RNN based), and their results are presented without using test-time augmentation or model ensembling. The ‘L’ suffix indicates a larger channel dimension in the LION model.
read the caption
Table 1: Performances on the Waymo Open Dataset validation set (train with 100% training data). ‡ denotes the two-stage method. Bold denotes the best performance of all methods. '-L' means we double the dimension of channels in LION 3D backbone. RNN denotes the linear RNN operator. All results are presented with single-frame input, no test-time augmentation, and no model ensembling.
In-depth insights#
Linear RNNs in 3D#
Linear Recurrent Neural Networks (RNNs) present a compelling alternative to Transformers for 3D point cloud processing. Their linear computational complexity offers significant advantages over the quadratic complexity of Transformers, especially when handling large-scale point clouds. However, directly applying linear RNNs to 3D data isn’t straightforward due to the inherent sequential nature of RNNs and the spatial structure of 3D point clouds. This necessitates innovative approaches to represent 3D spatial information in a sequential format suitable for linear RNN processing. Key challenges include efficiently encoding spatial relationships between points, mitigating the information loss inherent in converting 3D data into a 1D sequence, and effectively leveraging the autoregressive nature of linear RNNs. Successful strategies may involve the use of sophisticated spatial feature descriptors (e.g., 3D voxel grids or other suitable encoding) to maintain spatial context while processing sequentially. Additionally, attention mechanisms or other techniques could help to focus the RNN on relevant portions of the data while maintaining efficiency. Novel architectures are likely to be needed, potentially combining linear RNNs with other efficient methods (such as sparse convolution) to capture both local and global features effectively. The potential for linear RNNs to offer a fast and efficient approach to 3D point cloud processing makes this a very active and important area of research.
Voxel Feature Enhance#
Enhancing voxel features is crucial for improving 3D object detection in point clouds. This involves techniques to increase the expressiveness of voxel representations, often addressing the inherent sparsity and irregularity of point cloud data. Methods might focus on enriching feature dimensionality through concatenation with other features (e.g., spatial coordinates, normals), applying advanced convolutional operations, or incorporating attention mechanisms for context aggregation. Alternatively, approaches might aim to improve the spatial resolution of voxels, potentially through upsampling or super-resolution techniques. The choice of method often depends on the trade-off between computational cost, accuracy improvements, and the specific characteristics of the point cloud dataset. Ultimately, effective voxel feature enhancement is key to bridging the gap between raw point cloud data and high-level semantic understanding necessary for accurate 3D object detection. Autoregressive models may also be leveraged to enhance feature generation and refine spatial information for a more comprehensive 3D representation.
Window-Based Approach#
Window-based approaches in 3D object detection offer a compelling strategy to manage the computational complexity associated with processing large-scale point clouds. By partitioning the point cloud into smaller, manageable windows, these methods reduce the computational burden of algorithms like self-attention, making them more scalable. Local feature interactions within each window allow for efficient feature extraction and aggregation, improving the accuracy of object detection. However, the choice of window size and shape is critical; too small, and long-range dependencies are missed, while too large negates the computational benefits. Effective strategies for handling boundary effects and combining local window results are crucial for holistic object detection. The use of linear group RNNs within this approach is particularly interesting, as it offers a potentially computationally efficient alternative to transformers while still allowing for long-range feature interactions across windows. Overall, window-based approaches represent a valuable trade-off between computational efficiency and detection accuracy in the challenging field of 3D point cloud processing.
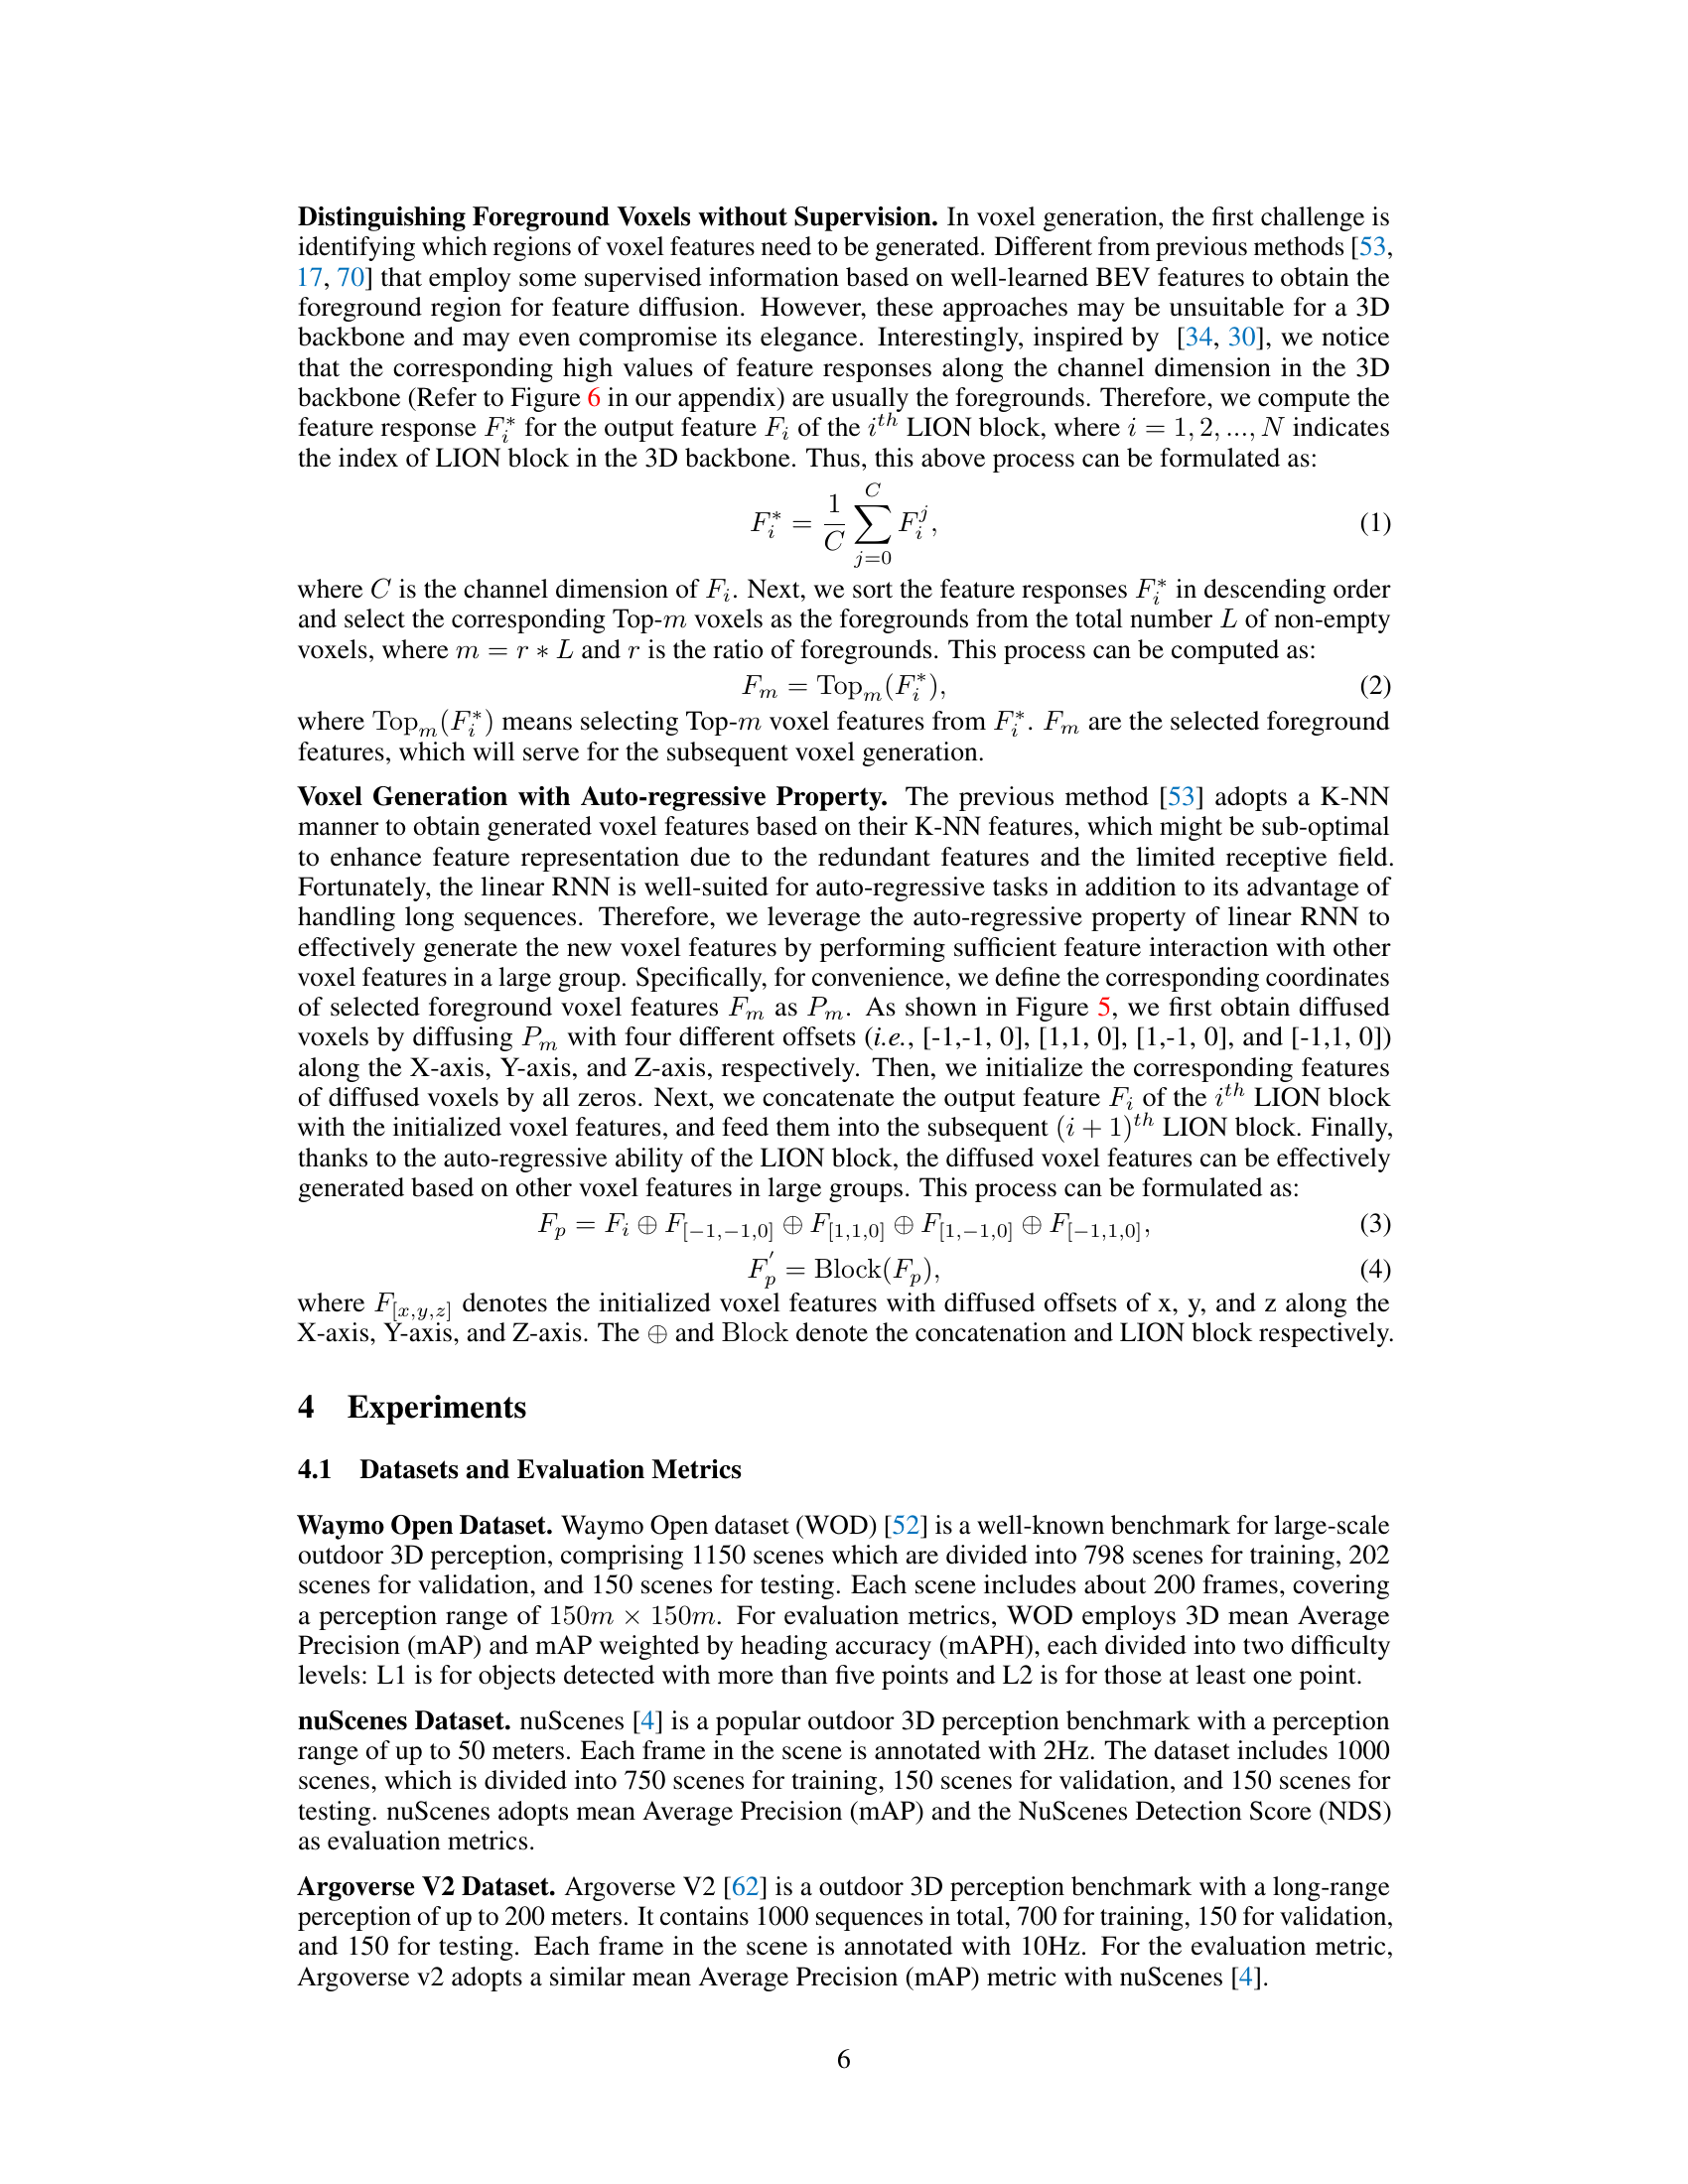
Autoregressive Voxel Gen#
An autoregressive voxel generation method for 3D object detection in point clouds aims to address the sparsity issue inherent in such data. The core idea is to leverage the autoregressive property of linear group RNNs to intelligently generate new voxel features, effectively densifying the point cloud representation, particularly in foreground regions. This approach cleverly bypasses the need for explicit foreground/background segmentation, relying instead on the inherent autoregressive capabilities of the model to predict missing voxel data. The method’s simplicity and integration with the existing linear group RNN framework are key strengths, offering a potentially more efficient and elegant solution compared to methods requiring additional supervised information or complex architectural modifications. The autoregressive nature of the process allows for contextual feature generation, enhancing feature discriminability and improving overall detection accuracy. A crucial aspect is identifying foreground voxels effectively to focus the generation process on relevant areas. While the details of this selection process are key to success, the method highlights a promising pathway for significantly improving 3D point cloud perception by addressing sparsity issues in a principled and computationally efficient manner.
SOTA Performance#
Achieving state-of-the-art (SOTA) performance is a significant accomplishment in any research field, and this paper is no exception. The claim of SOTA results necessitates a rigorous examination. Specific datasets on which SOTA is claimed must be clearly identified. Quantitative metrics used to demonstrate superiority over previous methods must be explicitly stated and justified. A thorough comparison with the most relevant prior work is crucial, not only highlighting superior performance, but also providing context for the improvements. The robustness of the SOTA results needs careful consideration; the methodology should be examined for potential biases and limitations. Finally, generalizability to other datasets or settings should be considered. Reproducibility of the SOTA results is also critical; sufficient details about the experimental setup and data should be provided to allow verification by others. Therefore, claims of SOTA performance demand a high level of clarity and evidence.
More visual insights#
More on figures
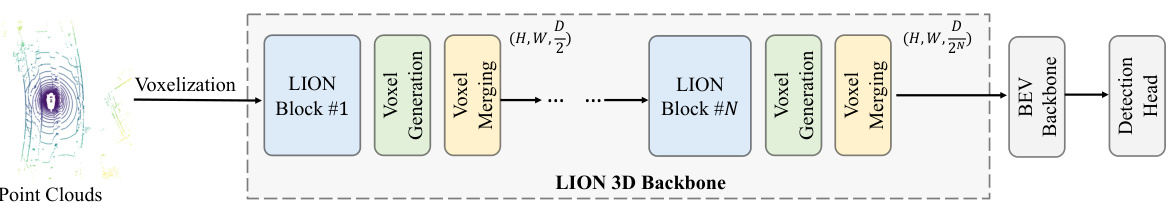
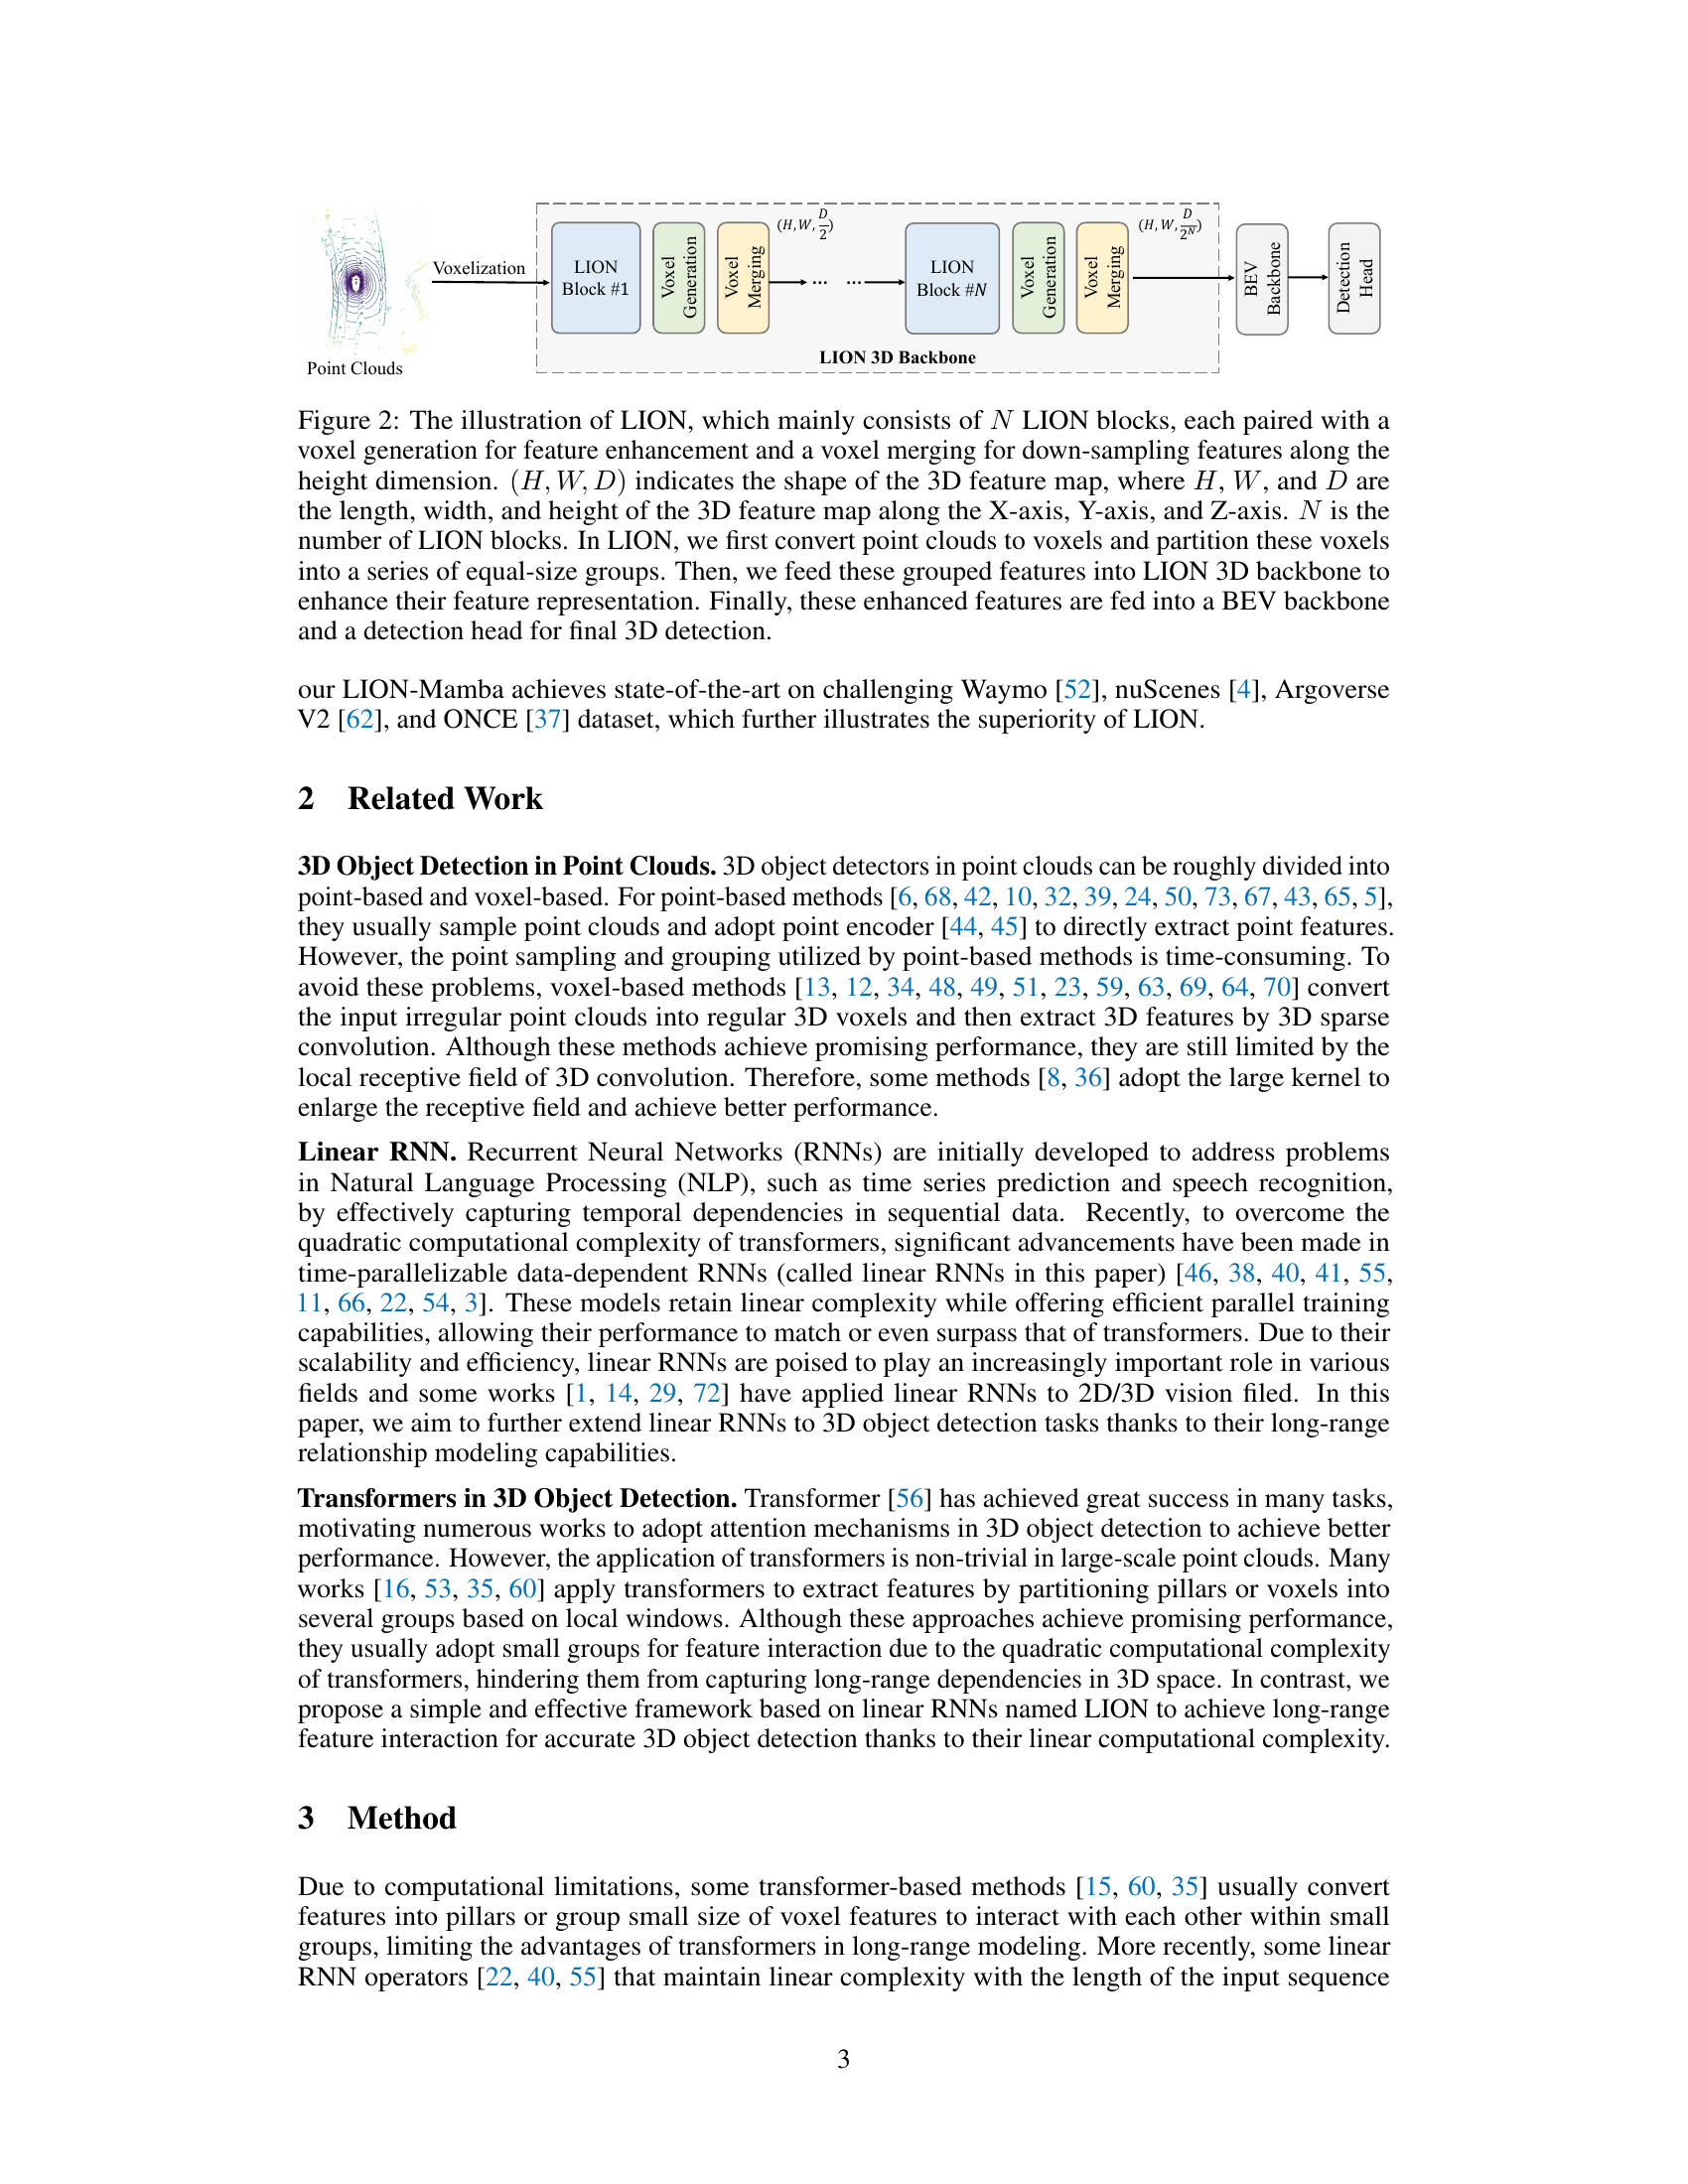
🔼 This figure illustrates the overall architecture of the LION model for 3D object detection. It consists of several LION blocks, each containing voxel generation and merging modules. The input is point clouds, which are first voxelized and then processed through the LION blocks. The output of the LION 3D backbone is then passed to the BEV (Bird’s Eye View) backbone and finally a detection head for generating the final object detection results.
read the caption
Figure 2: The illustration of LION, which mainly consists of N LION blocks, each paired with a voxel generation for feature enhancement and a voxel merging for down-sampling features along the height dimension. (H, W, D) indicates the shape of the 3D feature map, where H, W, and D are the length, width, and height of the 3D feature map along the X-axis, Y-axis, and Z-axis. N is the number of LION blocks. In LION, we first convert point clouds to voxels and partition these voxels into a series of equal-size groups. Then, we feed these grouped features into LION 3D backbone to enhance their feature representation. Finally, these enhanced features are fed into a BEV backbone and a detection head for final 3D detection.
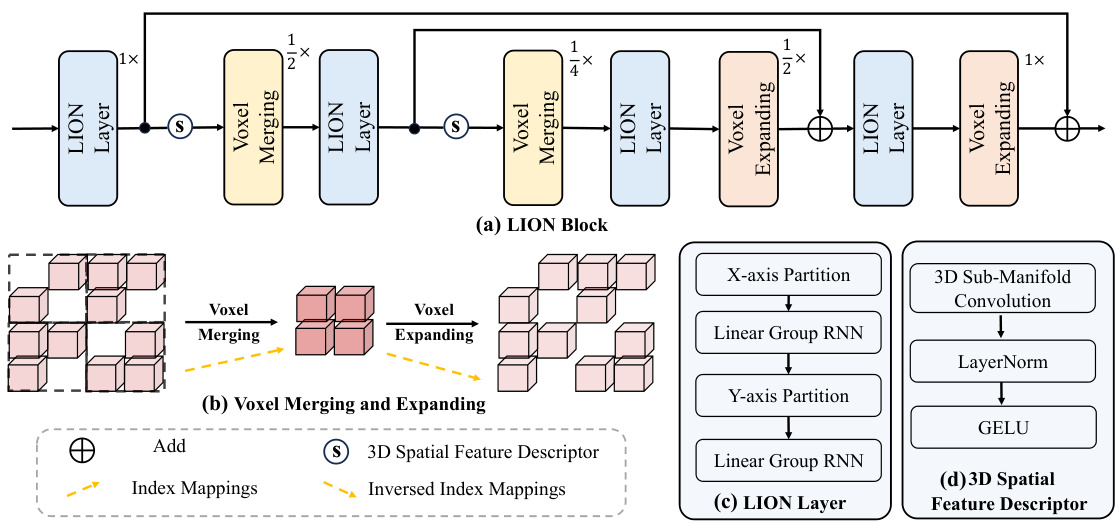
🔼 This figure details the architecture of the LION block, a core component of the LION framework for 3D object detection. Panel (a) shows the overall structure of the LION block, illustrating the sequence of LION layers, voxel merging and expanding operations, and the integration of 3D spatial feature descriptors. Panels (b), (c), and (d) provide more detailed views of the voxel merging and expanding processes, the LION layer’s internal structure (involving linear group RNN operations along both the x-axis and y-axis), and the design of the 3D spatial feature descriptor, respectively. The figure clarifies how the framework uses a hierarchical structure to process features at multiple scales.
read the caption
Figure 3: (a) shows the structure of LION block, which involves four LION layers, two voxel merging operations, two voxel expanding operations, and two 3D spatial feature descriptors. Here, 1×, ×, and × indicate the resolution of 3D feature map as (H, W, D), (H/2, W/2, D/2) and (H/4, W/4, D/4), respectively. (b) is the process of voxel merging for voxel down-sampling and voxel expanding for voxel up-sampling. (c) presents the structure of LION layer. (d) shows the details of the 3D spatial feature descriptor.
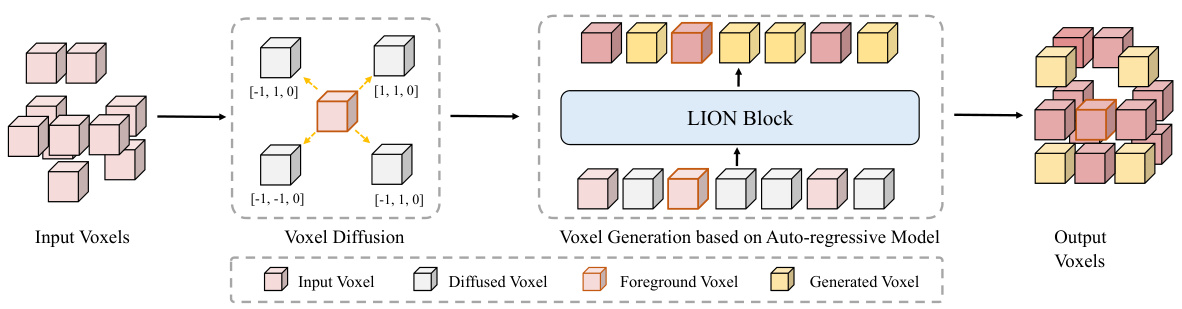
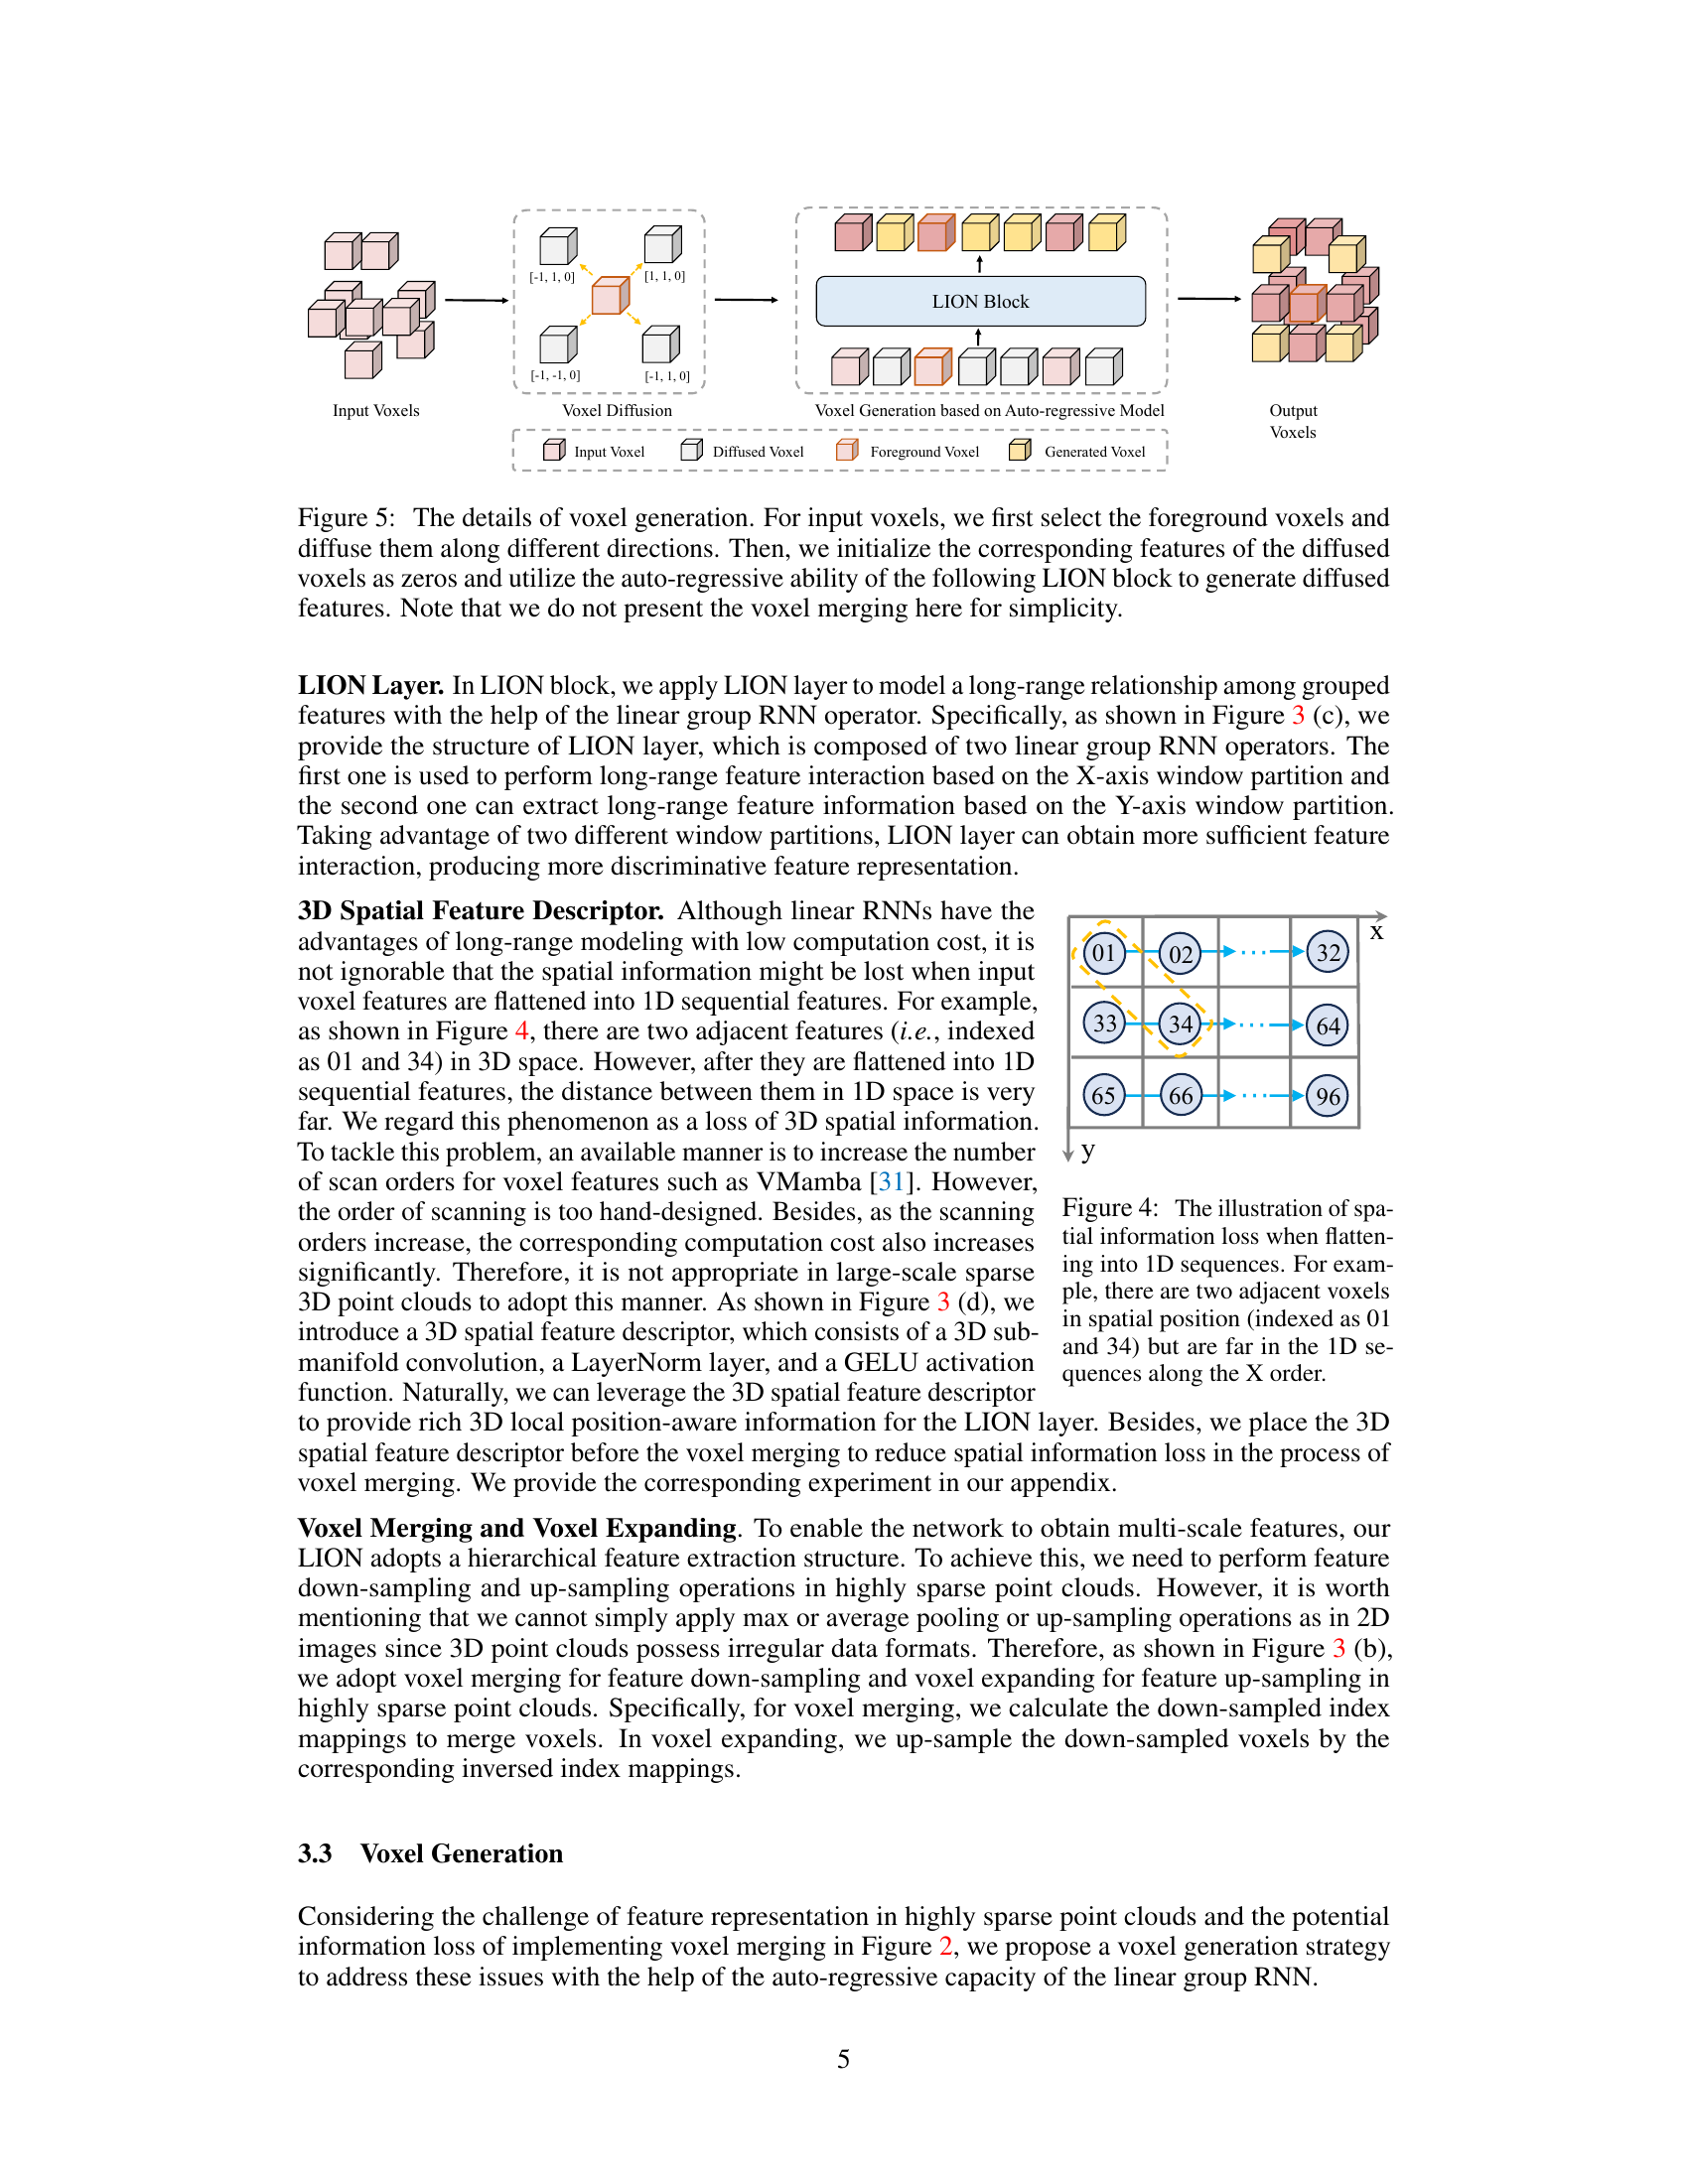
🔼 This figure illustrates the voxel generation process in LION. It starts with input voxels, where foreground voxels are identified and diffused in four directions. These diffused voxels are initialized with zero features and fed into a LION block, which uses its auto-regressive property to generate features for the diffused voxels. The process enhances feature representation in sparse point clouds, particularly for foreground objects. The voxel merging step is omitted for simplicity.
read the caption
Figure 5: The details of voxel generation. For input voxels, we first select the foreground voxels and diffuse them along different directions. Then, we initialize the corresponding features of the diffused voxels as zeros and utilize the auto-regressive ability of the following LION block to generate diffused features. Note that we do not present the voxel merging here for simplicity.
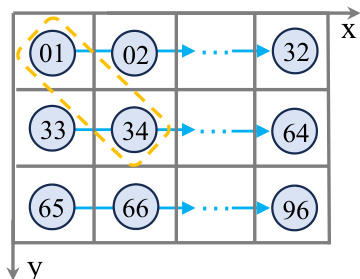
🔼 This figure illustrates a limitation of converting 3D spatial data into 1D sequential data for use in linear group RNNs. Two voxels that are adjacent in 3D space (01 and 34) become distant when the data is flattened into a 1D sequence. This spatial information loss is addressed in the LION framework by incorporating a 3D spatial feature descriptor.
read the caption
Figure 4: The illustration of spatial information loss when flattening into 1D sequences. For example, there are two adjacent voxels in spatial position (indexed as 01 and 34) but are far in the 1D sequences along the X order.
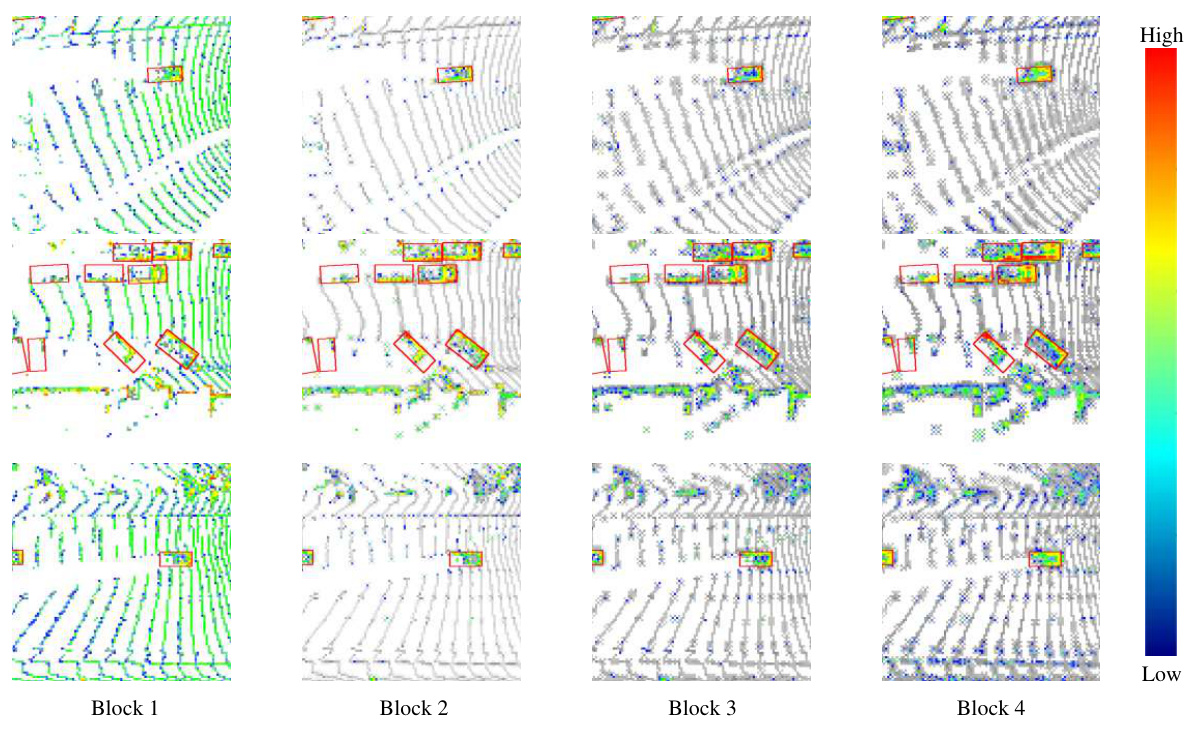
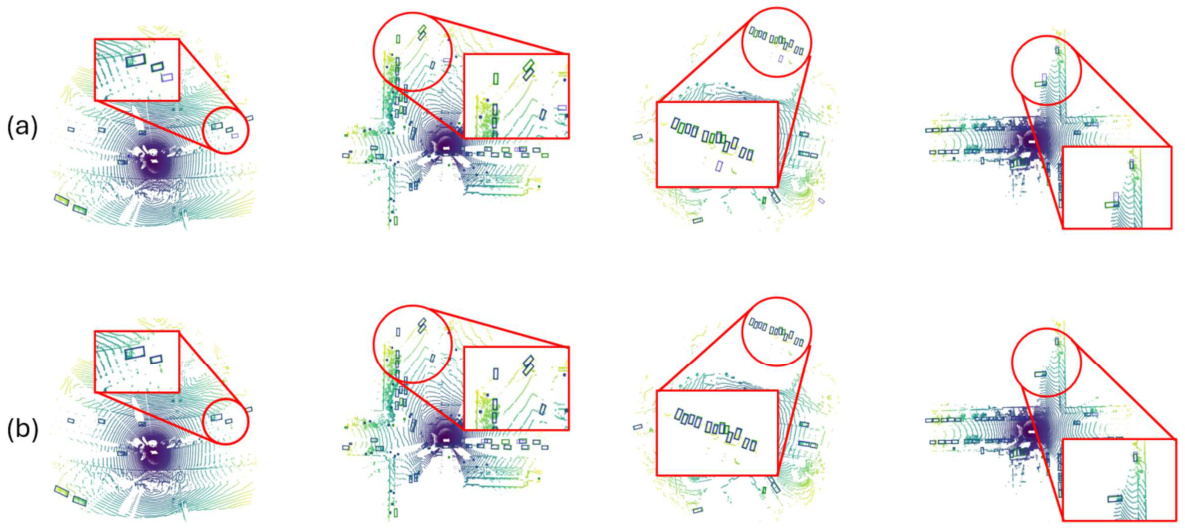
🔼 The figure visualizes feature maps from four different LION blocks. Red boxes highlight ground truth foreground objects. The color intensity represents the magnitude of the feature response, showing how the foreground features become more prominent and distinct as they pass through subsequent blocks. This visualization supports the claim that the voxel generation effectively enhances foreground feature representation.
read the caption
Figure 6: Visualization of feature map of different blocks. We highlight the foreground annotated by red GT boxes. The color map represents the magnitude of the feature response.
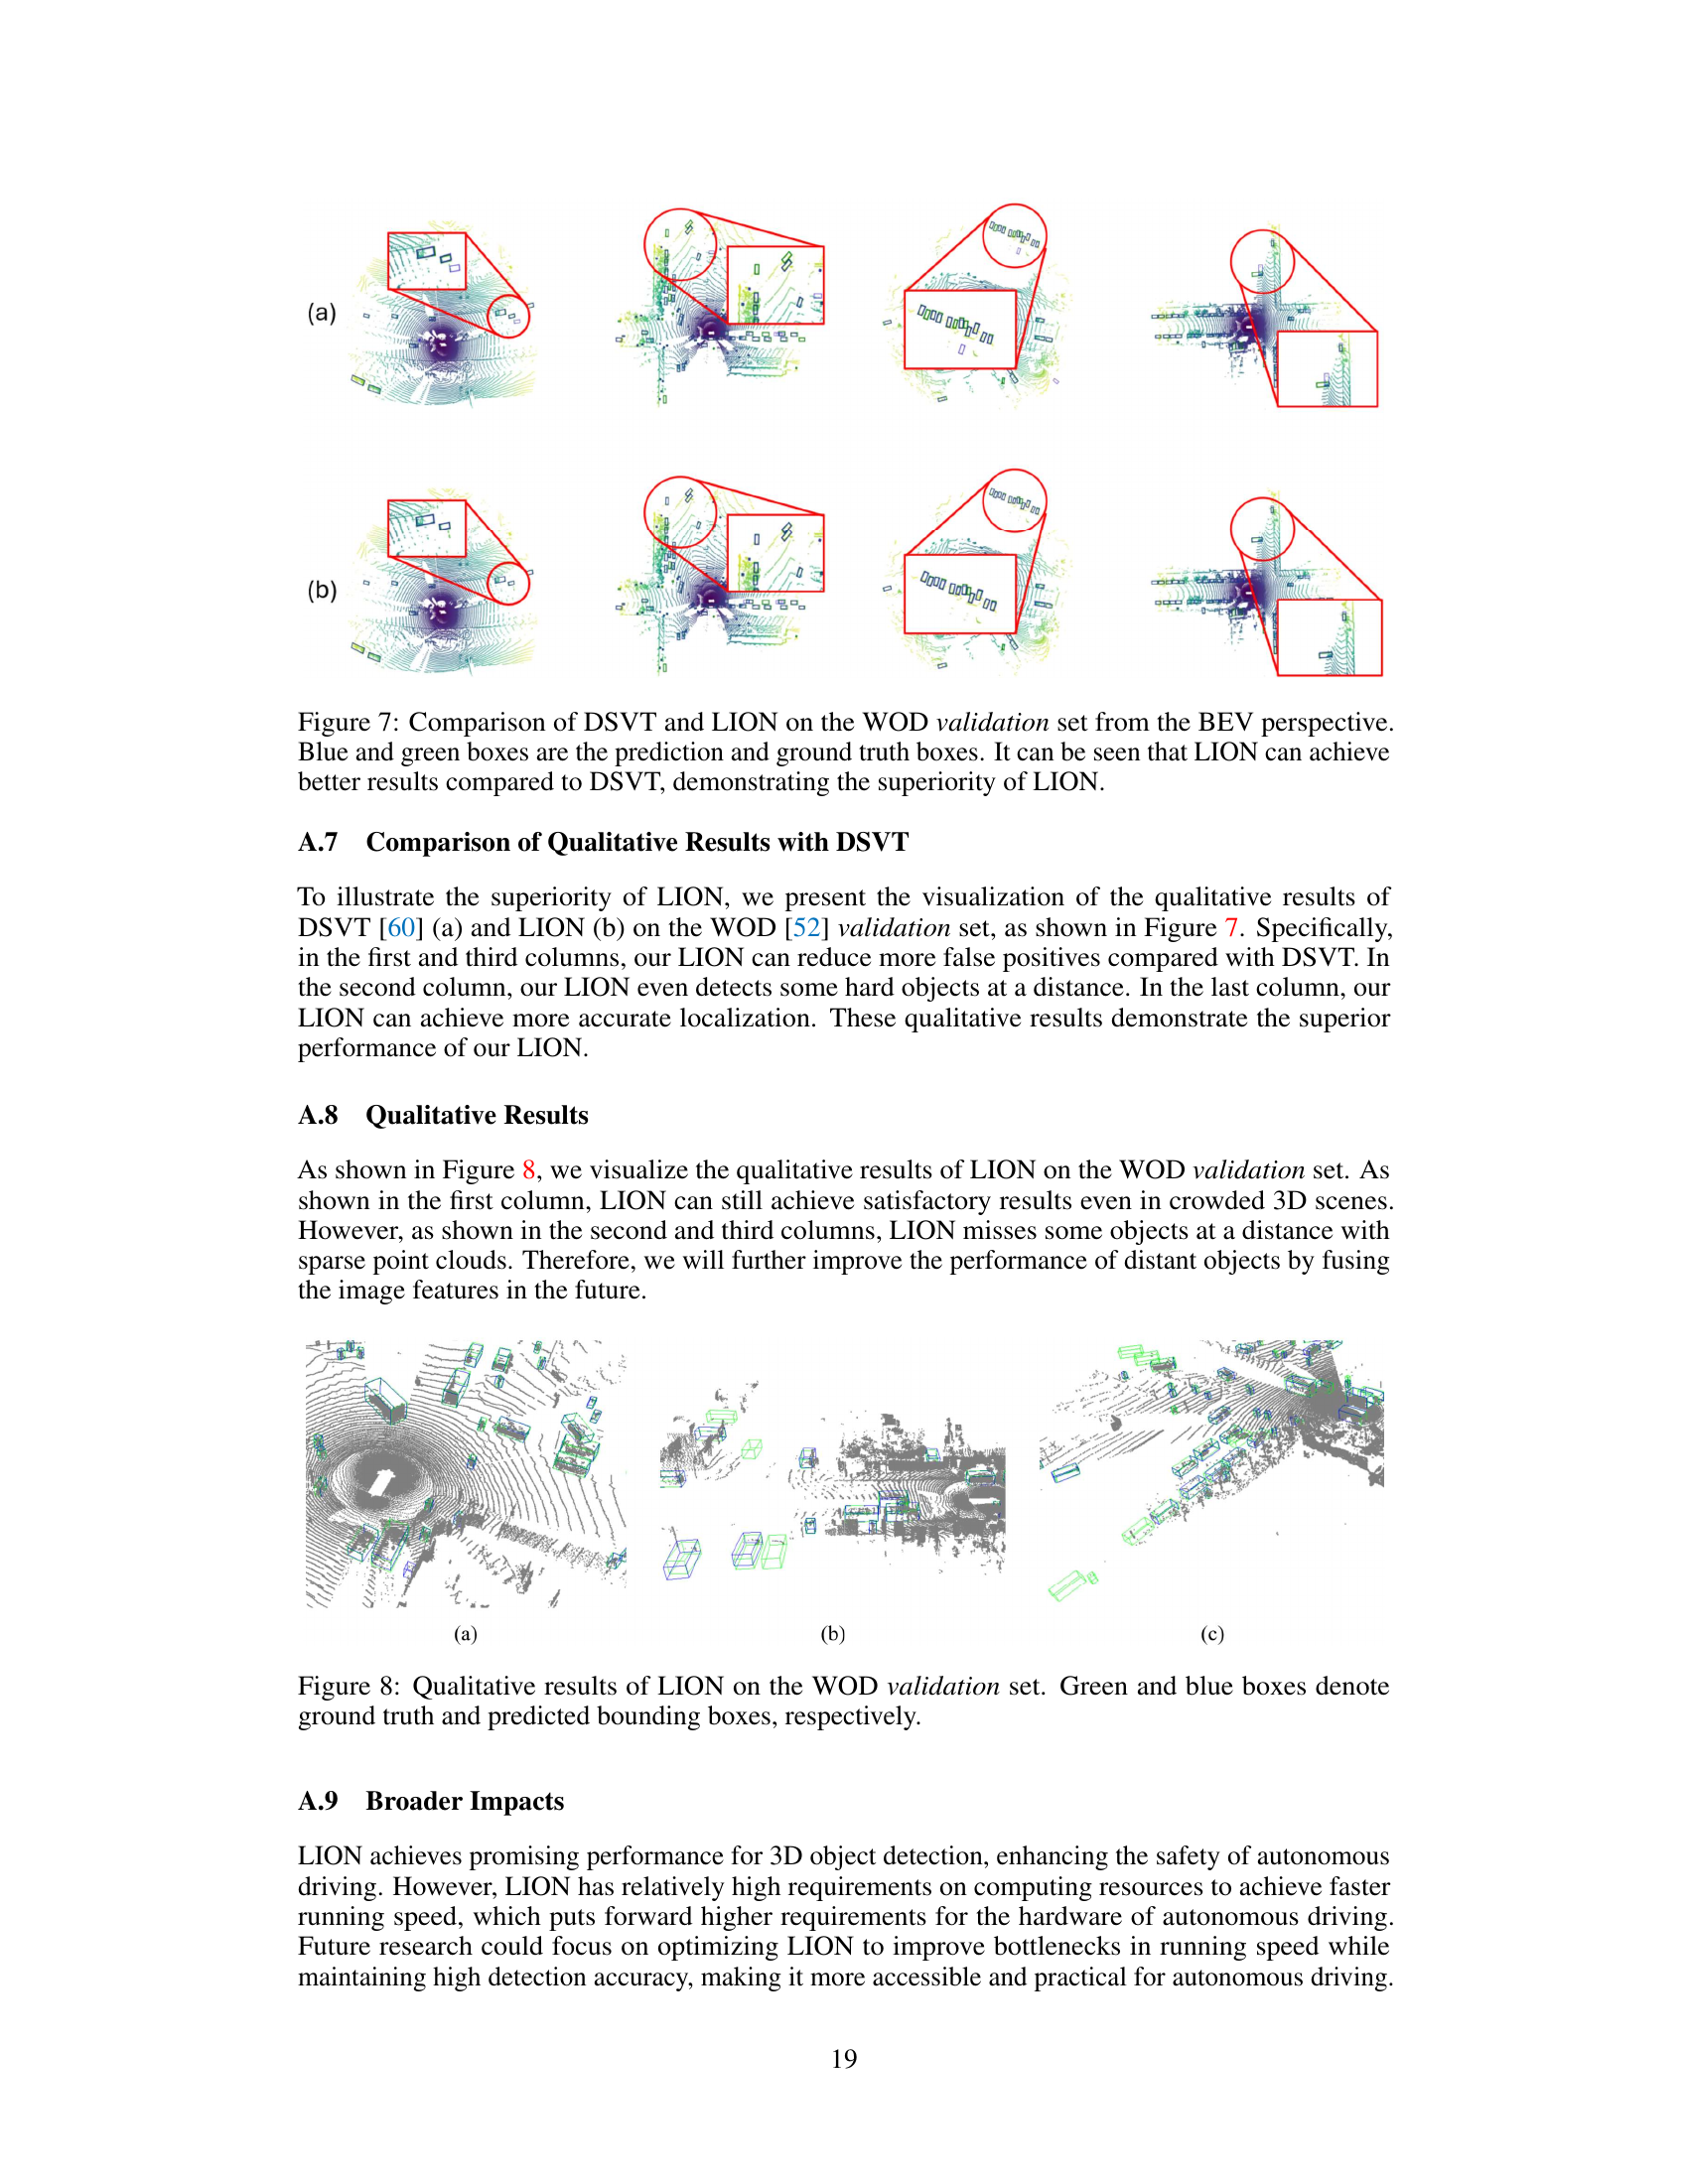
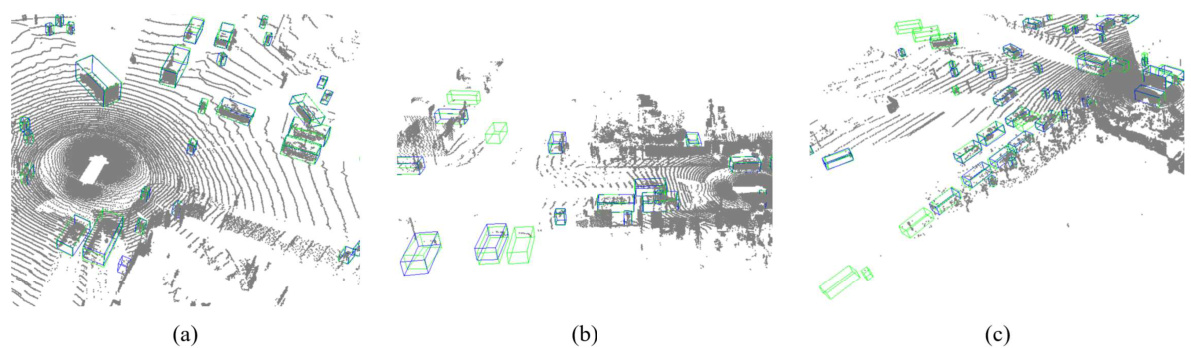
🔼 This figure compares the qualitative results of DSVT and LION on the Waymo Open Dataset (WOD) validation set. The BEV (Bird’s Eye View) perspective is used, showing both predicted (blue) and ground truth (green) bounding boxes for detected objects. The visual comparison demonstrates that LION achieves better accuracy and fewer false positives than DSVT, highlighting its superiority.
read the caption
Figure 7: Comparison of DSVT and LION on the WOD validation set from the BEV perspective. Blue and green boxes are the prediction and ground truth boxes. It can be seen that LION can achieve better results compared to DSVT, demonstrating the superiority of LION.
🔼 This figure compares the qualitative results of DSVT and LION on the Waymo Open Dataset (WOD) validation set. The Bird’s Eye View (BEV) perspective is used, showing both the predicted bounding boxes (blue) and ground truth boxes (green). The comparison highlights LION’s improved accuracy in object detection compared to DSVT.
read the caption
Figure 7: Comparison of DSVT and LION on the WOD validation set from the BEV perspective. Blue and green boxes are the prediction and ground truth boxes. It can be seen that LION can achieve better results compared to DSVT, demonstrating the superiority of LION.
More on tables
🔼 This table presents a comparison of various 3D object detection methods on the Waymo Open Dataset validation set. The methods are compared across different metrics (vehicle, pedestrian, and cyclist 3D AP/APH) for various difficulty levels (L1 and L2). The table highlights the best performing methods in bold and indicates whether a method is two-stage or uses a linear RNN operator. It notes that all results presented use single frames without test-time augmentation.
read the caption
Table 1: Performances on the Waymo Open Dataset validation set (train with 100% training data). ‡ denotes the two-stage method. Bold denotes the best performance of all methods. '-L' means we double the dimension of channels in LION 3D backbone. RNN denotes the linear RNN operator. All results are presented with single-frame input, no test-time augmentation, and no model ensembling.
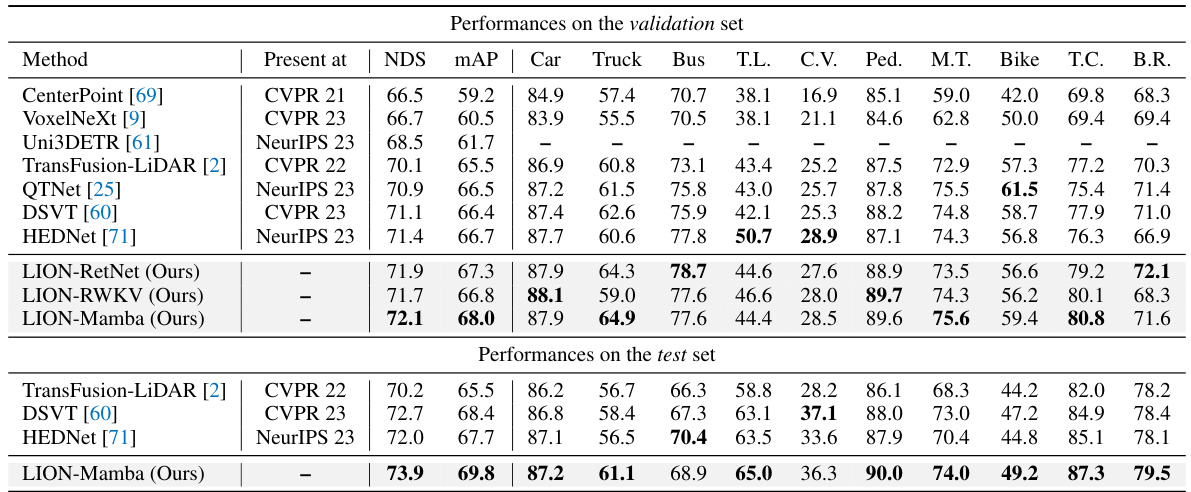
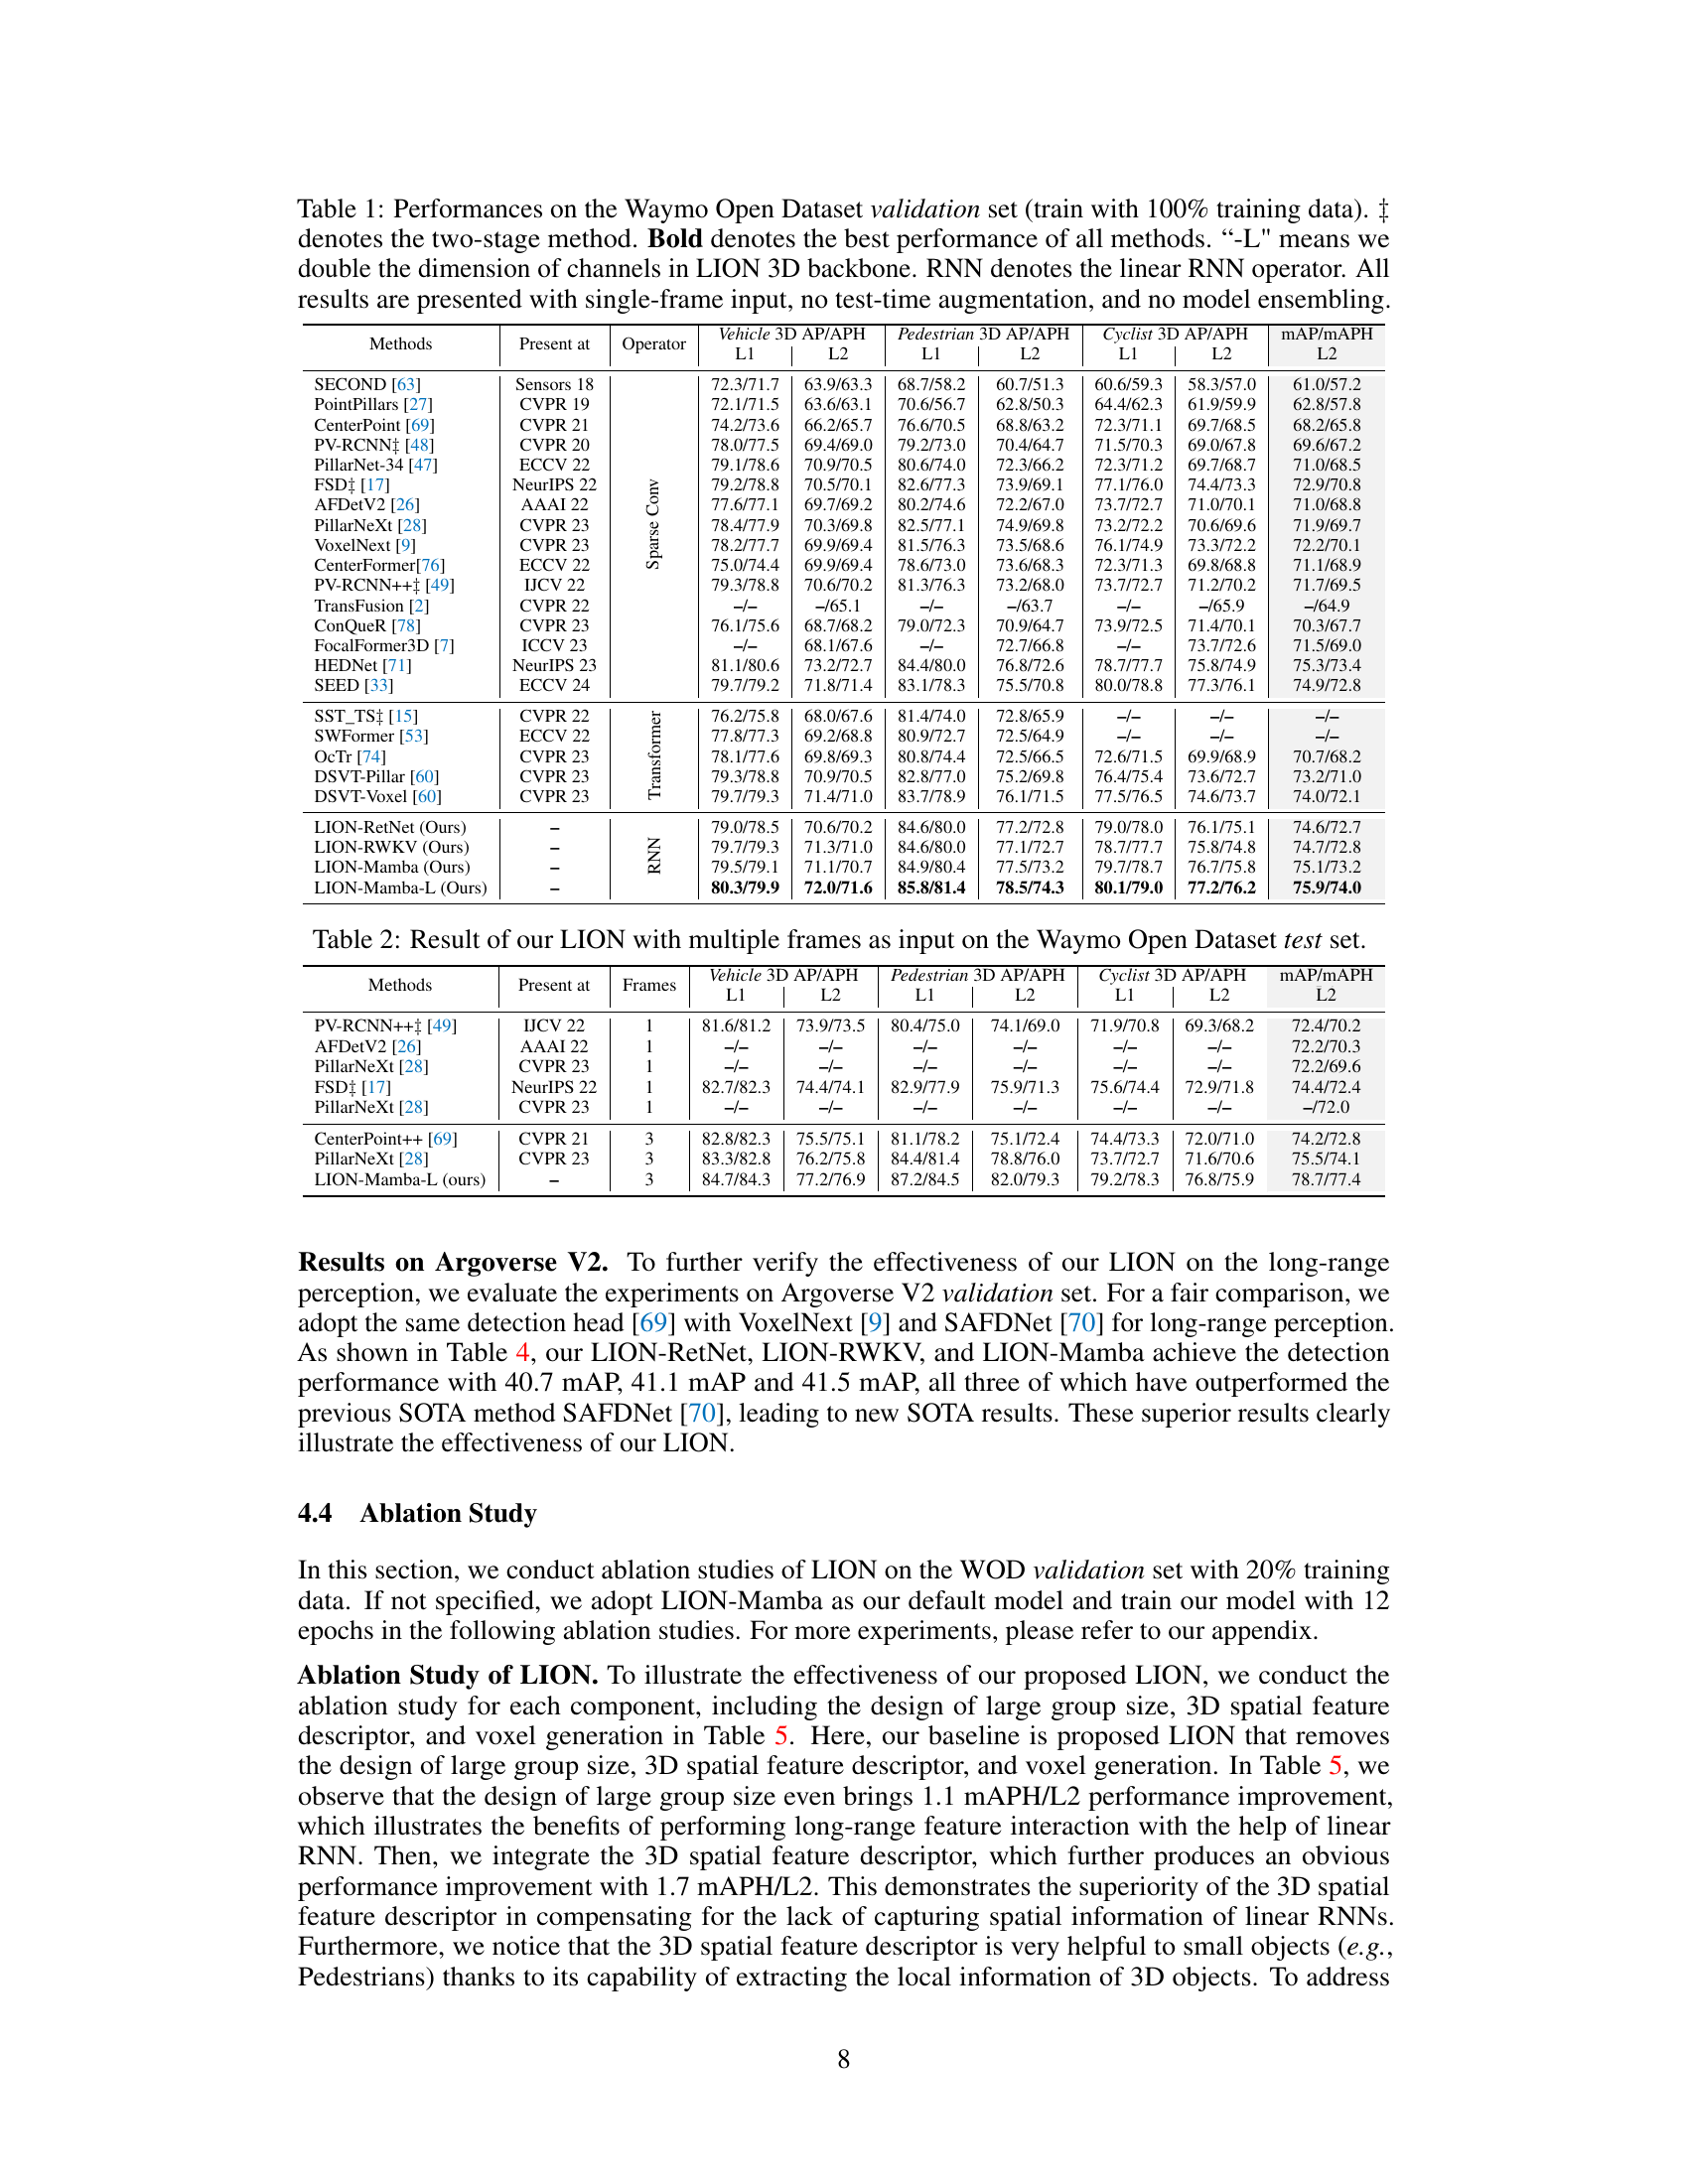
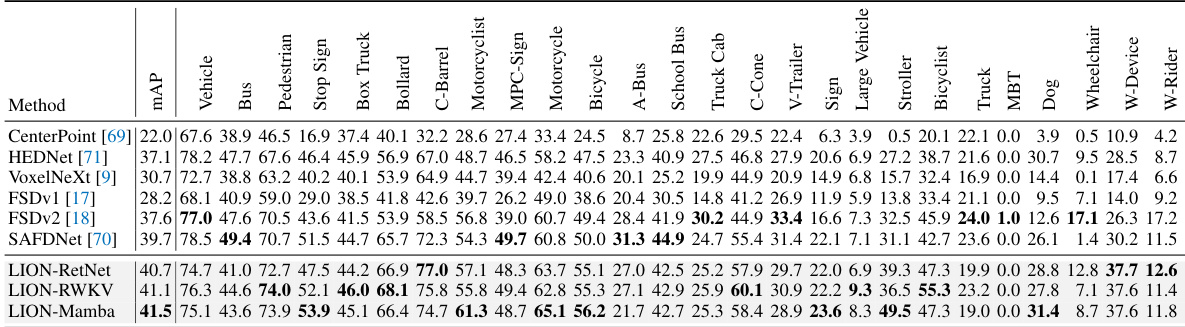
🔼 This table presents the performance comparison of different methods on the nuScenes dataset for 3D object detection. It shows the NuScenes Detection Score (NDS) and mean Average Precision (mAP) for various object categories (car, truck, bus, trailer, construction vehicle, pedestrian, motorcycle, bicycle, traffic cone, and barrier) on both validation and test sets. Results are shown without any test-time augmentation or model ensembling to provide a fair comparison of the model’s inherent capabilities.
read the caption
Table 3: Performances on the nuScenes validation and test set. ‘T.L.’, ‘C.V.’, ‘Ped.’, ‘M.T.’, ‘T.C.’, and ‘B.R.’ are short for trailer, construction vehicle, pedestrian, motor, traffic cone, and barrier, respectively. All results are reported without any test-time augmentation and model ensembling.
🔼 This table presents a comparison of various methods for 3D object detection on the Waymo Open Dataset validation set. The methods are categorized by the type of backbone used (e.g., transformer-based, linear RNN-based). Performance is evaluated using several metrics for vehicle, pedestrian, and cyclist detection across different difficulty levels (L1, L2) and is reported without test-time augmentation or model ensembling. The table highlights the top-performing method in bold.
read the caption
Table 1: Performances on the Waymo Open Dataset validation set (train with 100% training data). ‡ denotes the two-stage method. **Bold** denotes the best performance of all methods. '-L' means we double the dimension of channels in LION 3D backbone. RNN denotes the linear RNN operator. All results are presented with single-frame input, no test-time augmentation, and no model ensembling.

🔼 This table presents the ablation study results for the LION model, showing the impact of different components on the performance. The components tested are the large group size, 3D spatial feature descriptor, and voxel generation. The results are evaluated based on the Vehicle, Pedestrian, and Cyclist classes using the mAP/mAPH (L2) metric, providing a detailed performance breakdown for each combination of components.
read the caption
Table 5: Ablation study for each component in LION. Here, the large group size means that we set it as (4096, 2048, 1024, 512) for four blocks (also refer to the section of our implementation details), otherwise, we set a small group size as (256, 256, 256, 256).
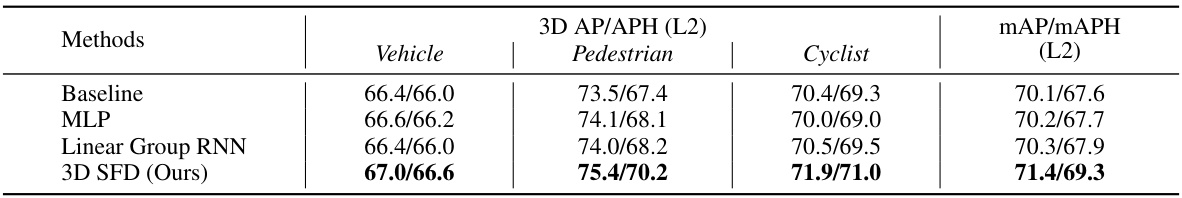
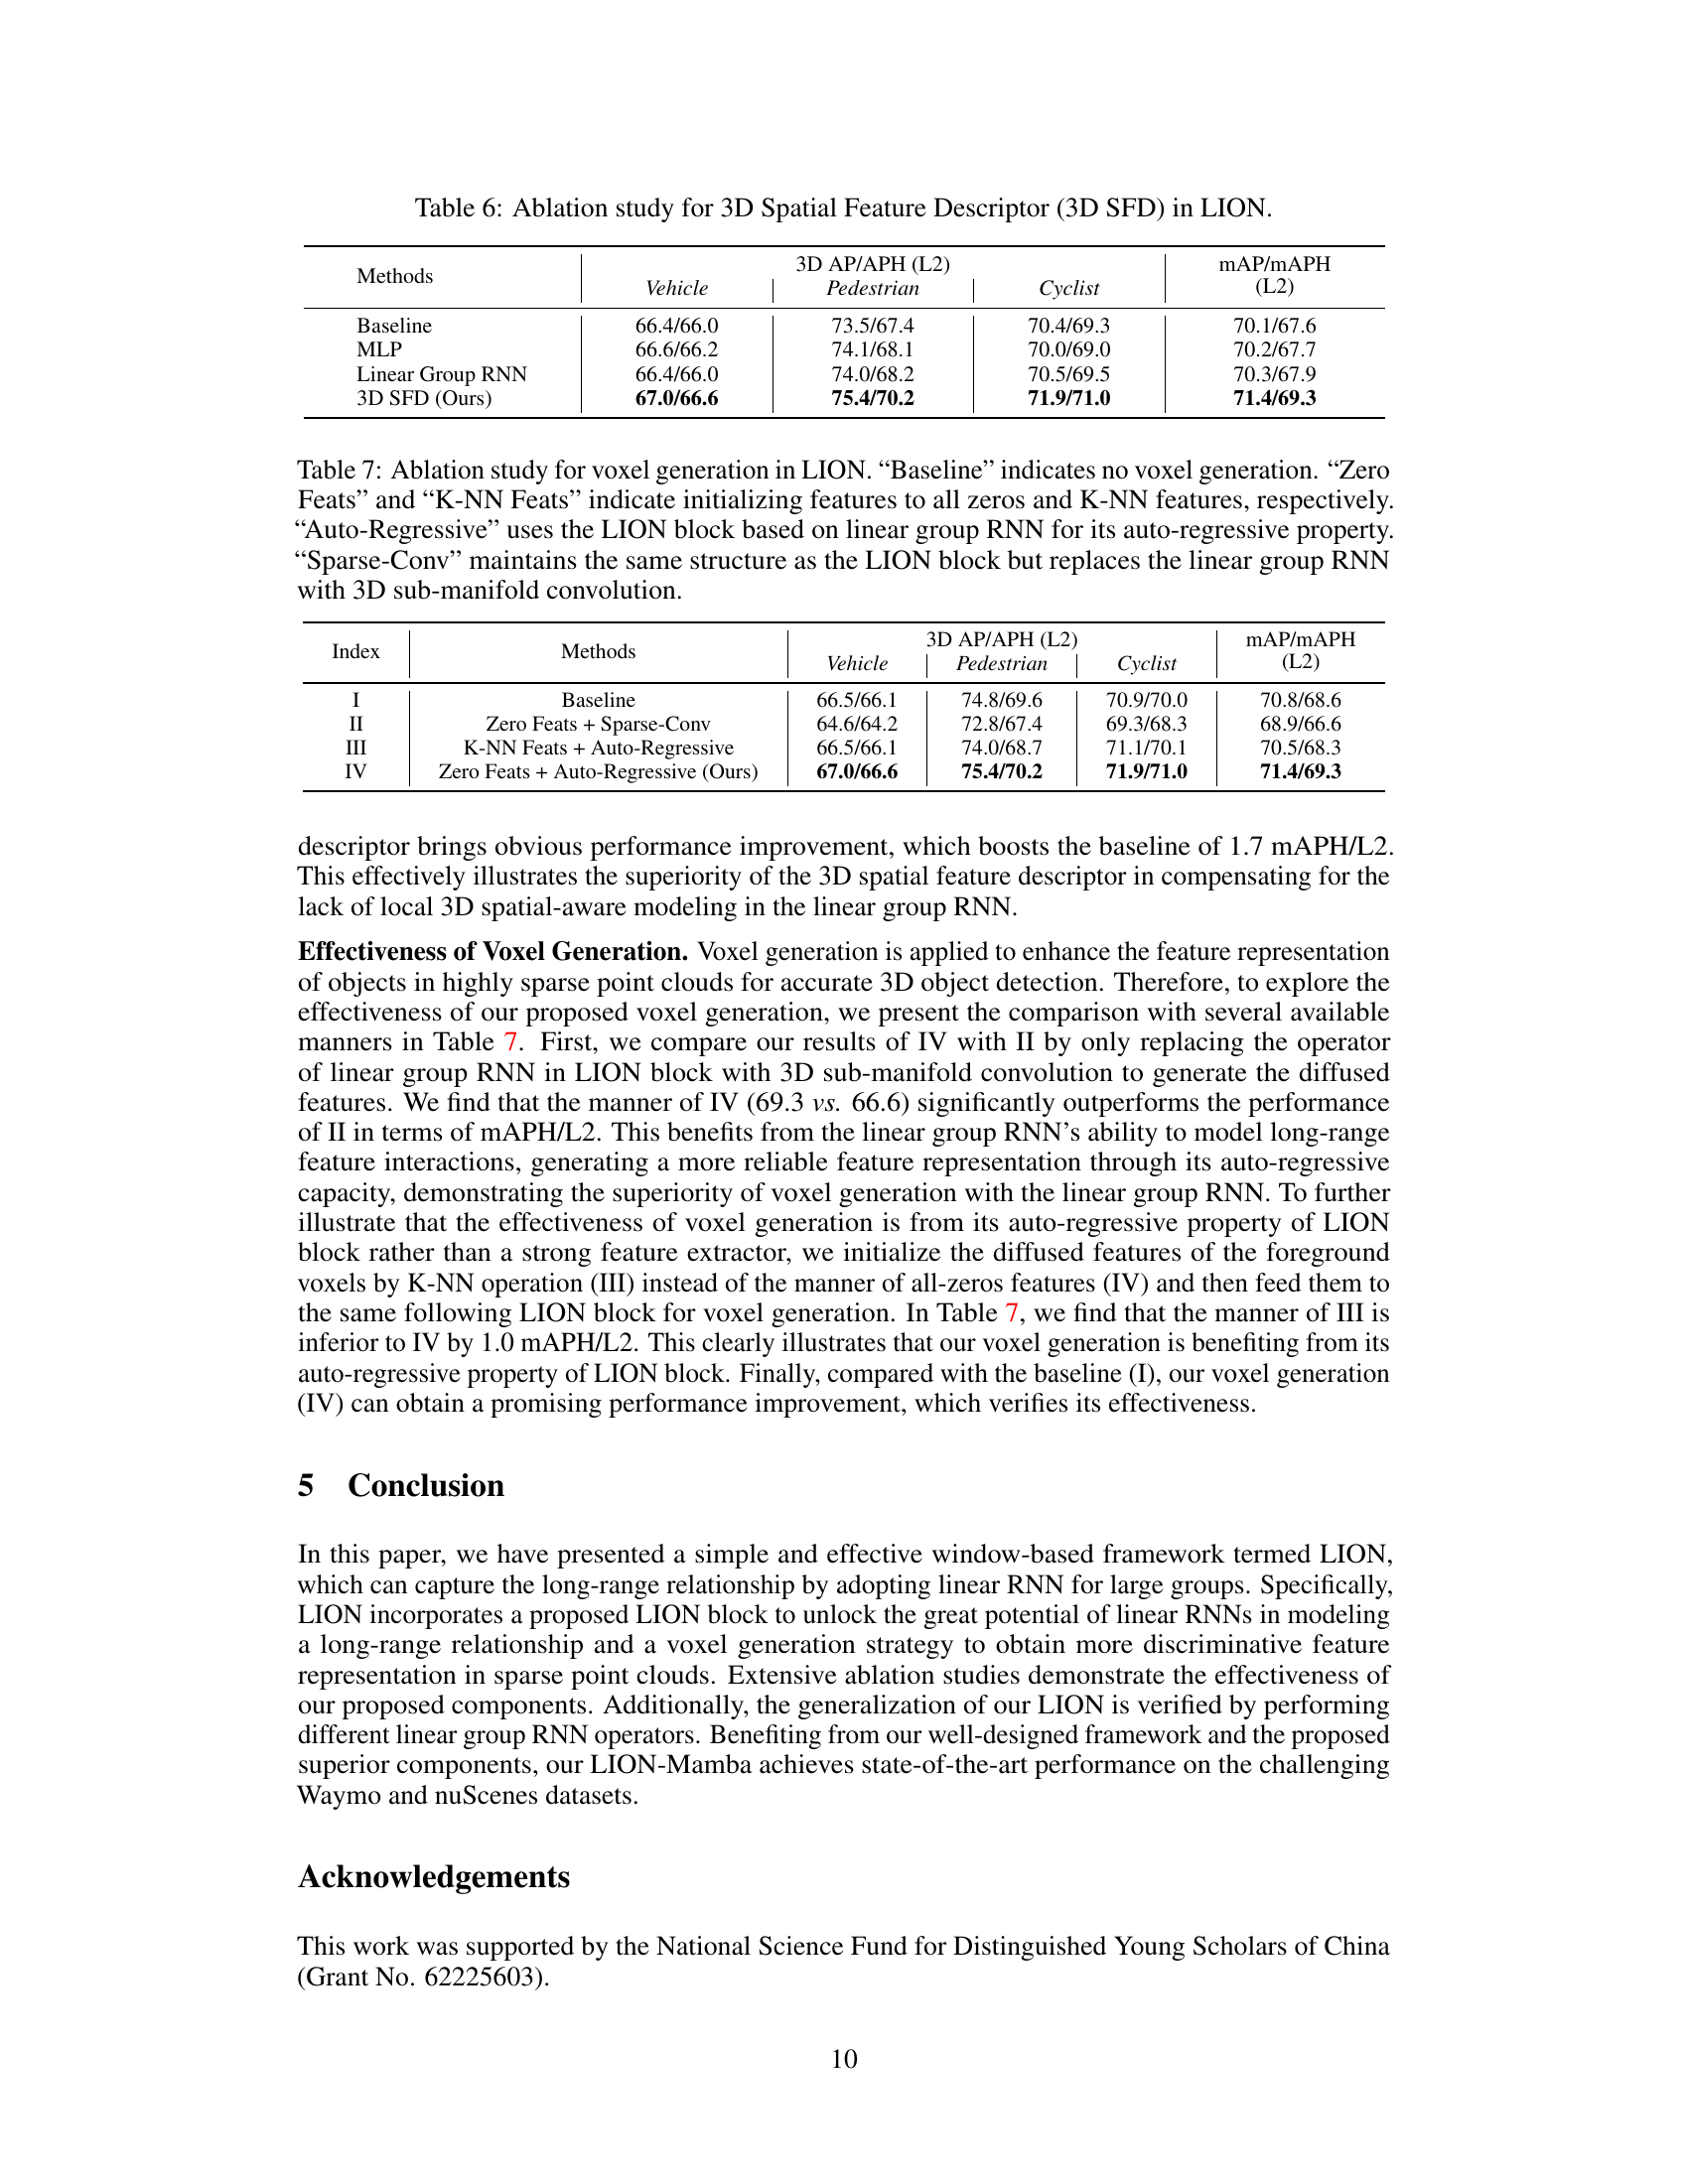
🔼 This ablation study investigates the impact of different 3D spatial feature descriptors on the performance of LION. The baseline uses no 3D spatial feature descriptor. Comparisons are made using an MLP and a Linear Group RNN as alternatives, with the proposed 3D SFD serving as the final comparison point. The results, presented for Vehicle, Pedestrian, Cyclist, and overall mAP/mAPH (L2), highlight the effectiveness of the proposed 3D SFD in enhancing the model’s accuracy.
read the caption
Table 6: Ablation study for 3D Spatial Feature Descriptor (3D SFD) in LION.
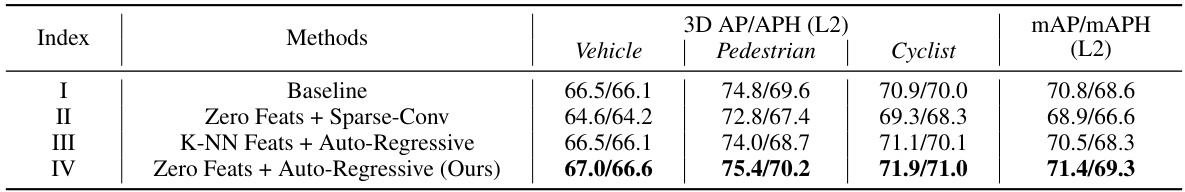
🔼 This table presents the ablation study on the voxel generation method used in LION. It compares the performance of different methods for generating voxels, including using sparse convolution, k-NN features and auto-regressive properties. The ‘Zero Feats + Auto-Regressive’ method is the one proposed by the authors, which uses the auto-regressive property of the linear group RNN. The table shows that the proposed method outperforms other methods in terms of 3D AP/APH (L2) on vehicle, pedestrian, and cyclist categories.
read the caption
Table 7: Ablation study for voxel generation in LION. “Baseline” indicates no voxel generation. 'Zero Feats' and 'K-NN Feats' indicate initializing features to all zeros and K-NN features, respectively. 'Auto-Regressive' uses the LION block based on linear group RNN for its auto-regressive property. 'Sparse-Conv' maintains the same structure as the LION block but replaces the linear group RNN with 3D sub-manifold convolution.
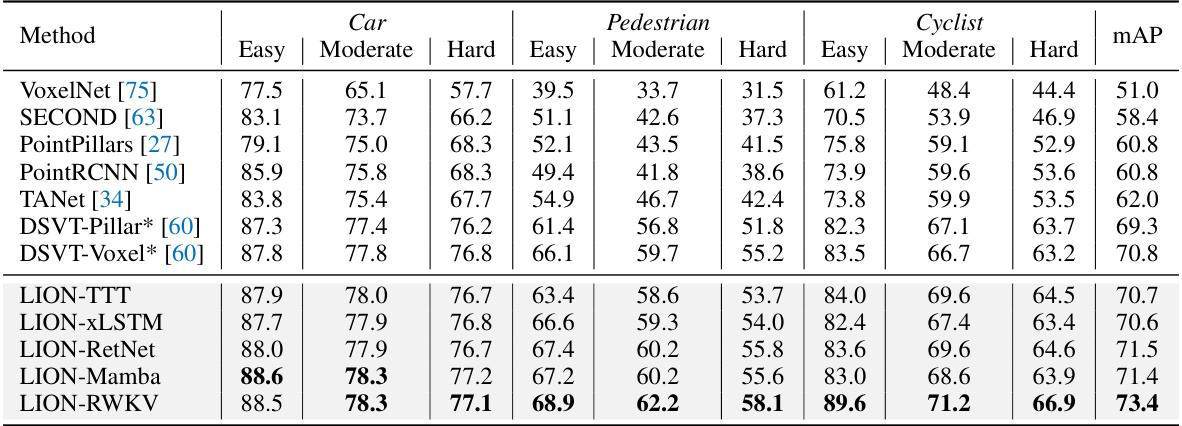
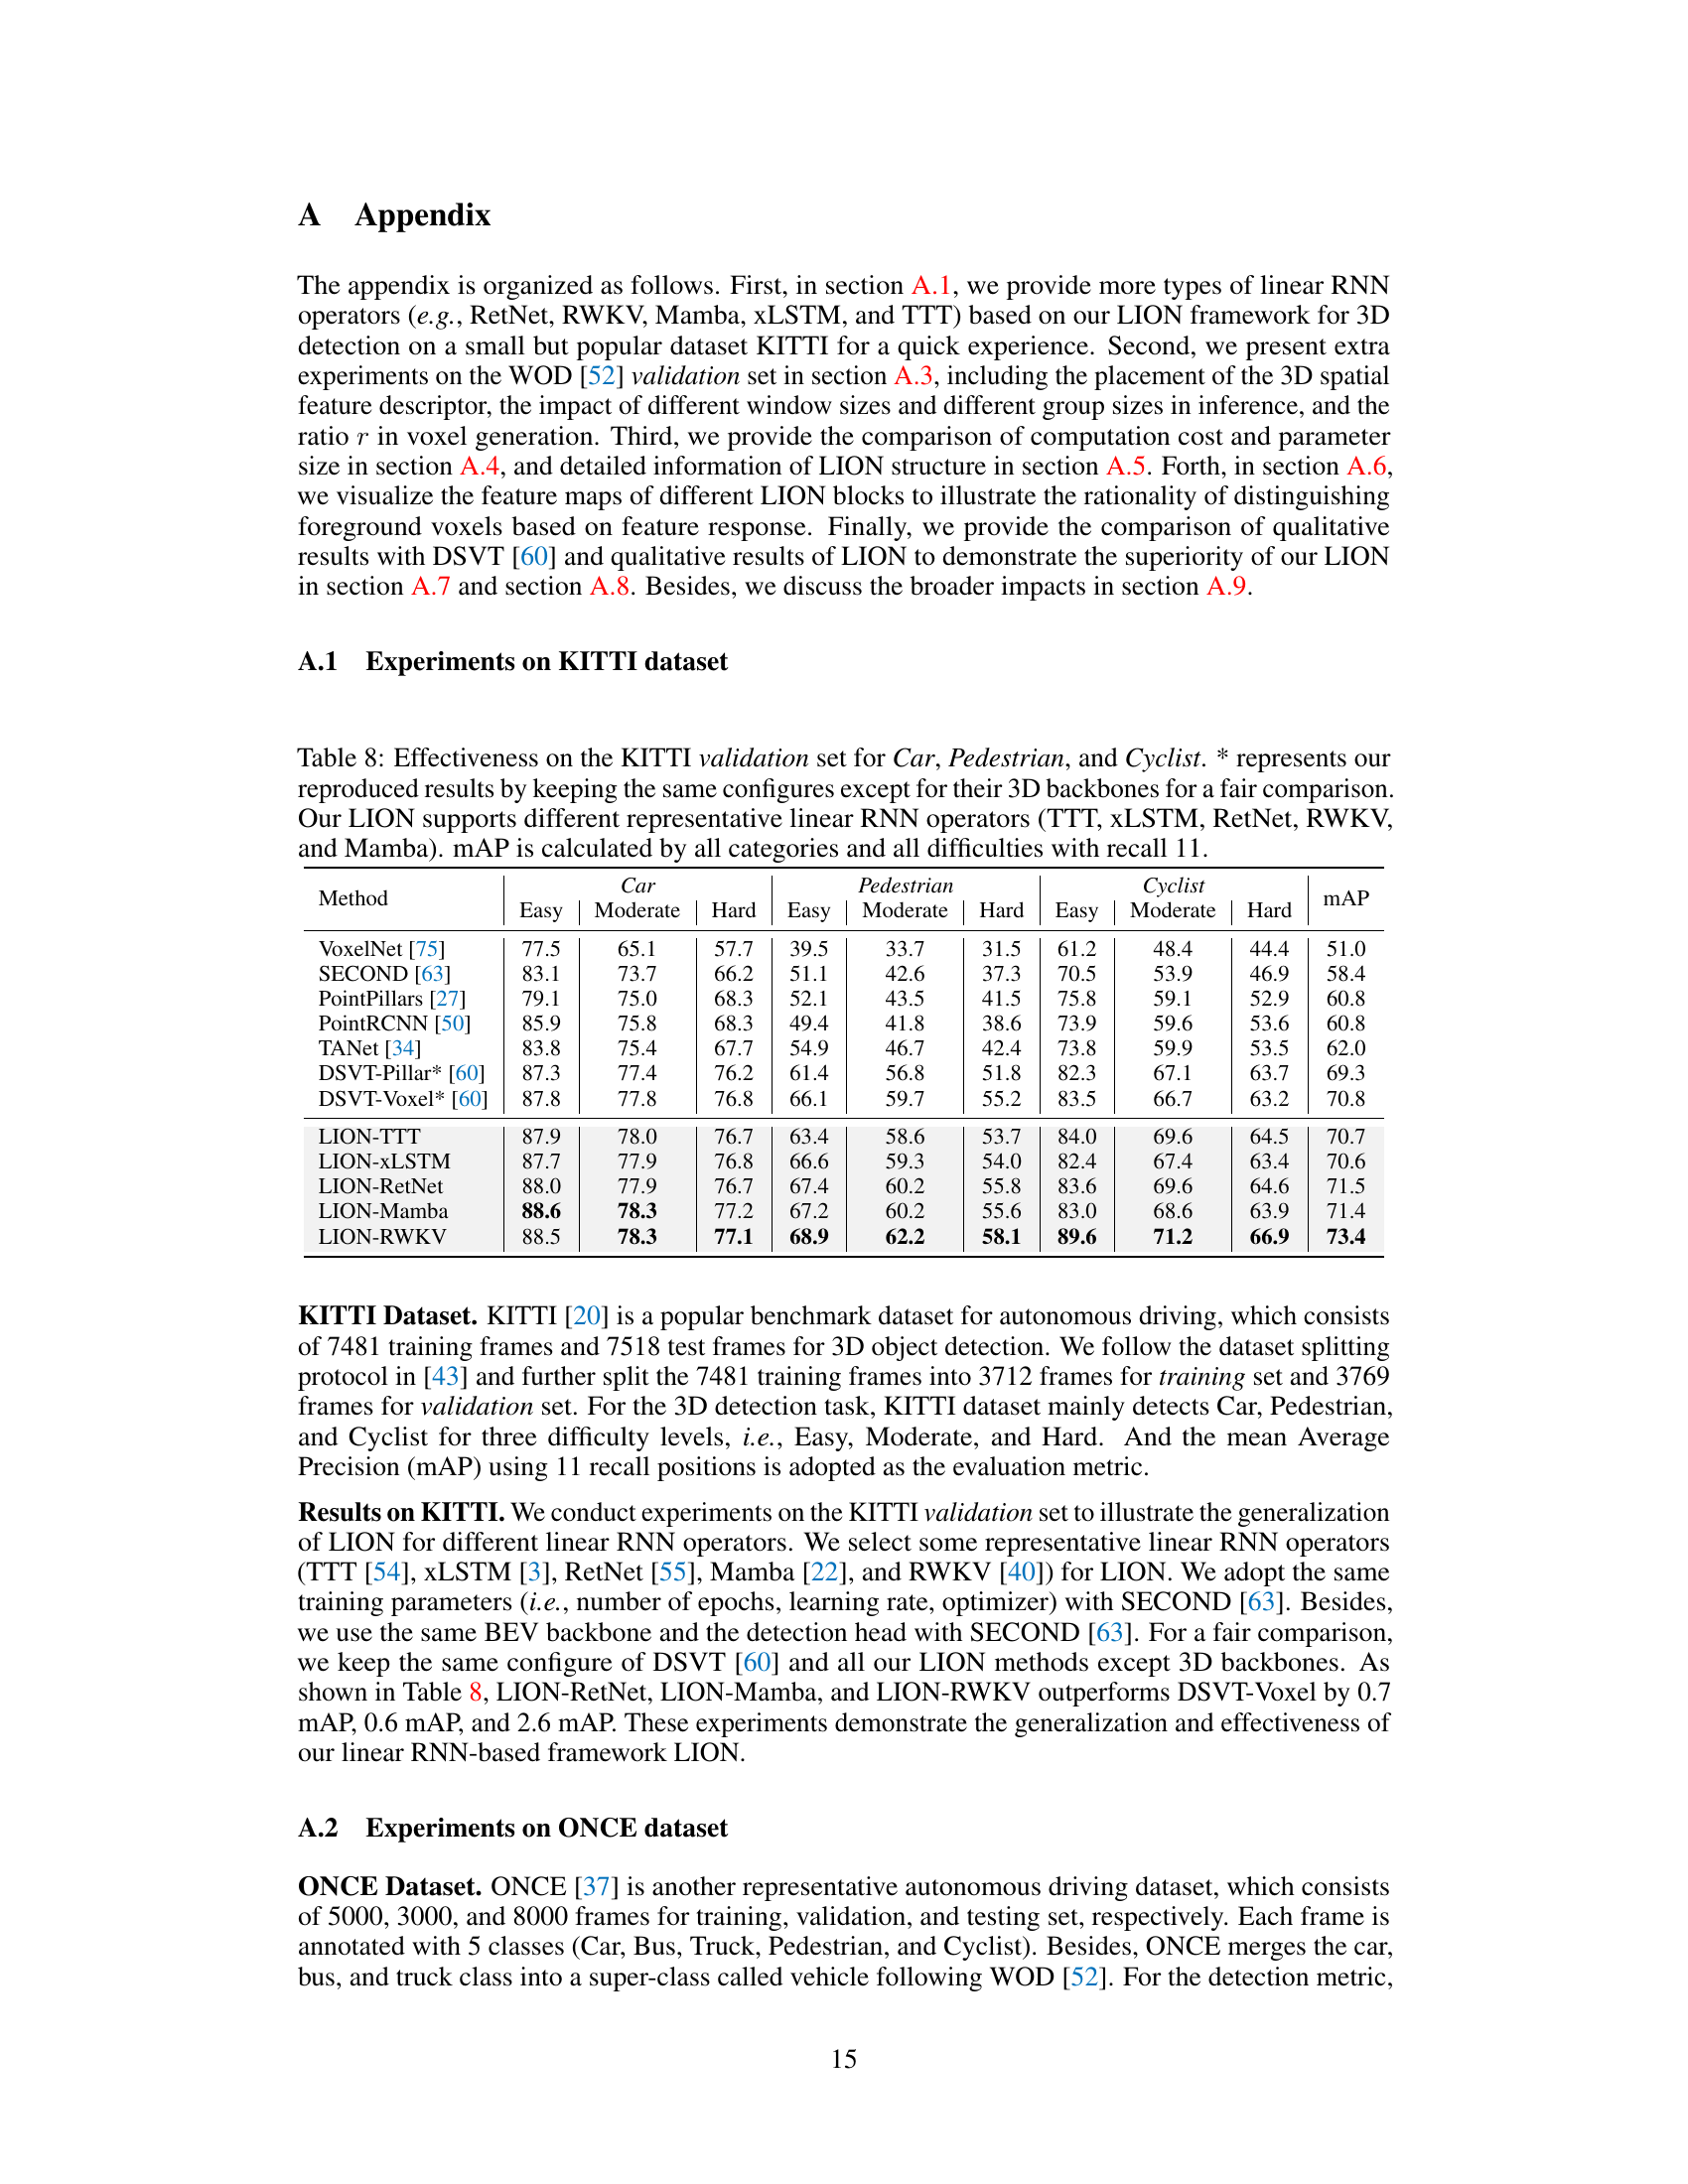
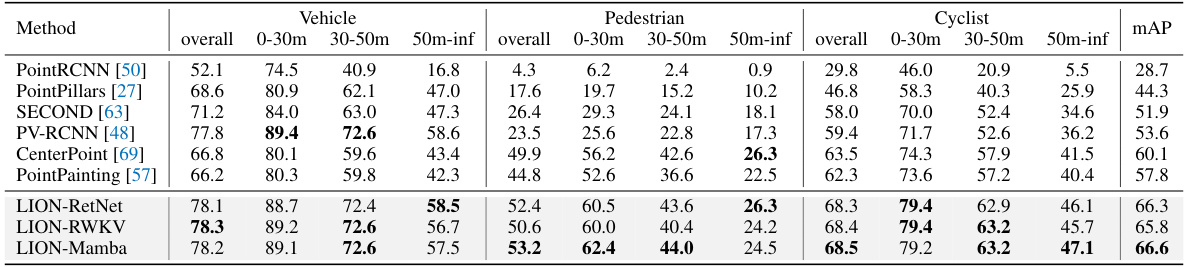
🔼 This table presents the performance comparison of different methods on the KITTI validation dataset for 3D object detection. It includes results for three classes: Car, Pedestrian, and Cyclist, with three difficulty levels each: Easy, Moderate, and Hard. The methods compared include various baselines and the proposed LION model using different linear RNN operators (TTT, xLSTM, RetNet, RWKV, and Mamba). The mAP is calculated considering all categories and difficulties, with a recall threshold of 11.
read the caption
Table 8: Effectiveness on the KITTI validation set for Car, Pedestrian, and Cyclist. * represents our reproduced results by keeping the same configures except for their 3D backbones for a fair comparison. Our LION supports different representative linear RNN operators (TTT, xLSTM, RetNet, RWKV, and Mamba). mAP is calculated by all categories and all difficulties with recall 11.
🔼 This table presents a comparison of the performance of various 3D object detection methods on the Waymo Open Dataset validation set. The methods are categorized by the type of backbone used (Transformer or Linear RNN) and include several variations of the LION method proposed in the paper. Performance metrics shown are 3D Average Precision (AP) and Average Precision weighted by heading accuracy (APH) for vehicles, pedestrians and cyclists, at levels of difficulty L1 and L2. The results highlight the performance of the LION framework across multiple variants and in comparison with state-of-the-art methods.
read the caption
Table 1: Performances on the Waymo Open Dataset validation set (train with 100% training data). ‡ denotes the two-stage method. Bold denotes the best performance of all methods. '-L' means we double the dimension of channels in LION 3D backbone. RNN denotes the linear RNN operator. All results are presented with single-frame input, no test-time augmentation, and no model ensembling.
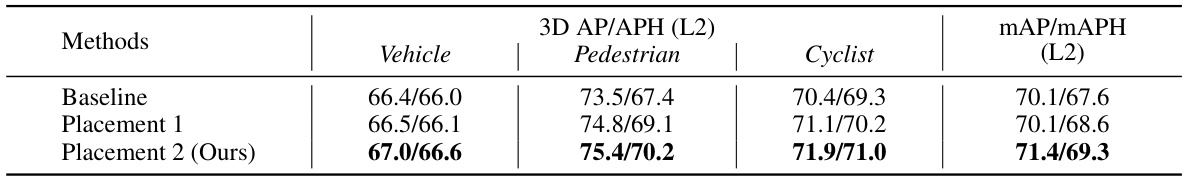
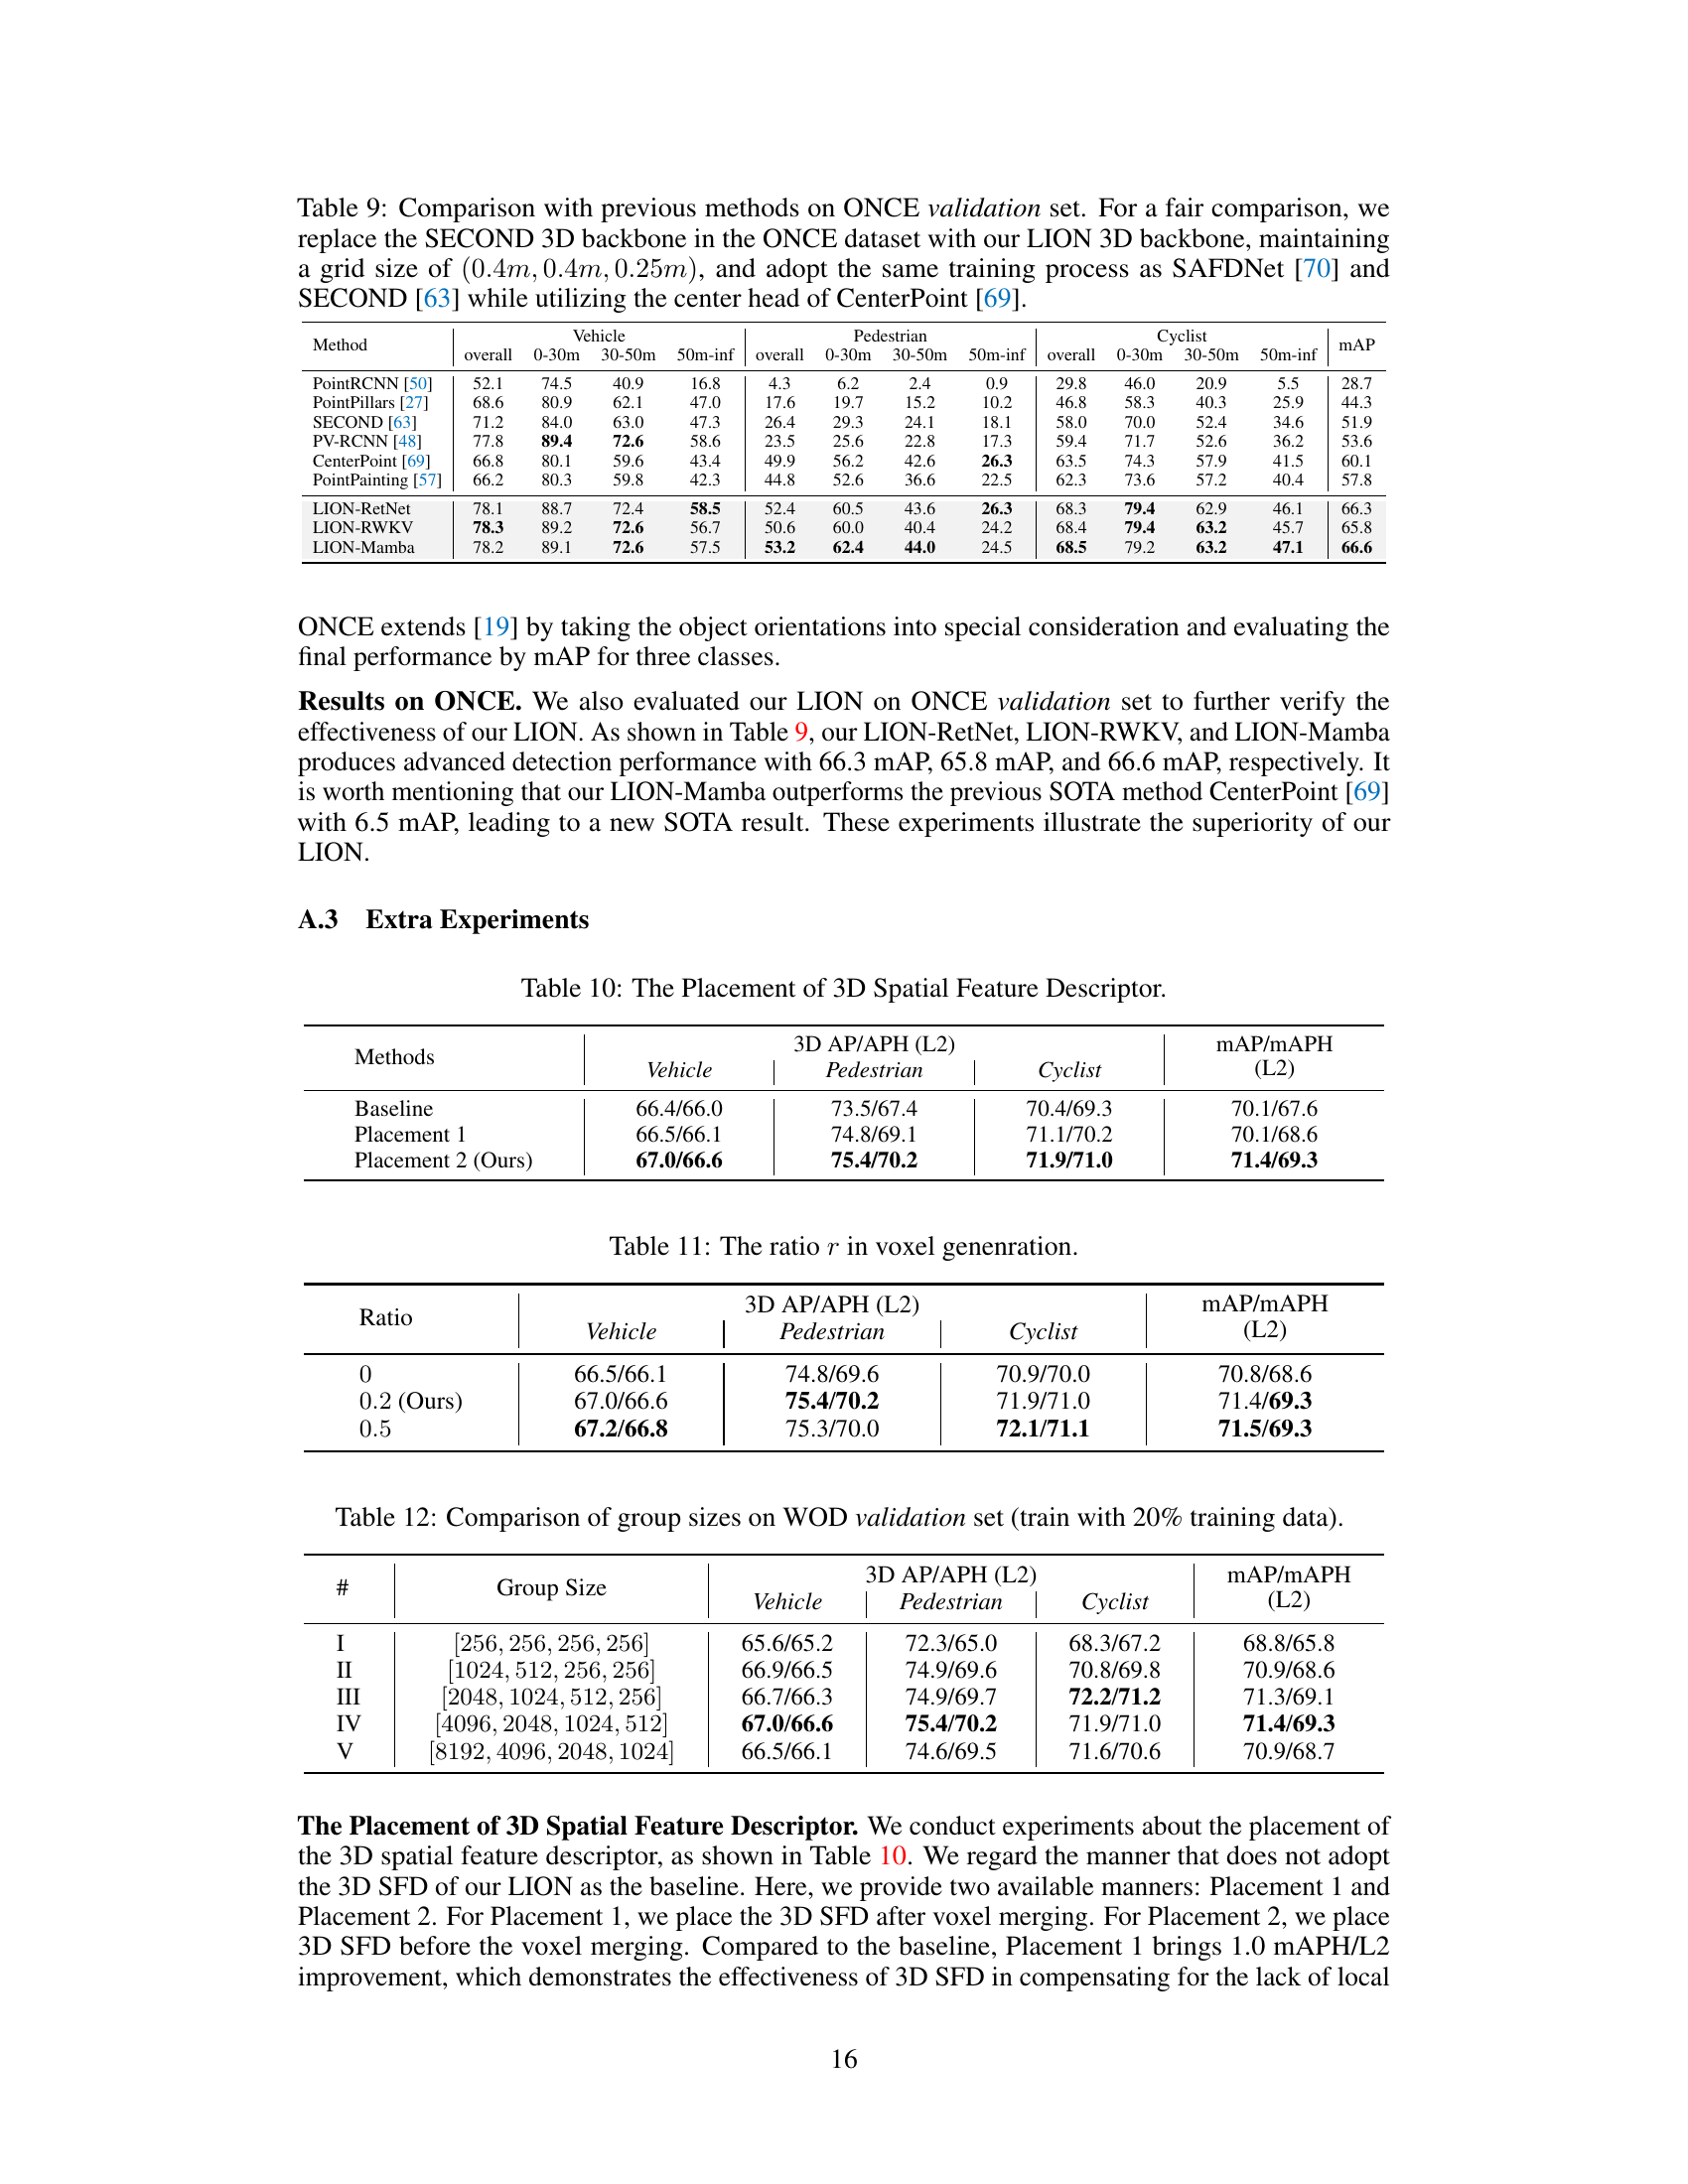
🔼 This table presents the ablation study on the placement of the 3D spatial feature descriptor. Three placements are compared: Baseline (no 3D spatial feature descriptor), Placement 1 (3D spatial feature descriptor placed after voxel merging), and Placement 2 (3D spatial feature descriptor placed before voxel merging). The results (3D AP/APH (L2) and mAP/mAPH (L2)) for Vehicle, Pedestrian, Cyclist, and overall are shown for each placement to demonstrate the impact of the descriptor placement on the model’s performance.
read the caption
Table 10: The Placement of 3D Spatial Feature Descriptor.
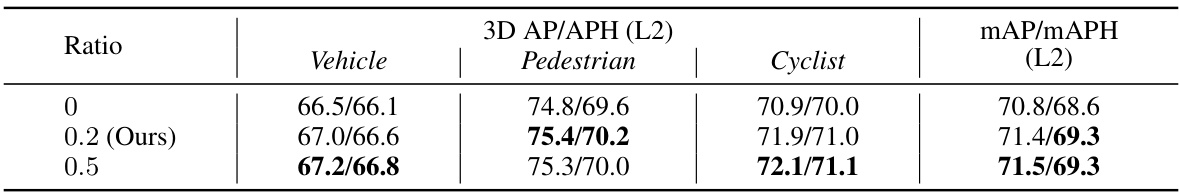
🔼 This table presents the ablation study result on the effect of the ratio of foreground selection in voxel generation. The ratio (r) determines the number of foreground voxels selected for feature enhancement. The results show that a ratio of 0.2 yields the best balance between performance and computational cost.
read the caption
Table 11: The ratio r in voxel generation.
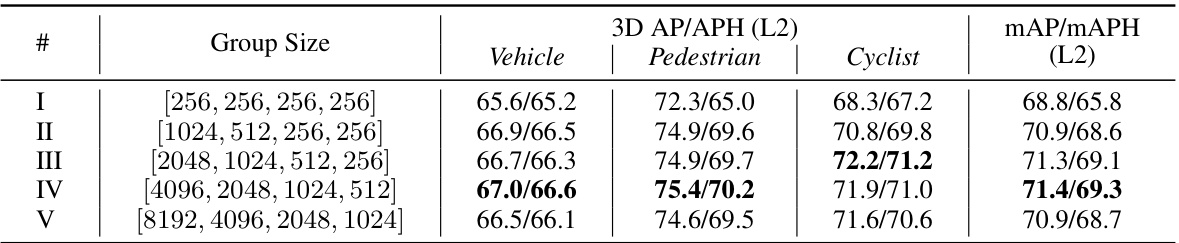
🔼 This table presents an ablation study on the effect of different group sizes on the performance of the LION model. It shows the 3D AP/APH (L2) and mAP/mAPH (L2) for vehicle, pedestrian, and cyclist classes for five different group size configurations. The results help determine the optimal group size for balancing performance and computational efficiency.
read the caption
Table 12: Comparison of group sizes on WOD validation set (train with 20% training data).
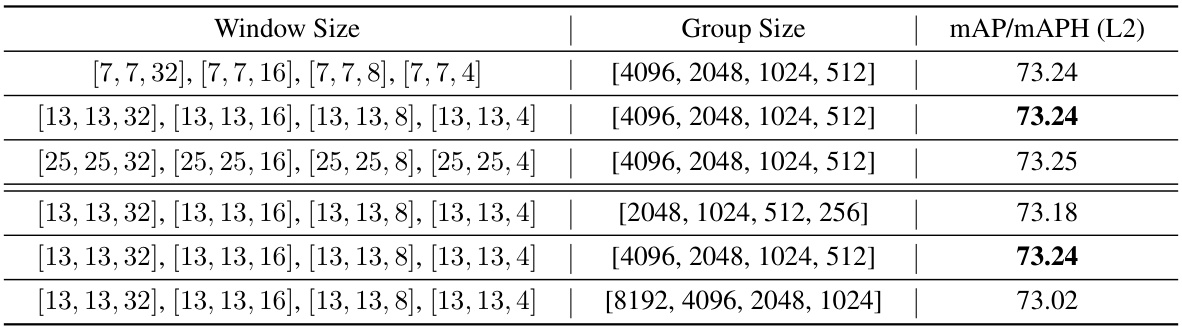
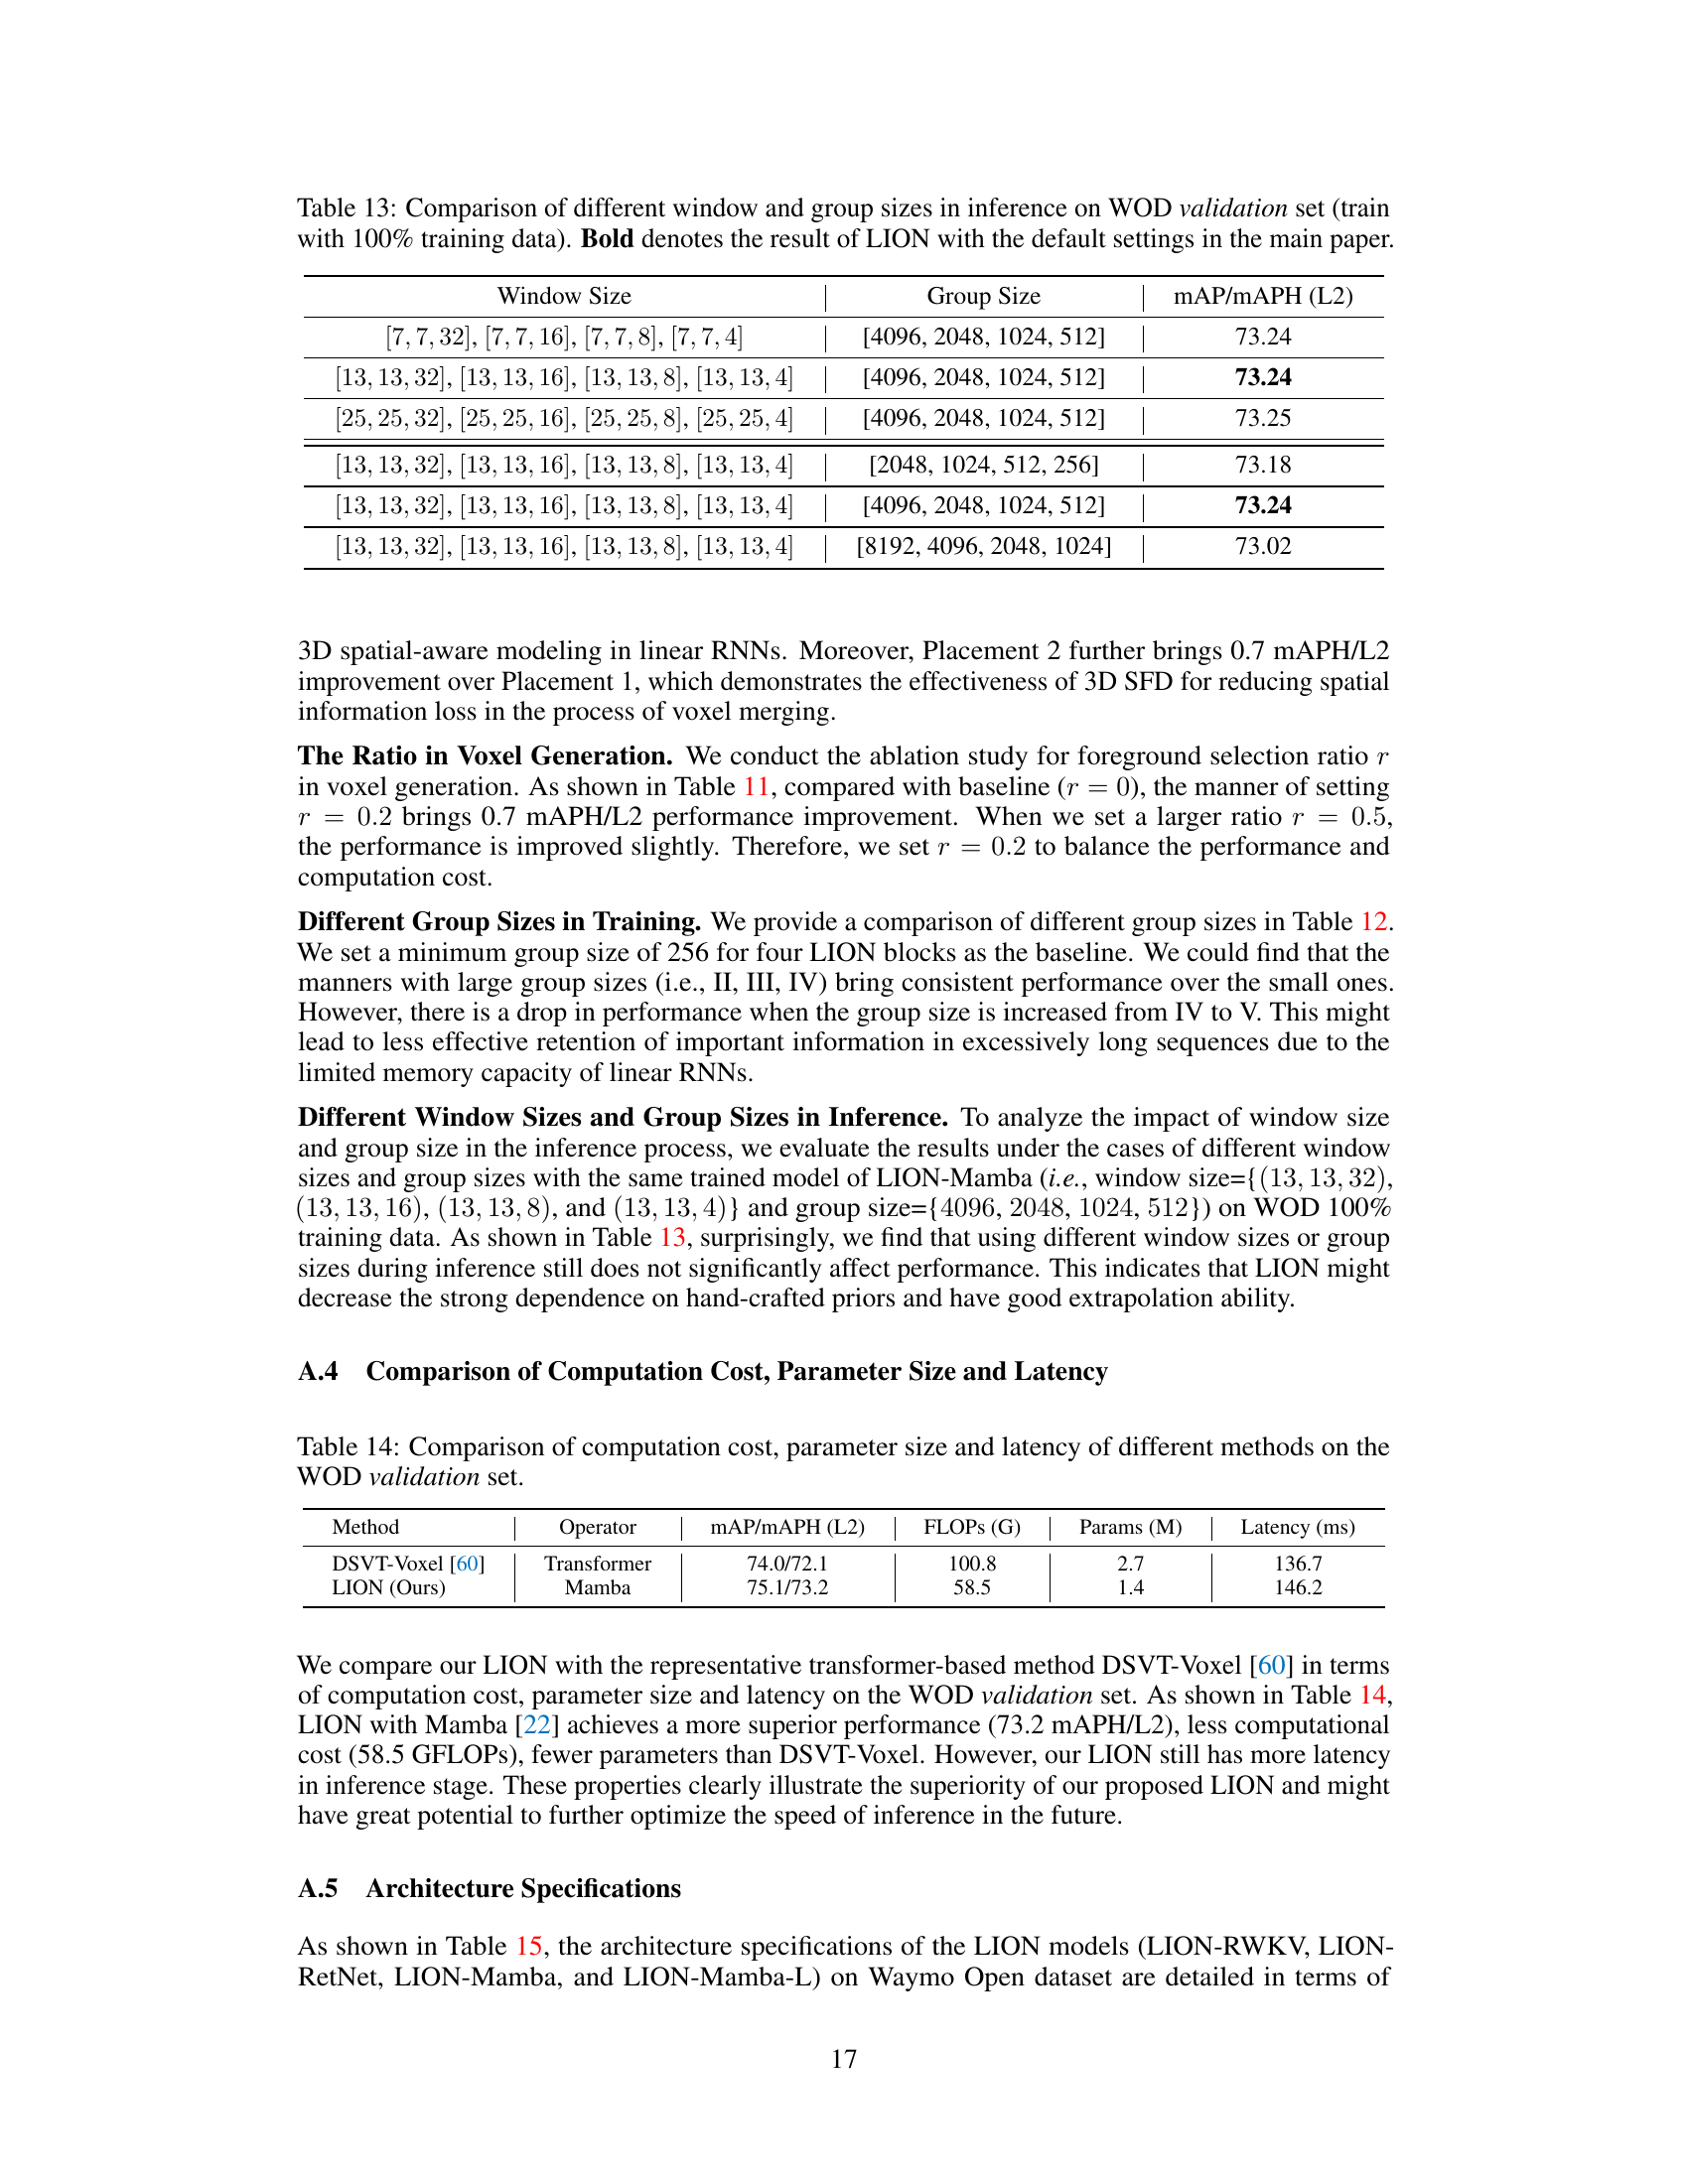
🔼 This table presents an ablation study on the impact of different window sizes and group sizes on the performance of the LION model during inference. It shows how varying these parameters affects the model’s mAP/mAPH (L2) score on the Waymo Open Dataset (WOD). The results indicate the robustness of LION to changes in these hyperparameters.
read the caption
Table 13: Comparison of different window and group sizes in inference on WOD validation set (train with 100% training data). Bold denotes the result of LION with the default settings in the main paper.

🔼 This table compares the computation cost (in GFLOPs), the number of parameters (in millions), and the inference latency (in milliseconds) of the proposed LION method against the DSVT-Voxel method on the Waymo Open Dataset validation set. It highlights the improved efficiency of LION in terms of FLOPS and parameters, while noting a slightly increased latency compared to DSVT-Voxel.
read the caption
Table 14: Comparison of computation cost, parameter size and latency of different methods on the WOD validation set.
🔼 This table presents a comparison of the proposed LION model’s performance against various state-of-the-art 3D object detection methods on the Waymo Open Dataset validation set. The comparison includes metrics for vehicle, pedestrian, and cyclist detection at different difficulty levels (L1 and L2). The table highlights the LION model’s superior performance and its generalization across different linear RNN operators (Mamba, RWKV, and RetNet). Note that all results are obtained using a single frame without test-time augmentation or model ensembling to ensure fair comparison.
read the caption
Table 1: Performances on the Waymo Open Dataset validation set (train with 100% training data). ‡ denotes the two-stage method. Bold denotes the best performance of all methods. '-L' means we double the dimension of channels in LION 3D backbone. RNN denotes the linear RNN operator. All results are presented with single-frame input, no test-time augmentation, and no model ensembling.
Full paper#