TL;DR#
Human-aligned AI is a key goal in AI research, aiming to create AI systems that think and learn like humans. However, evaluating how well AI models generalize to real-world scenarios, similar to how humans do, is challenging. Existing methods often rely on simple, artificial tasks that don’t fully capture the complexity of human cognition.
This research tackles this problem by using two naturalistic image-based learning tasks—category learning and reward learning—and comparing the learning behavior of human participants with 86 pretrained neural network models. They found that models trained with contrastive language-image pretraining (CLIP) performed exceptionally well in predicting human choices and highlighted several factors correlated with better alignment, including model size, training data, and intrinsic dimensionality. While human-aligned models didn’t consistently outperform baselines, it is still shown that pretrained models extract useful cognitive representations transferrable across tasks.
Key Takeaways#
Why does it matter?#
This paper is crucial for AI researchers striving for human-aligned AI. It introduces novel learning paradigms with naturalistic images, offering a more realistic evaluation of model generalization. The findings highlight the importance of contrastive training with multi-modal data and reveal interesting relationships between model properties, such as size and intrinsic dimensionality, and their alignment with human learning behaviors. This work paves the way for developing more robust and human-like AI systems. This opens up new avenues for future research in improving model interpretability and generalization.
Visual Insights#
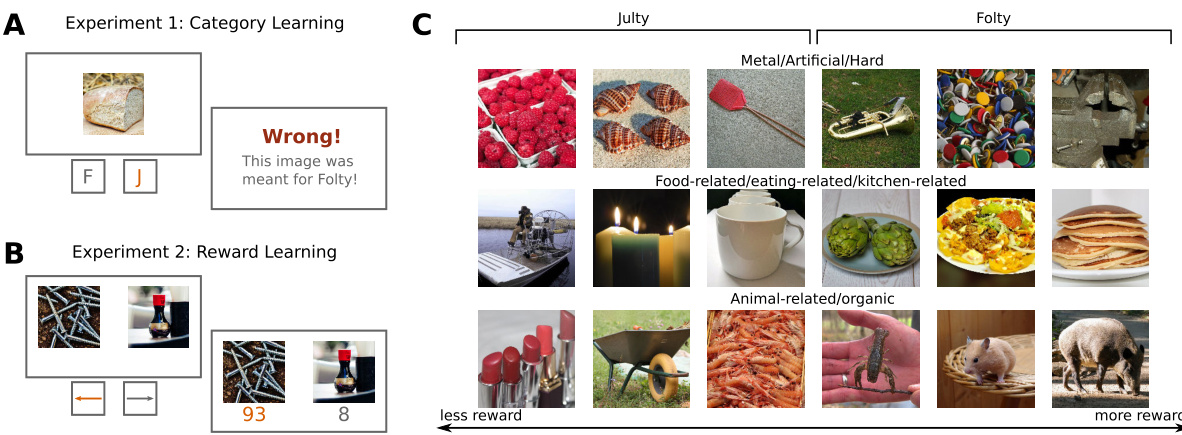
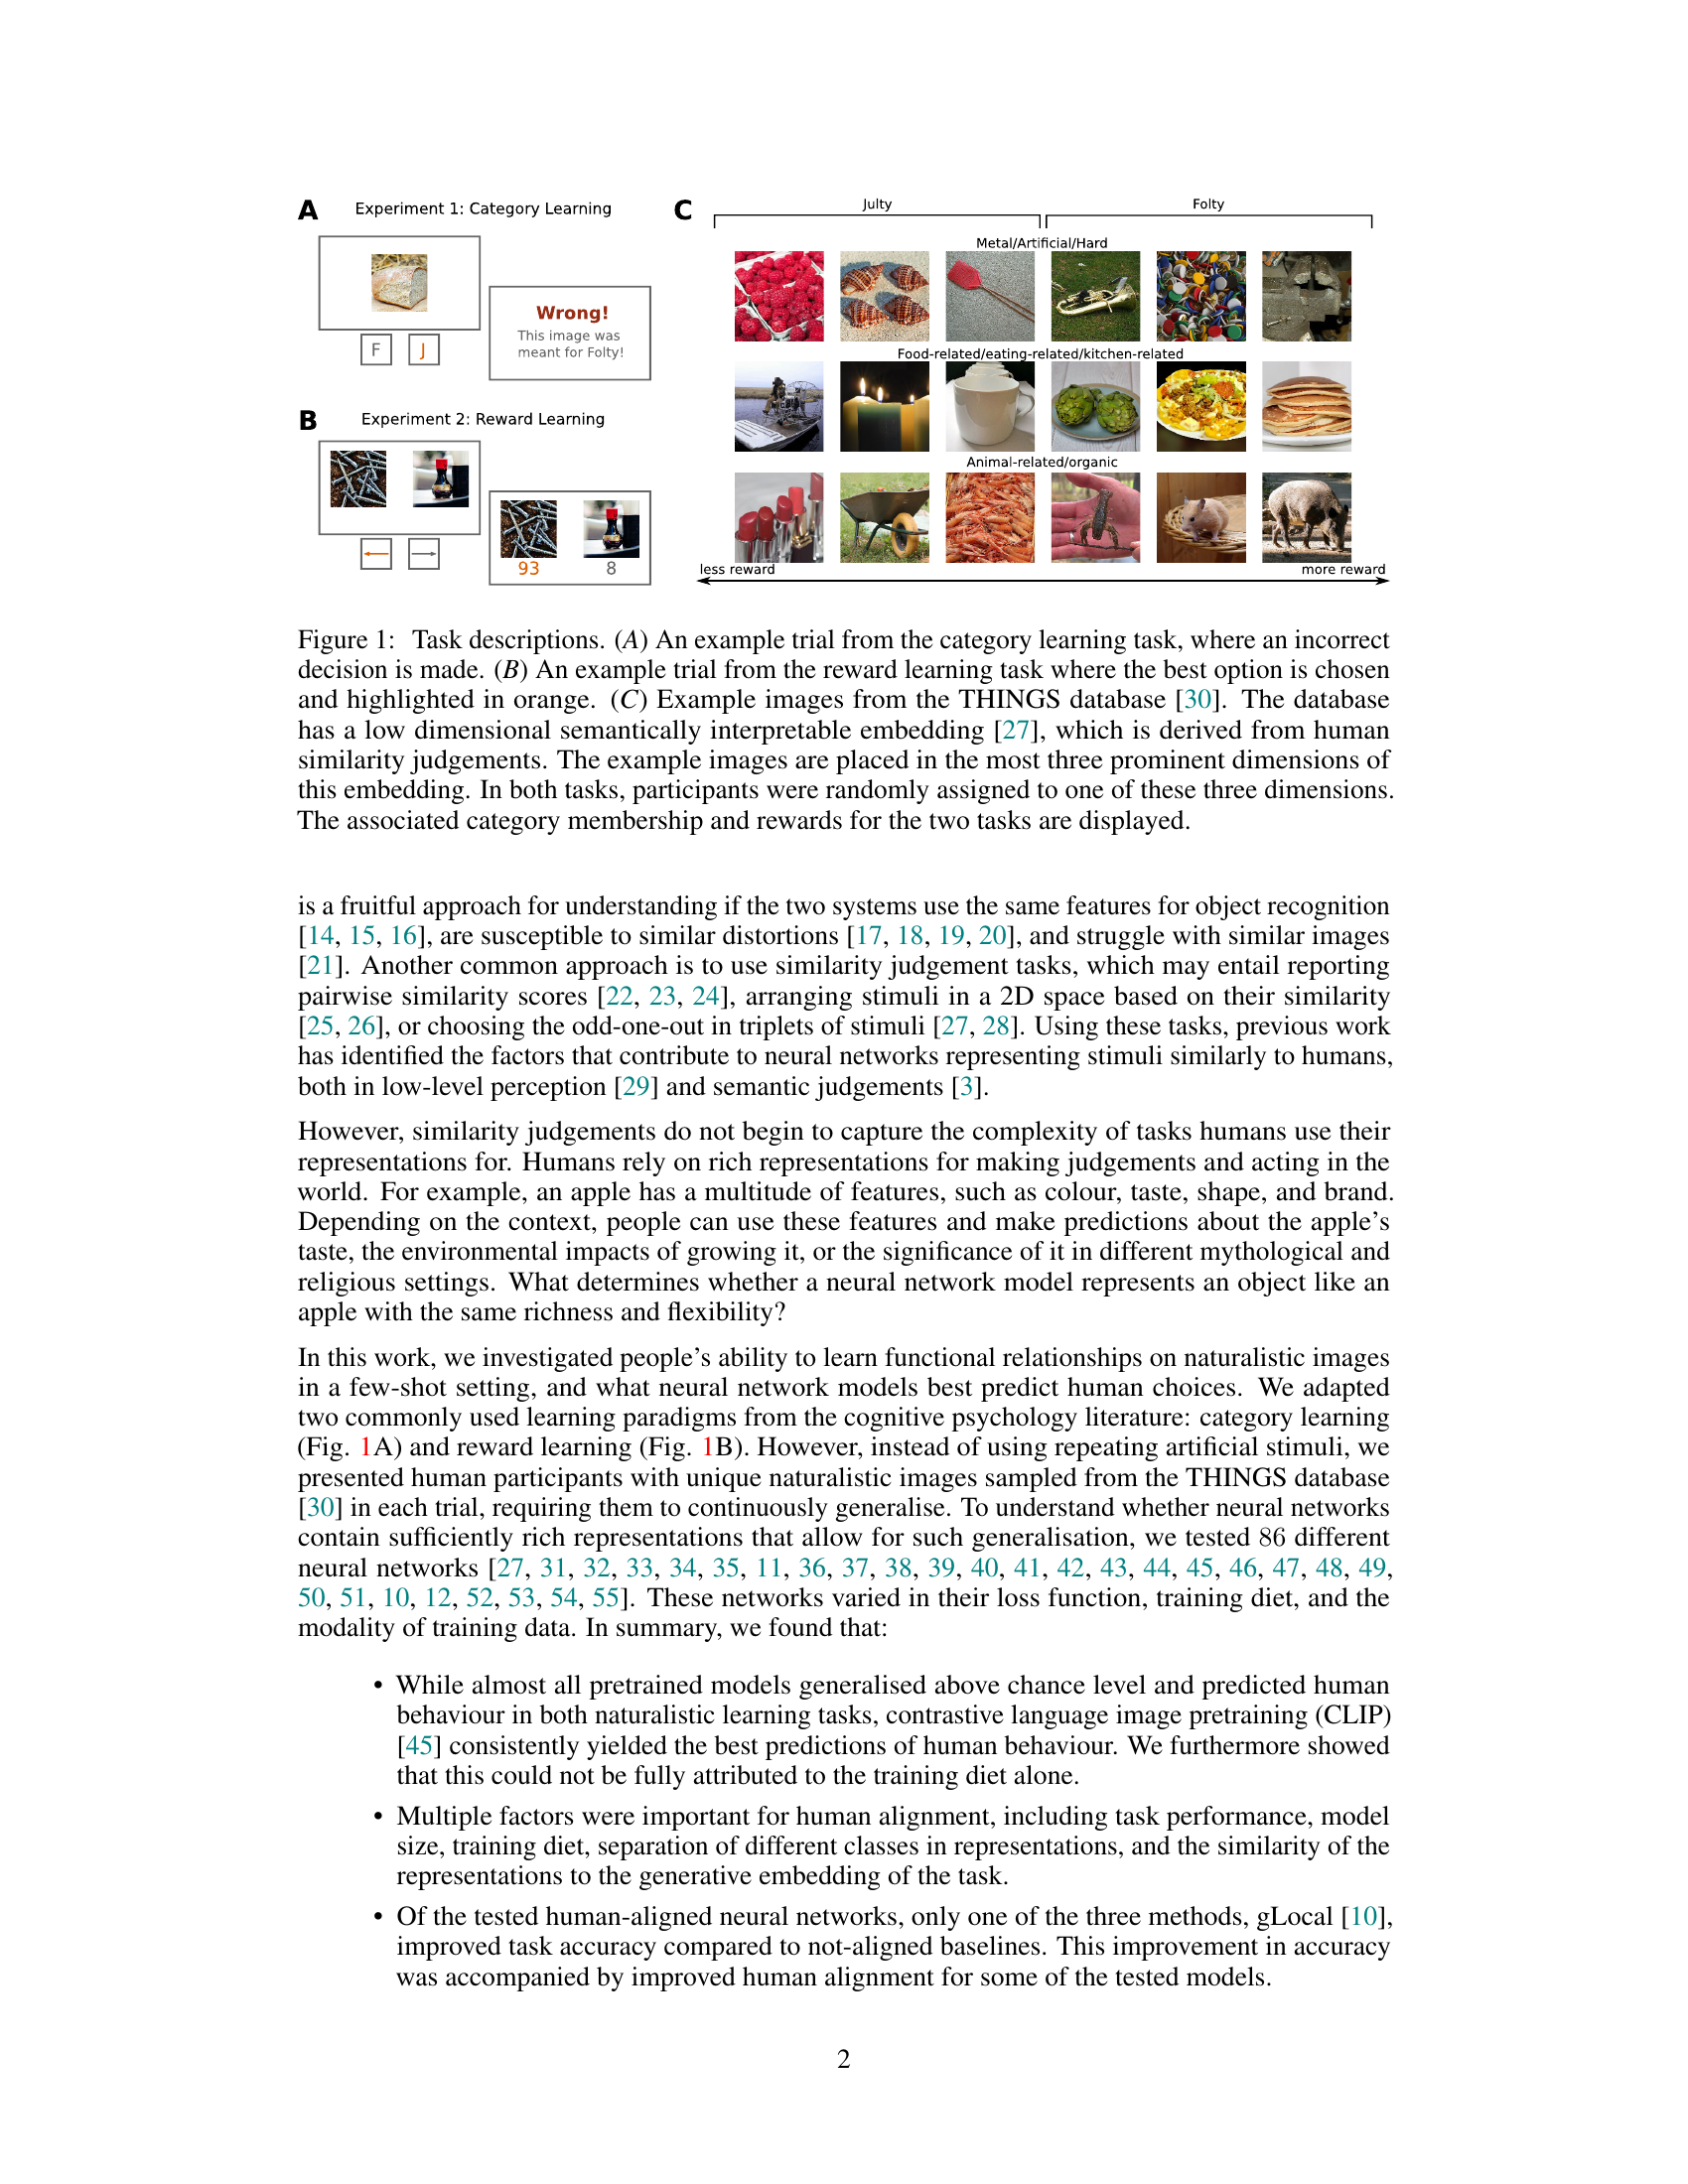
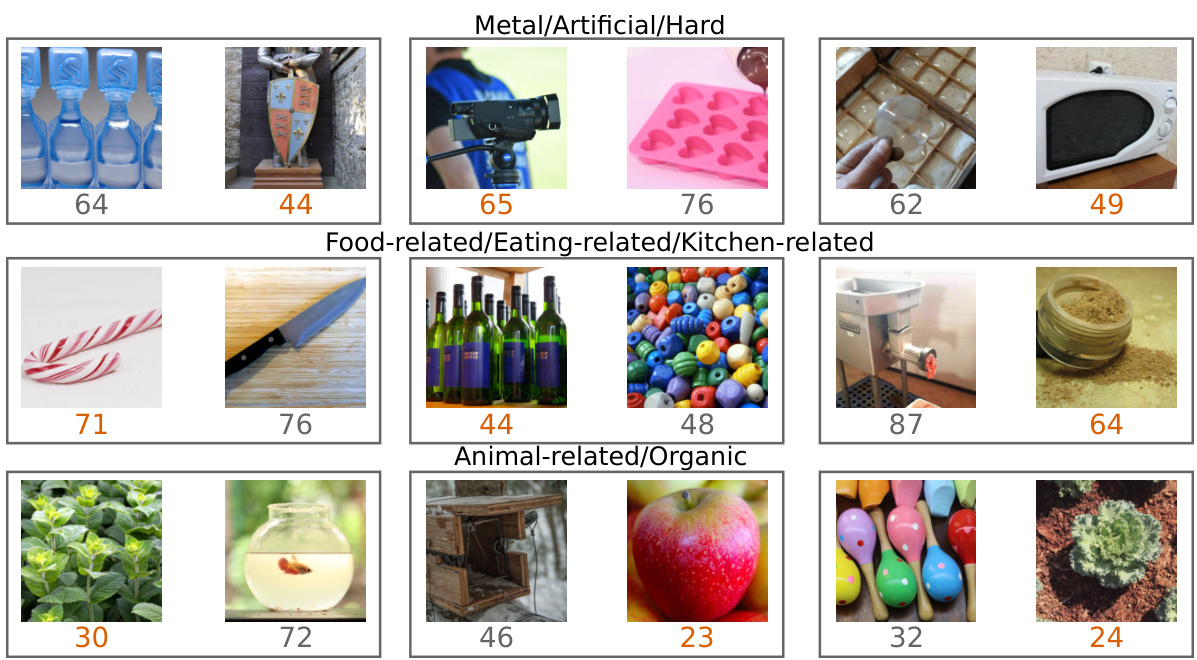
🔼 This figure illustrates the two experimental tasks used in the study: category learning and reward learning. Panel A shows a sample trial from the category learning task, where participants had to assign images to one of two categories represented by dinosaurs. Panel B shows a sample trial from the reward learning task where participants select the image associated with the higher reward. Panel C displays example images from the THINGS database, showing how images are categorized along three main dimensions (metal/artificial/hard, food-related, animal-related/organic) based on human similarity judgments. These dimensions were used to define the category boundaries in the category learning task and the reward scale in the reward learning task.
read the caption
Figure 1: Task descriptions. (A) An example trial from the category learning task, where an incorrect decision is made. (B) An example trial from the reward learning task where the best option is chosen and highlighted in orange. (C) Example images from the THINGS database [30]. The database has a low dimensional semantically interpretable embedding [27], which is derived from human similarity judgements. The example images are placed in the most three prominent dimensions of this embedding. In both tasks, participants were randomly assigned to one of these three dimensions. The associated category membership and rewards for the two tasks are displayed.
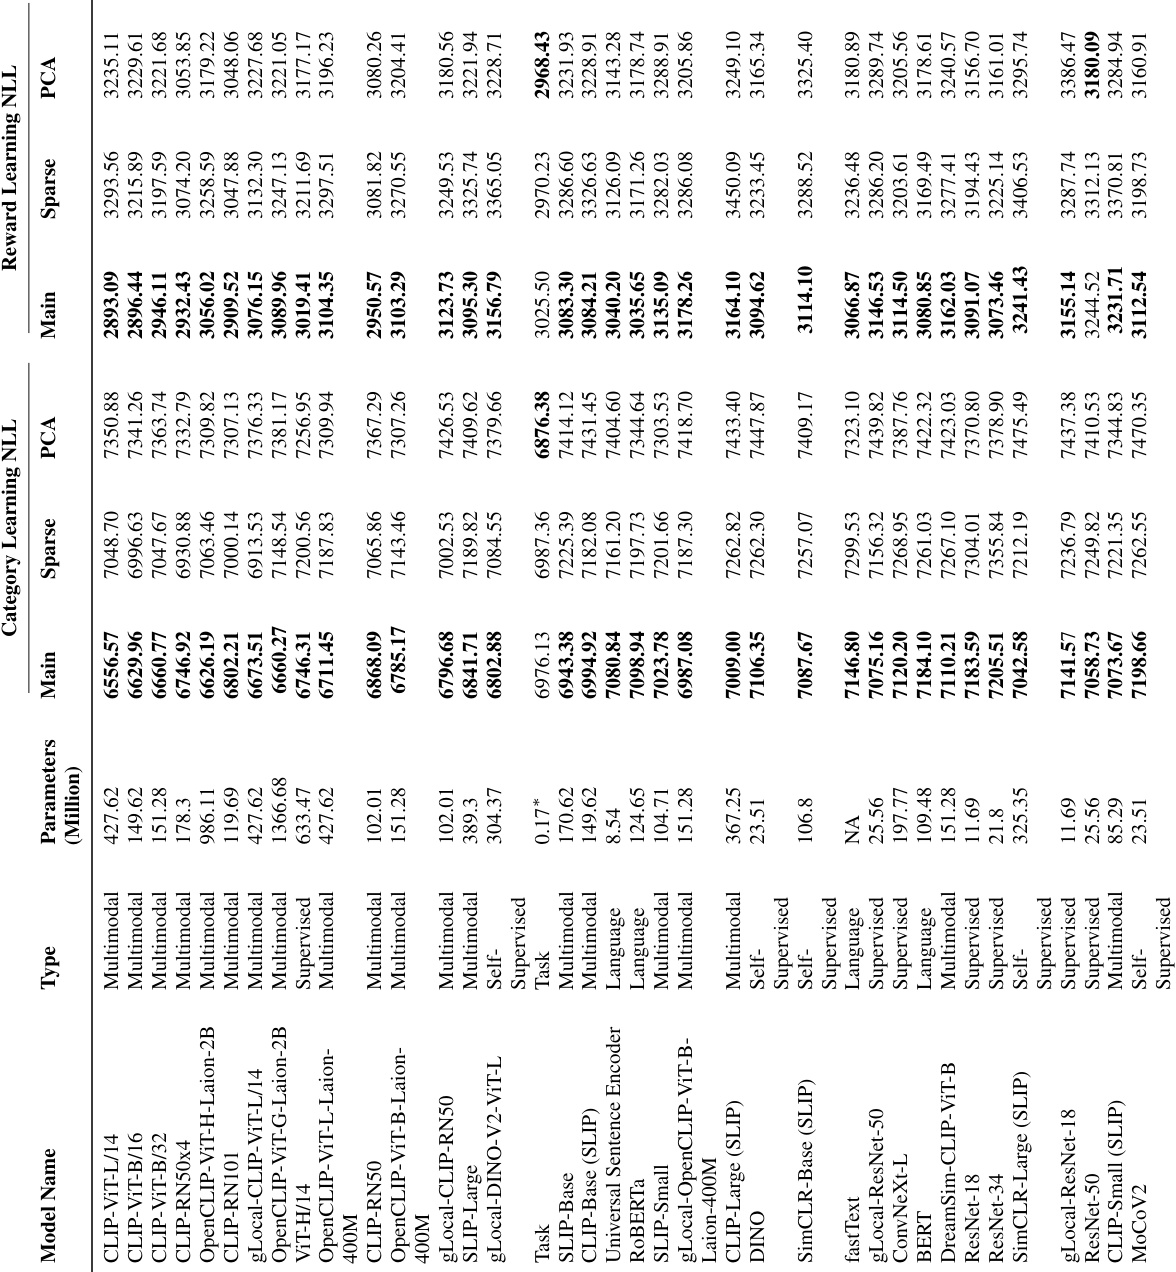
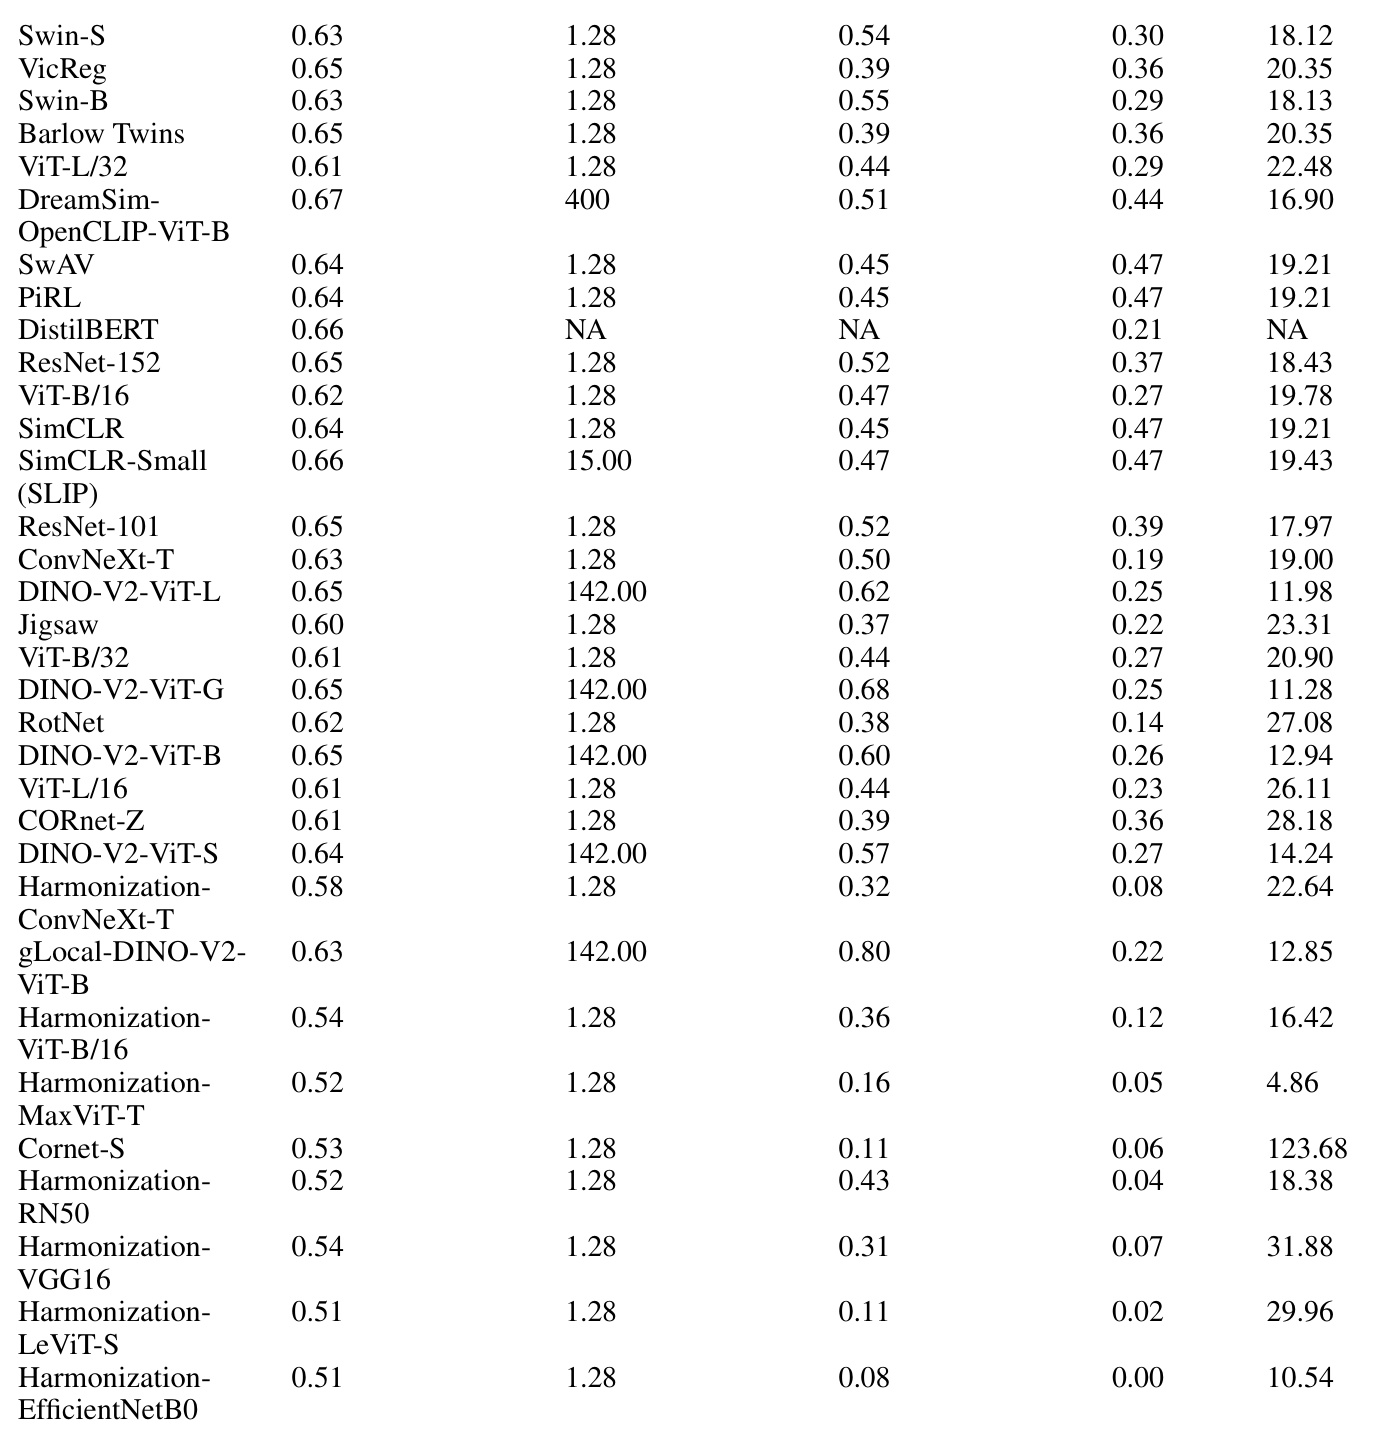
🔼 This table presents detailed information on 86 pretrained neural network models used in the study. For each model, it lists its type (e.g., supervised, self-supervised, multimodal), the number of parameters in millions, and the negative log-likelihood (NLL) scores achieved in two tasks: category learning and reward learning. The NLL is a measure of how well the model’s representations fit the human choices in each task. Lower NLL indicates better fit to human data. The table is crucial for comparing the performance of different models, aiding in the analysis of factors contributing to alignment between human and model representation.
read the caption
Table 1: Details on Models and Model Performance. Here, we report the model size, the type, and the negative log-likelihoods (NLL) for different tasks and different learning models. For a given representation and task, the best-performing learning model’s NLL is highlighted in bold. The models are ordered such that the ones reported higher have lower negative log likelihoods across the two asks, as measured through the performance of the linear models reported in the main text.
In-depth insights#
Human-Model Align.#
The heading ‘Human-Model Align.’ suggests an investigation into the correspondence between human cognitive processes and the behavior of computational models. A core aspect would likely involve measuring how well a model’s internal representations and outputs match human performance and choices on specific tasks. Key considerations might include the choice of tasks (simple vs. complex, naturalistic vs. artificial), the metrics used to quantify alignment (e.g., correlation, classification accuracy, representational similarity analysis), and the types of models considered (e.g., deep learning architectures, symbolic models). A deeper analysis would likely address what factors in model architecture, training data, and learning algorithms influence human-model alignment. The study might explore the implications of alignment for enhancing model interpretability, generalizability, and robustness and how these findings might inform the development of more human-like AI systems. A significant challenge in human-model alignment research is defining appropriate metrics to fairly and comprehensively evaluate the similarities. Overall, this section would likely present a multifaceted analysis of the quantitative and qualitative aspects of human-model alignment, highlighting both successes and remaining challenges in bridging the gap between human cognition and AI.
CLIP’s Superiority#
The research highlights CLIP’s consistent top performance across various image-based learning tasks, surpassing other neural network models. This superiority isn’t solely attributed to the scale of CLIP’s training data, as analyses controlling for dataset size still showed CLIP’s advantages. Contrastive language-image pretraining seems key, unlocking desirable scaling properties. While larger models generally perform better, CLIP’s success suggests that the training methodology is crucial, not just sheer model size. This implies intrinsic properties of CLIP’s representations, such as better separation of image classes and a greater resemblance to human-generated task features, contribute to superior alignment with human choices. Future research should delve into what specific elements of contrastive learning drive CLIP’s human alignment to advance understanding and improve AI model design.
Task Design#
Effective task design is crucial for aligning human and neural network representations. The choice to use naturalistic images from the THINGS database, avoiding repetitive stimuli, promotes genuine generalization abilities, mimicking real-world scenarios better than traditional artificial stimuli. The selection of two established cognitive paradigms, category and reward learning, allows for a nuanced assessment of how well models capture various aspects of human learning. The multi-dimensional embedding associated with the THINGS images offers the benefit of providing human interpretable features that can be used to understand what aspects of the image the participants are using to make decisions, and to relate model choices to human choices more effectively. Furthermore, the use of continuous relationships and categories ensures that the evaluation isn’t limited to simple discrimination but considers the richness of human representation, making the findings more robust and generalizable. The design choices made here represent a significant advancement in the field by moving beyond simple similarity judgements towards richer, ecologically valid experimental tasks.
Alignment Factors#
The study investigates factors influencing the alignment of neural network representations with human behavior in image-based learning tasks. Dataset size significantly impacted alignment; larger datasets generally yielded better alignment. Furthermore, the use of contrastive training with multimodal data (text and imagery), particularly evident in CLIP models, was a strong predictor of human-like generalization. Interestingly, the impact of intrinsic dimensionality varied across different model types, suggesting that the way representations are compressed can influence alignment differently depending on training techniques. Finally, human-aligned representations did not consistently improve alignment in these tasks, challenging the assumption that explicitly aligning representations to human judgments necessarily enhances performance on naturalistic learning paradigms. These findings underscore the complex interplay between various factors shaping representational alignment and highlight the importance of considering training methodologies when aiming to build models that generalize in ways that mirror human cognition.
Future Directions#
Future research could explore whether the observed alignment patterns generalize across a wider range of cognitive tasks and learning paradigms beyond those tested. Investigating tasks with more complex rule structures or naturalistic stimuli would provide stronger tests of representational alignment. Furthermore, exploring different methods for quantifying alignment, beyond behavioral measures, such as incorporating neuroimaging data, could provide a more comprehensive understanding of how neural network representations map onto human brain activity. The influence of factors like model size, training data, and intrinsic dimensionality on alignment should be investigated more rigorously, potentially focusing on disentangling the effects of these factors and exploring their interactions. Finally, developing techniques for aligning neural network representations with human representations in a principled manner could further enhance the potential of these models for cognitive science and applications.
More visual insights#
More on figures
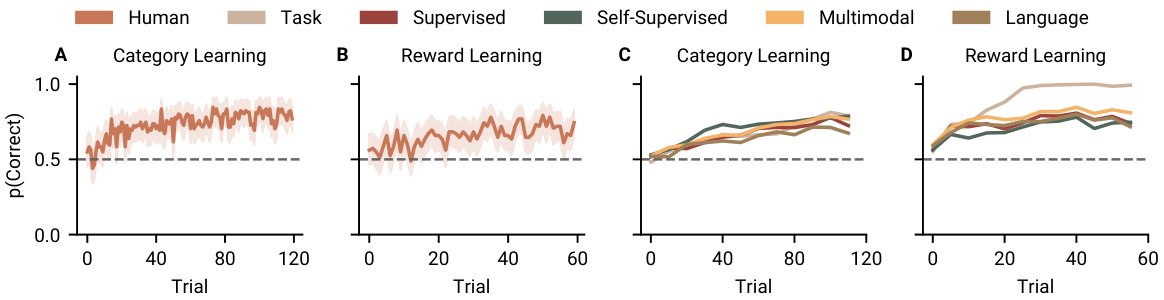
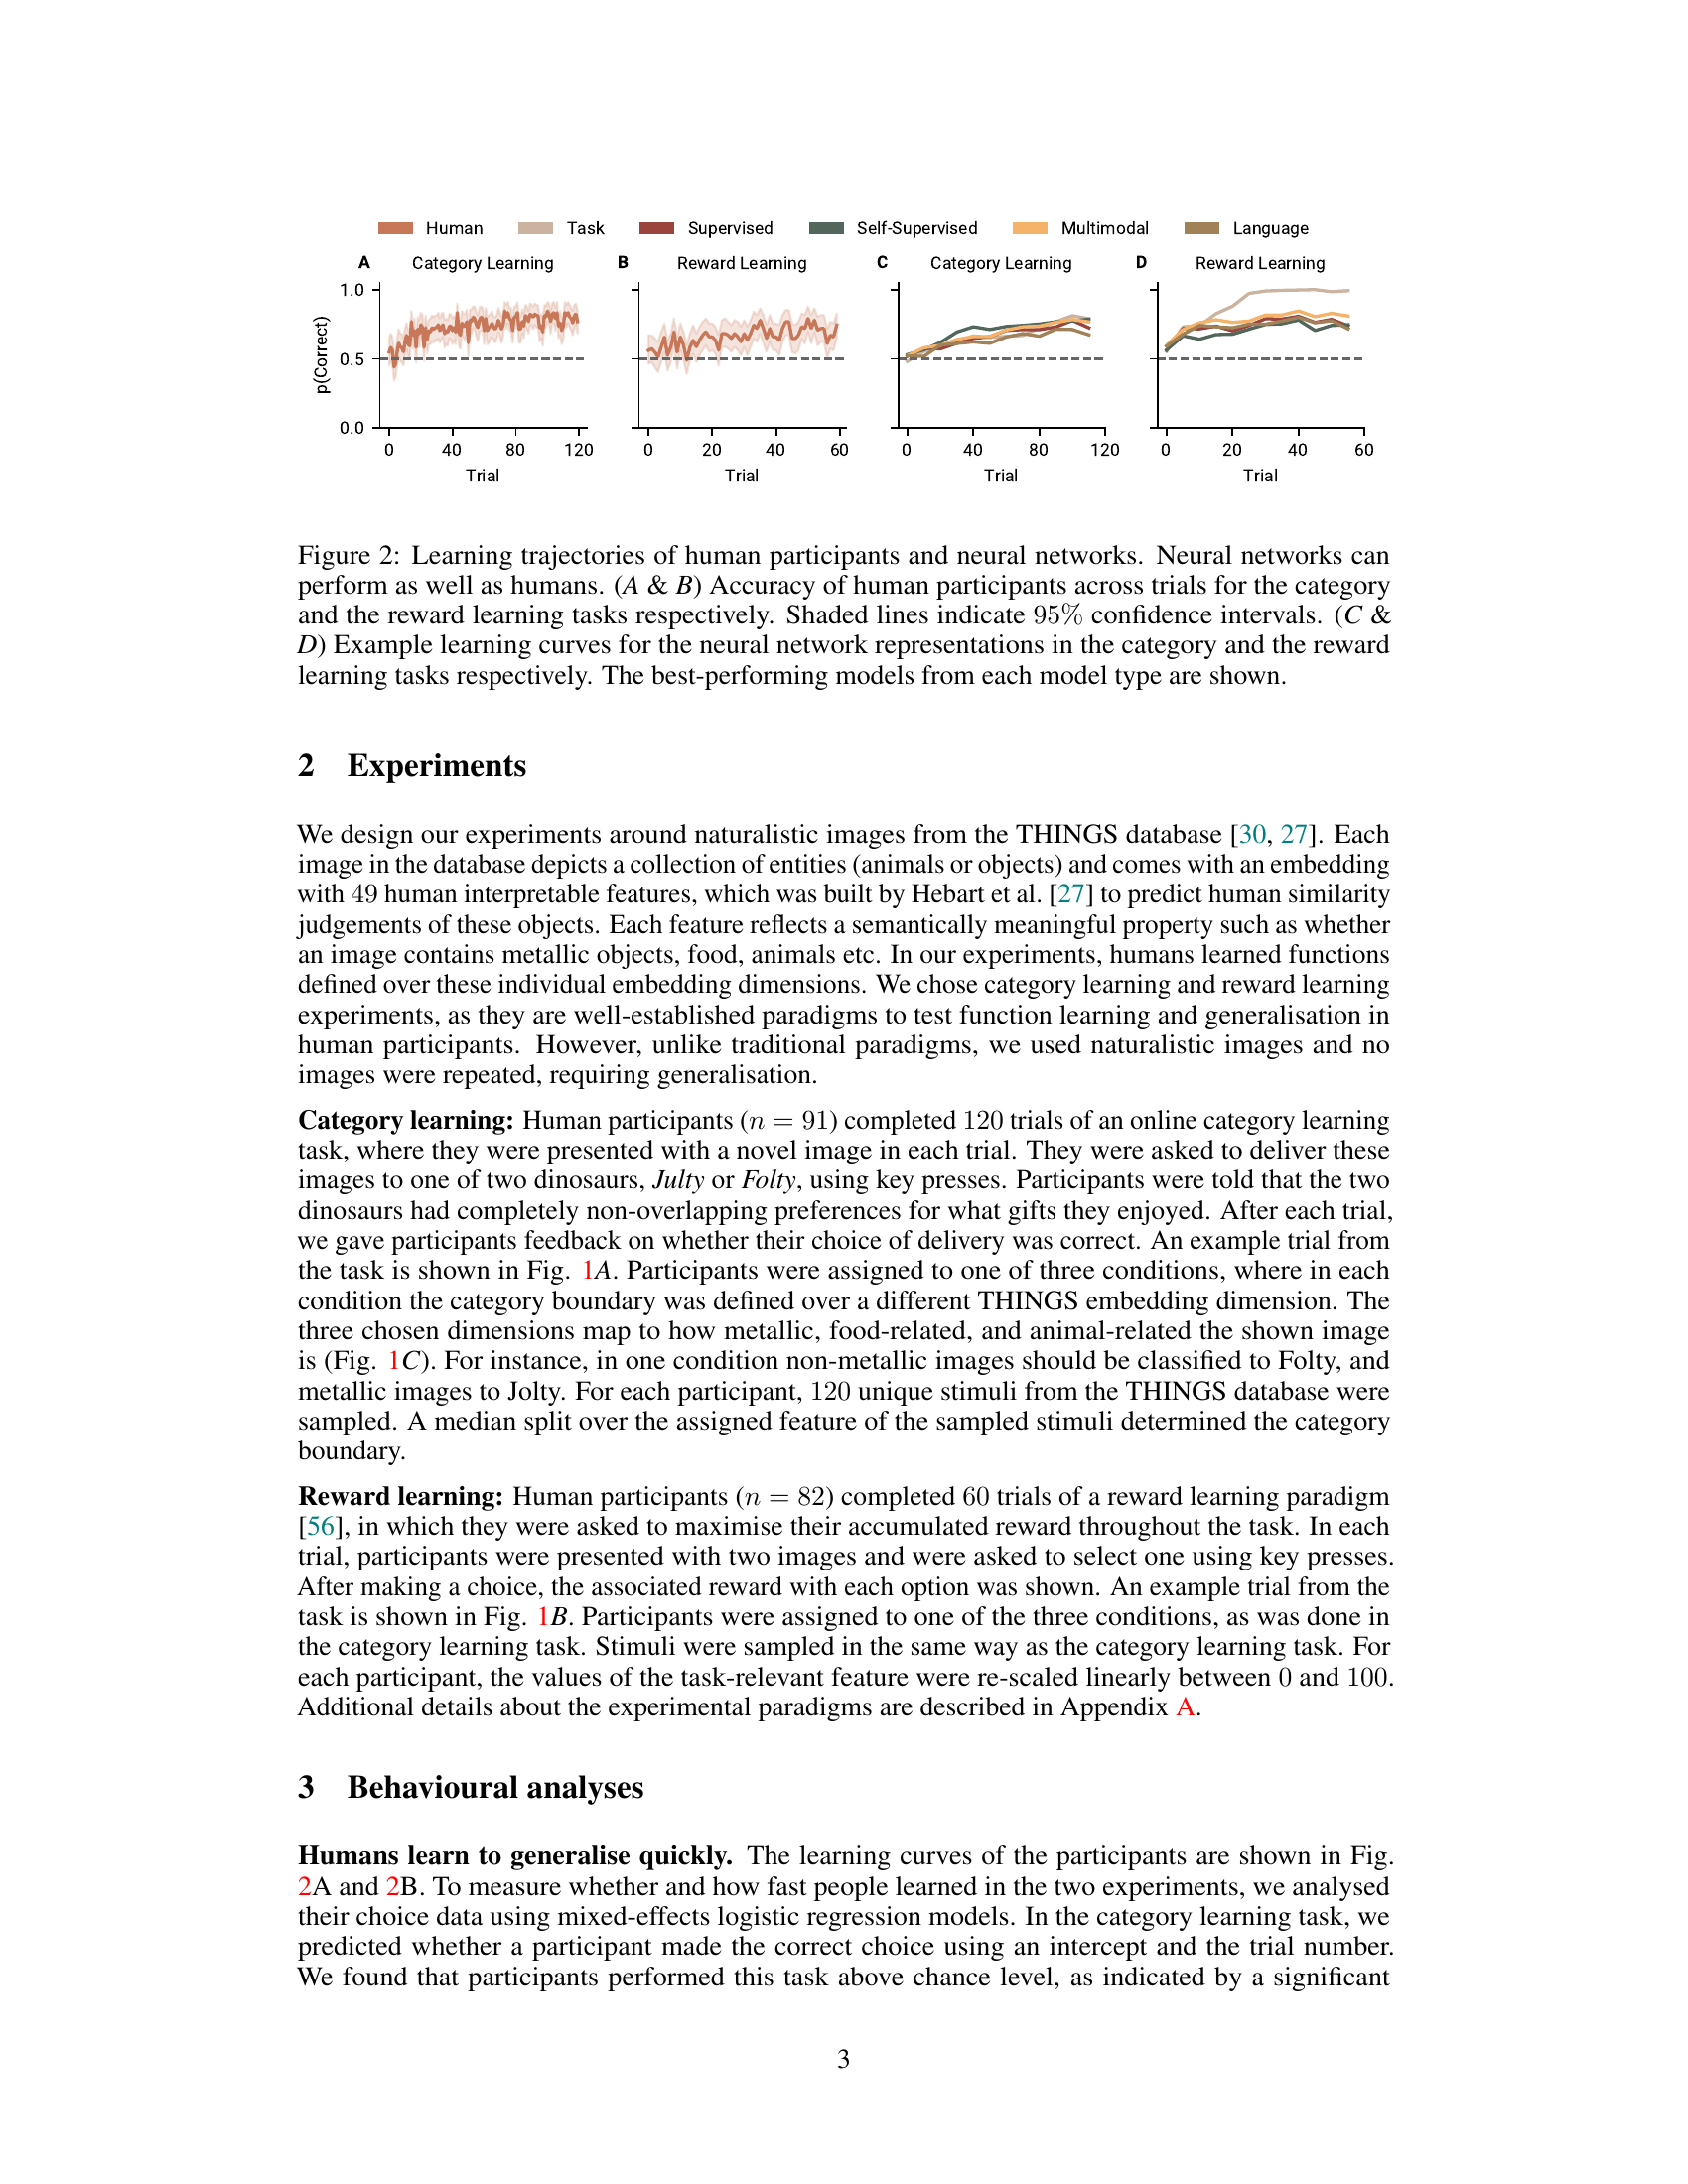
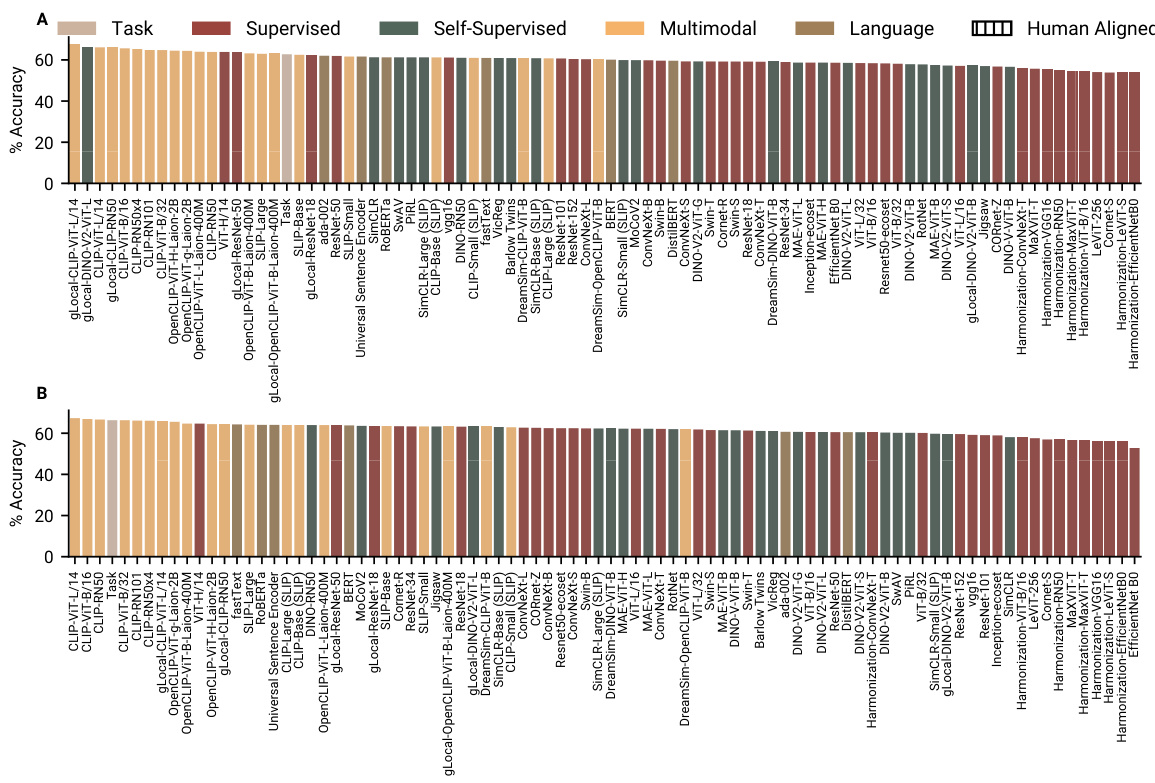
🔼 This figure displays the learning curves for both human participants and neural networks across two tasks: category learning and reward learning. Panels A and B show human performance, illustrating that humans quickly learn the tasks. Panels C and D present the learning curves for neural networks, demonstrating that several models achieve accuracy comparable to humans. The figure highlights the performance of the best-performing models within different model categories (supervised, self-supervised, multimodal, and language).
read the caption
Figure 2: Learning trajectories of human participants and neural networks. Neural networks can perform as well as humans. (A & B) Accuracy of human participants across trials for the category and the reward learning tasks respectively. Shaded lines indicate 95% confidence intervals. (C & D) Example learning curves for the neural network representations in the category and the reward learning tasks respectively. The best-performing models from each model type are shown.
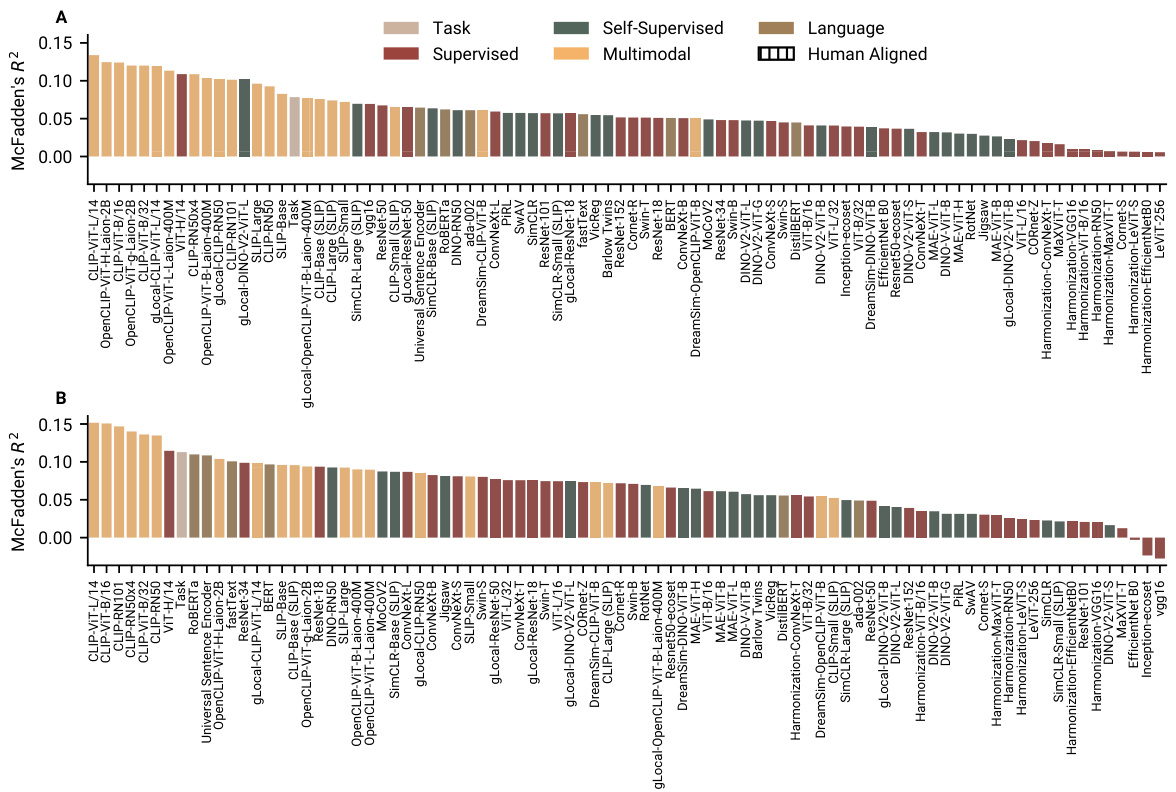
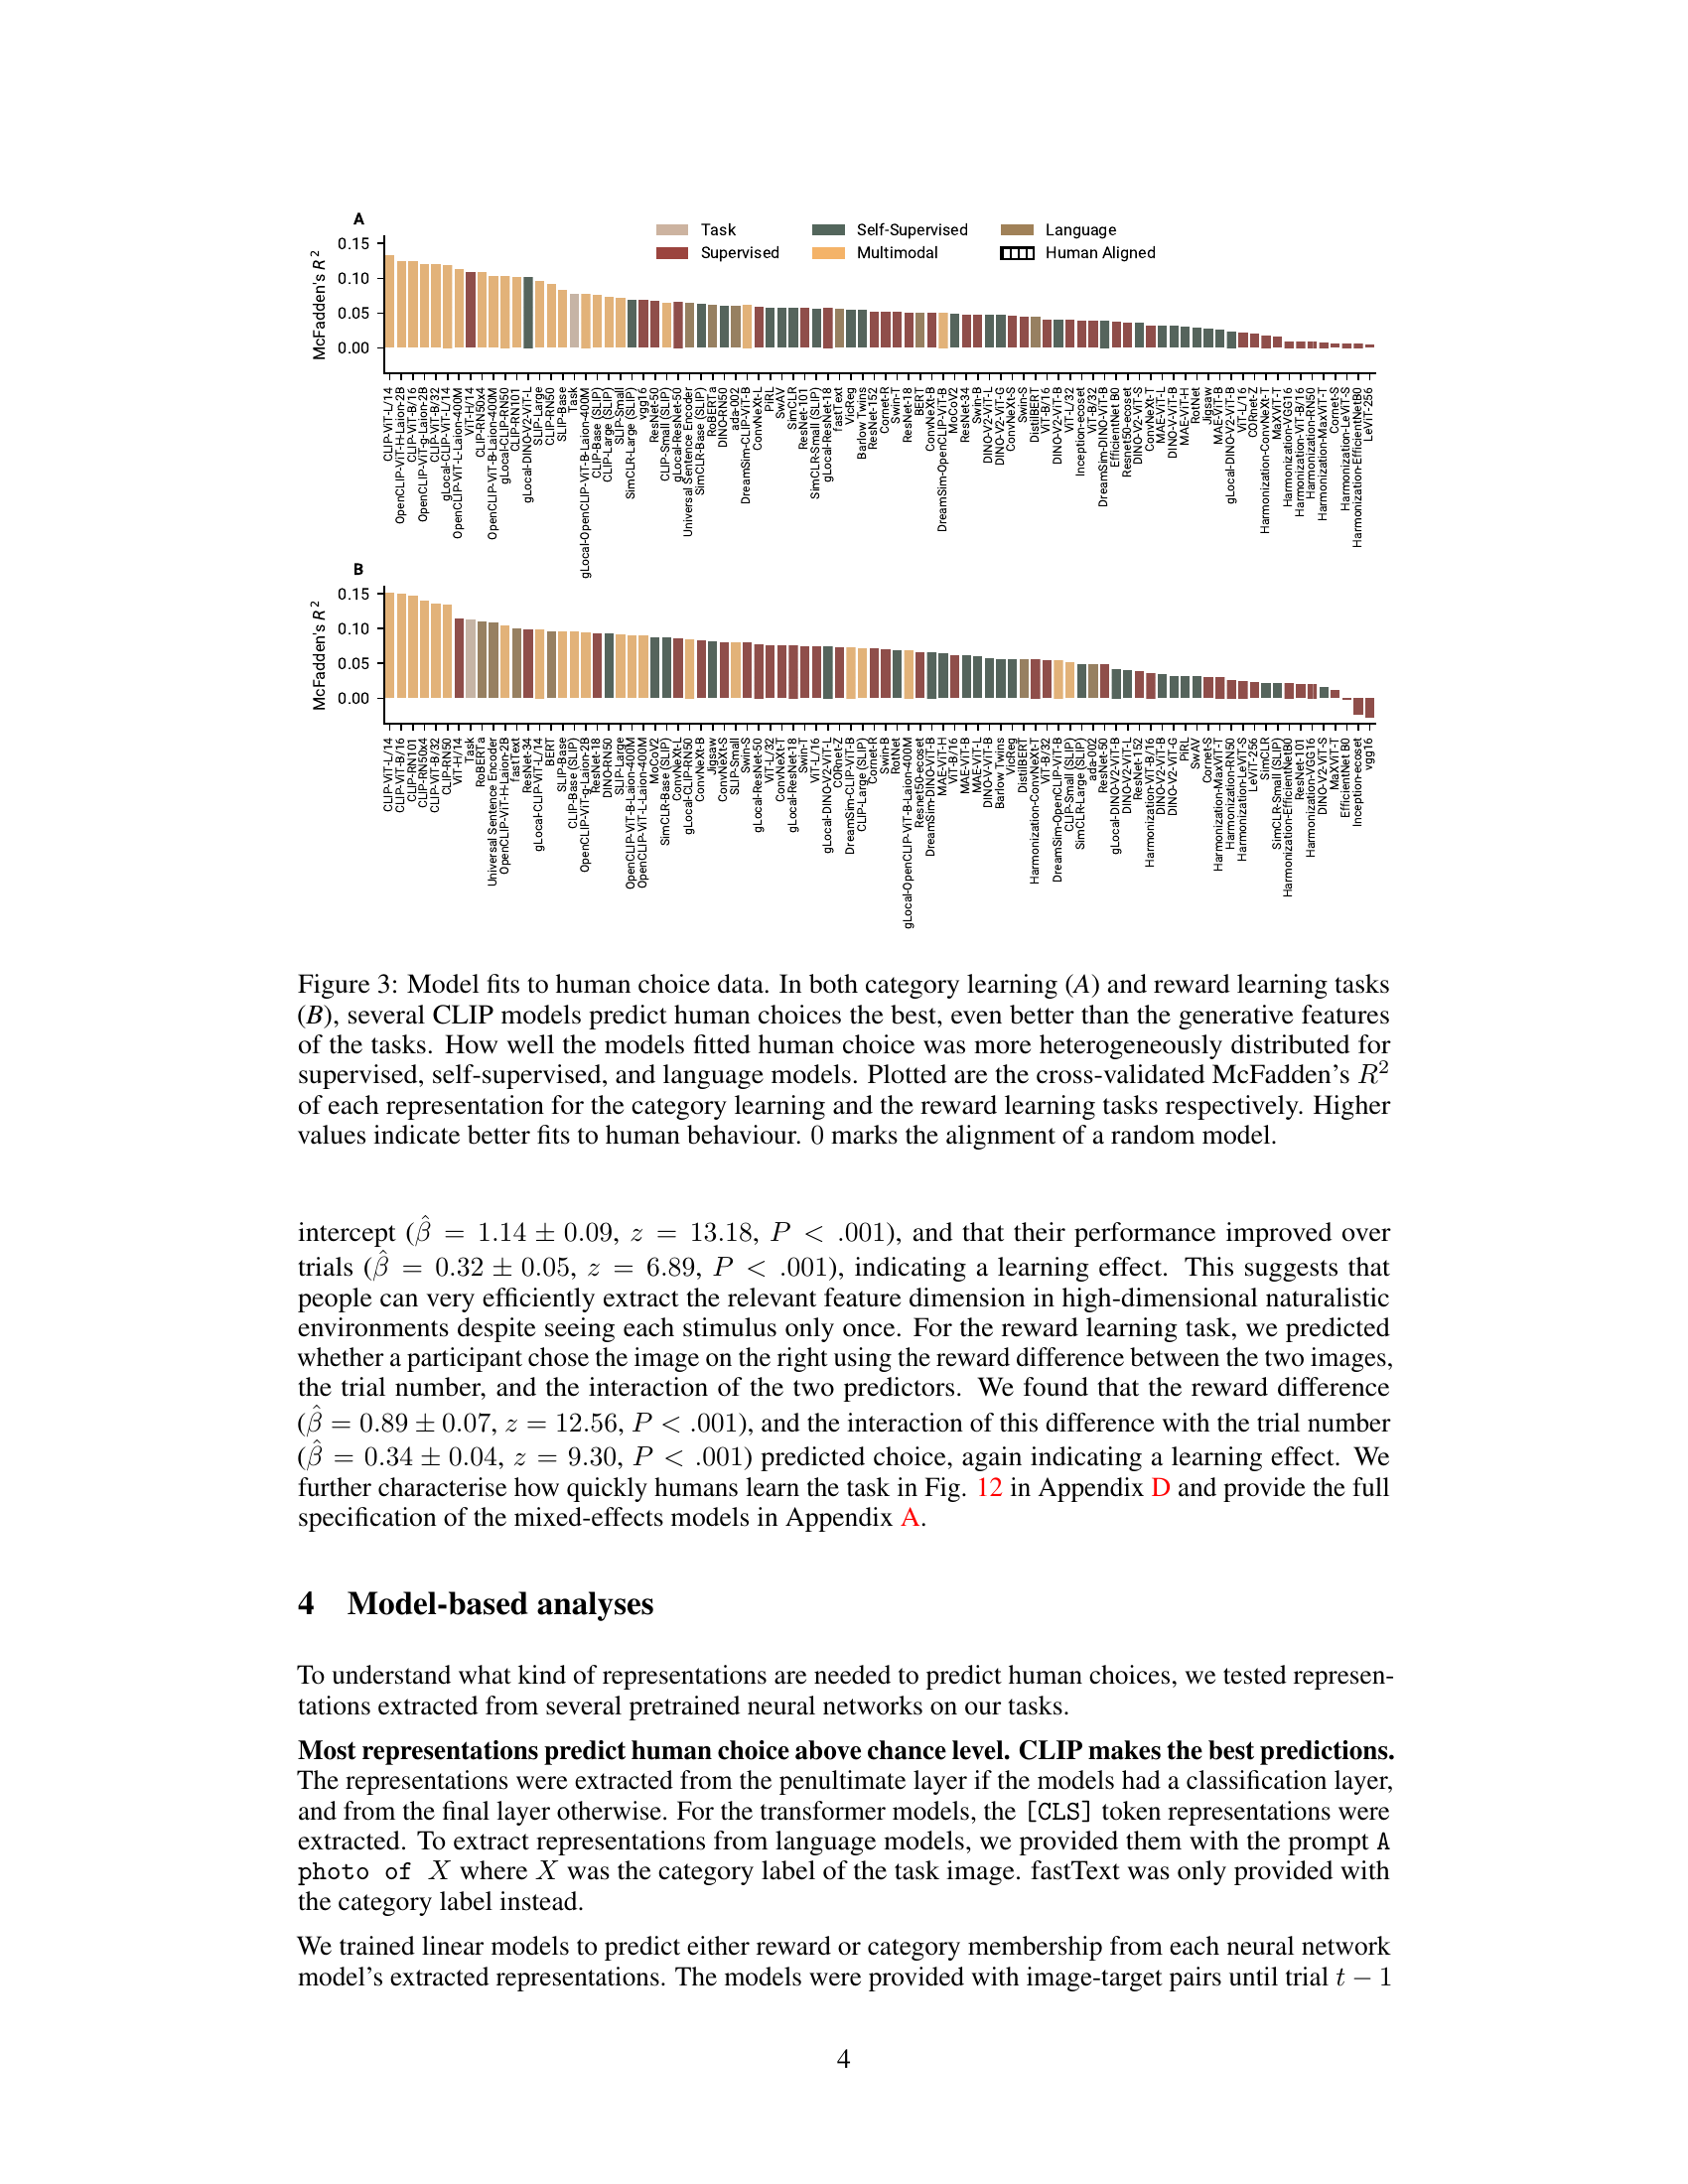
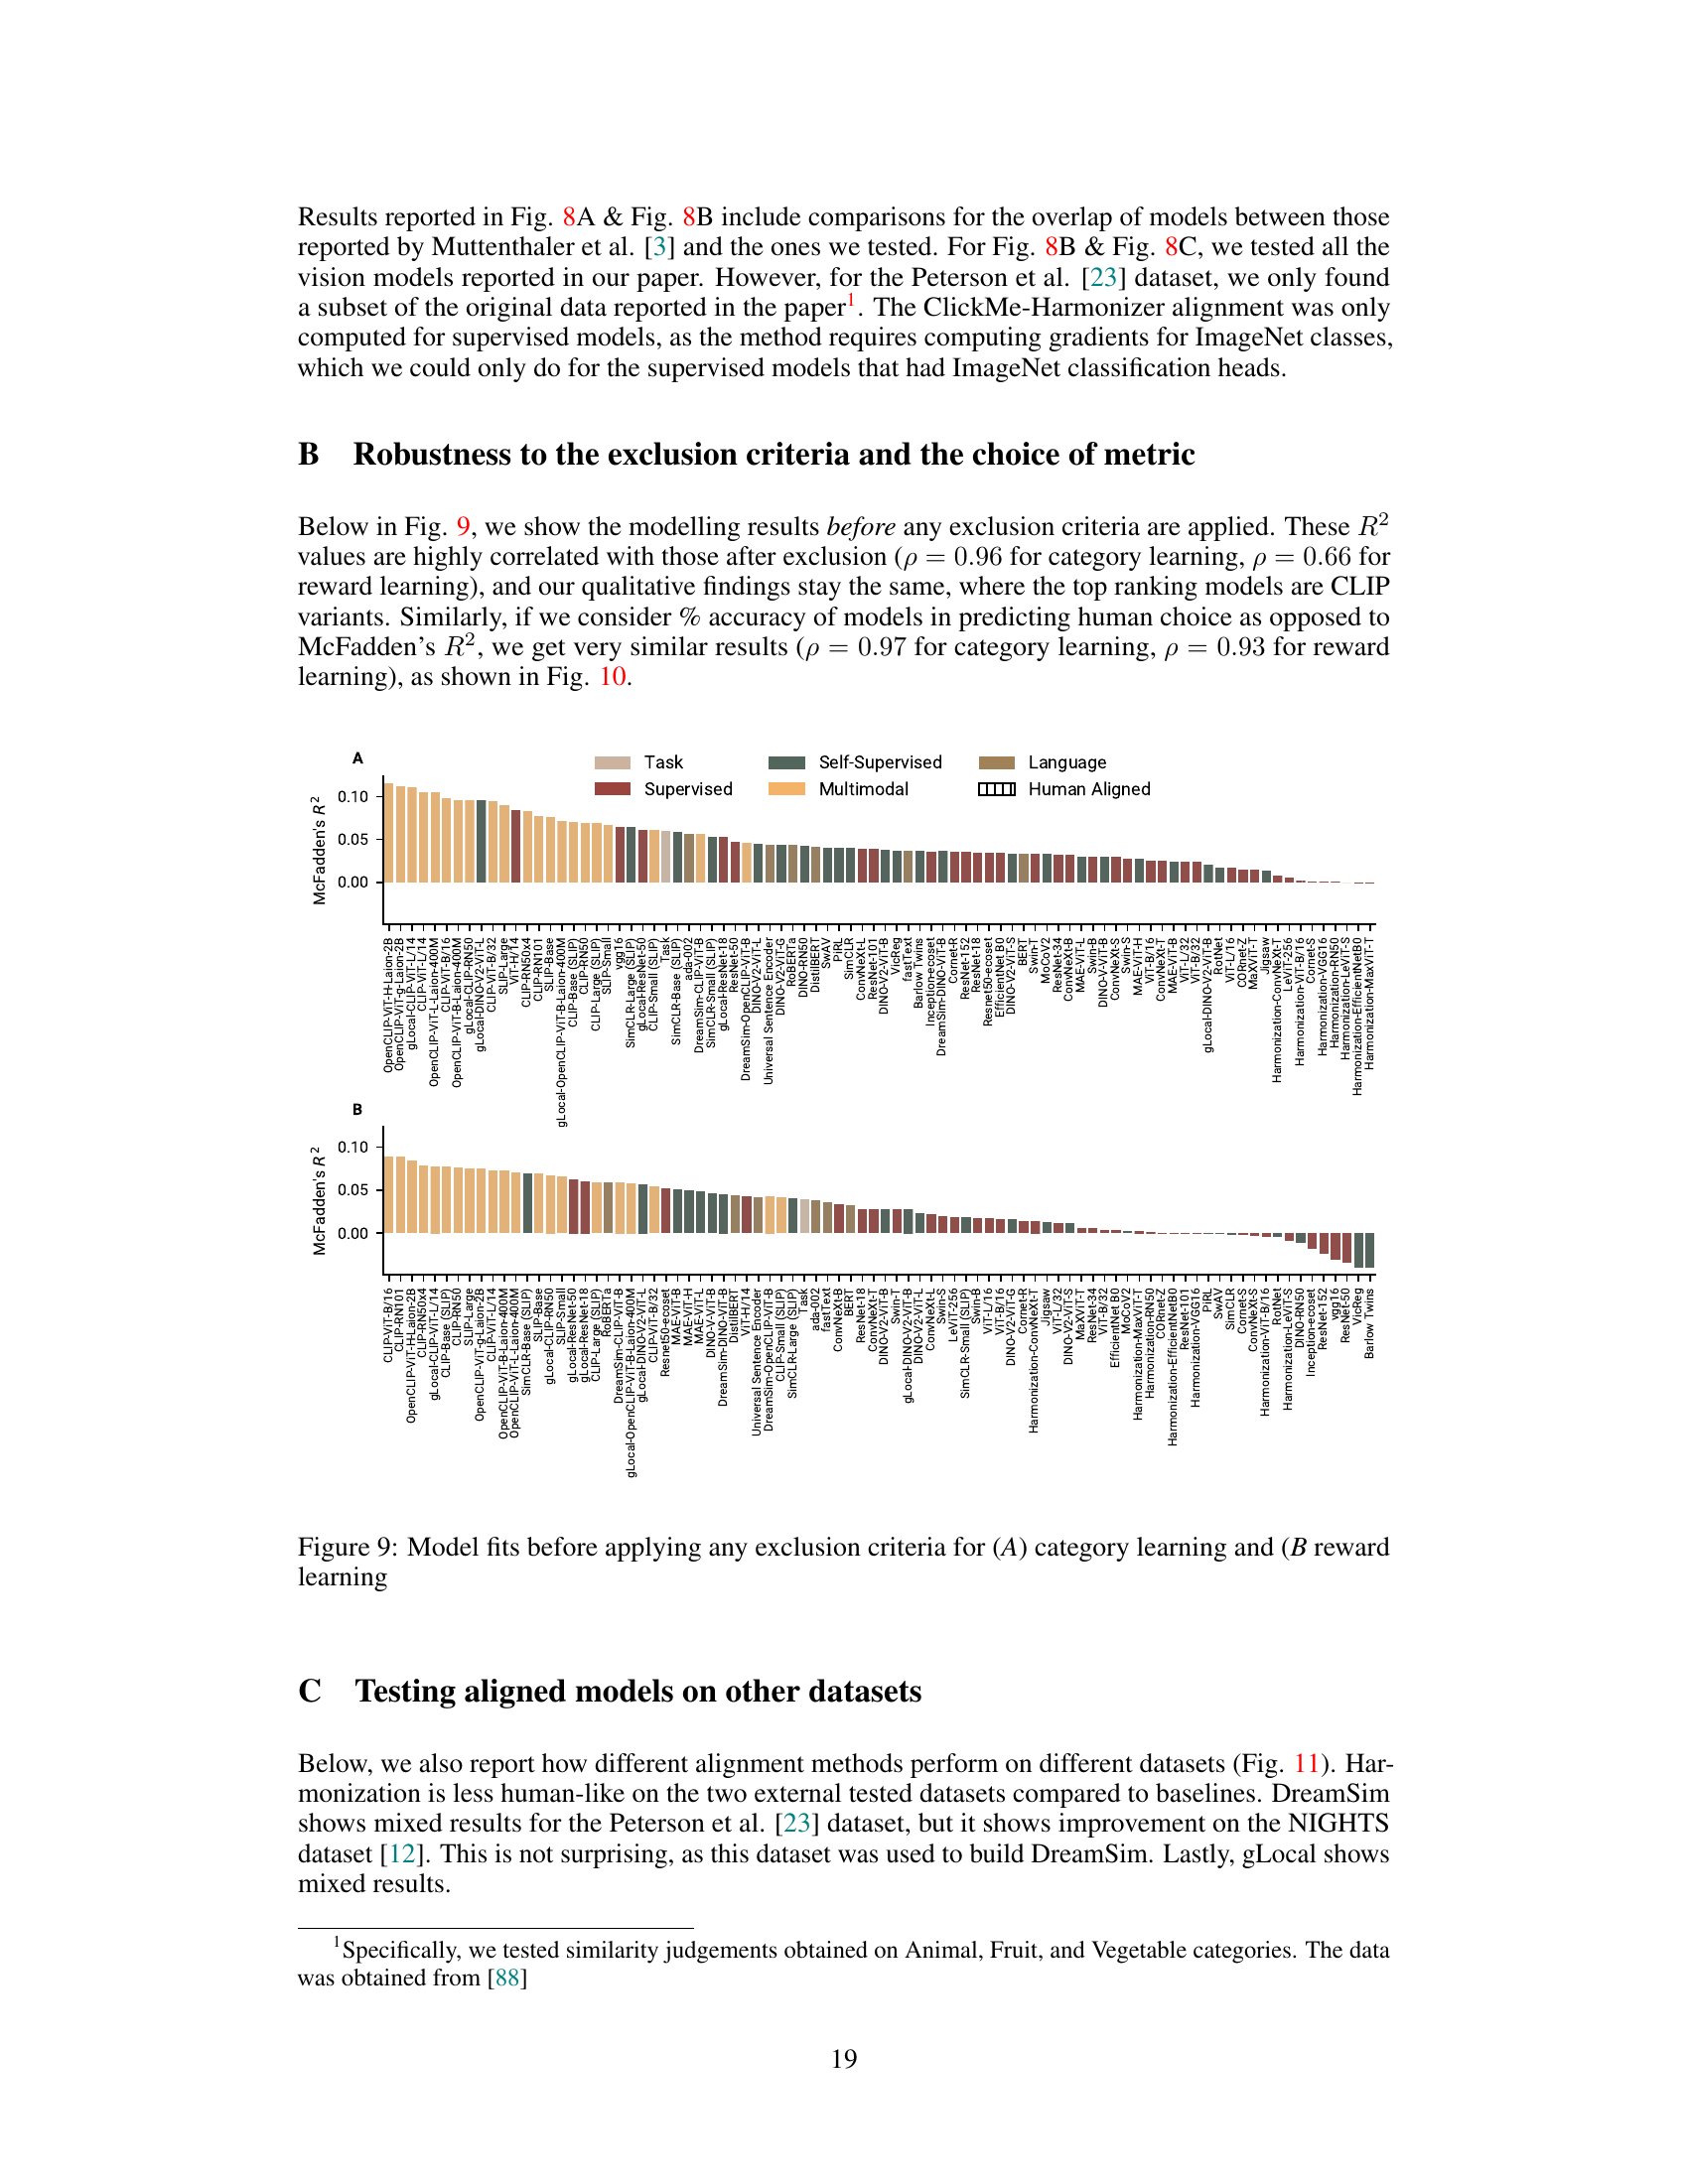
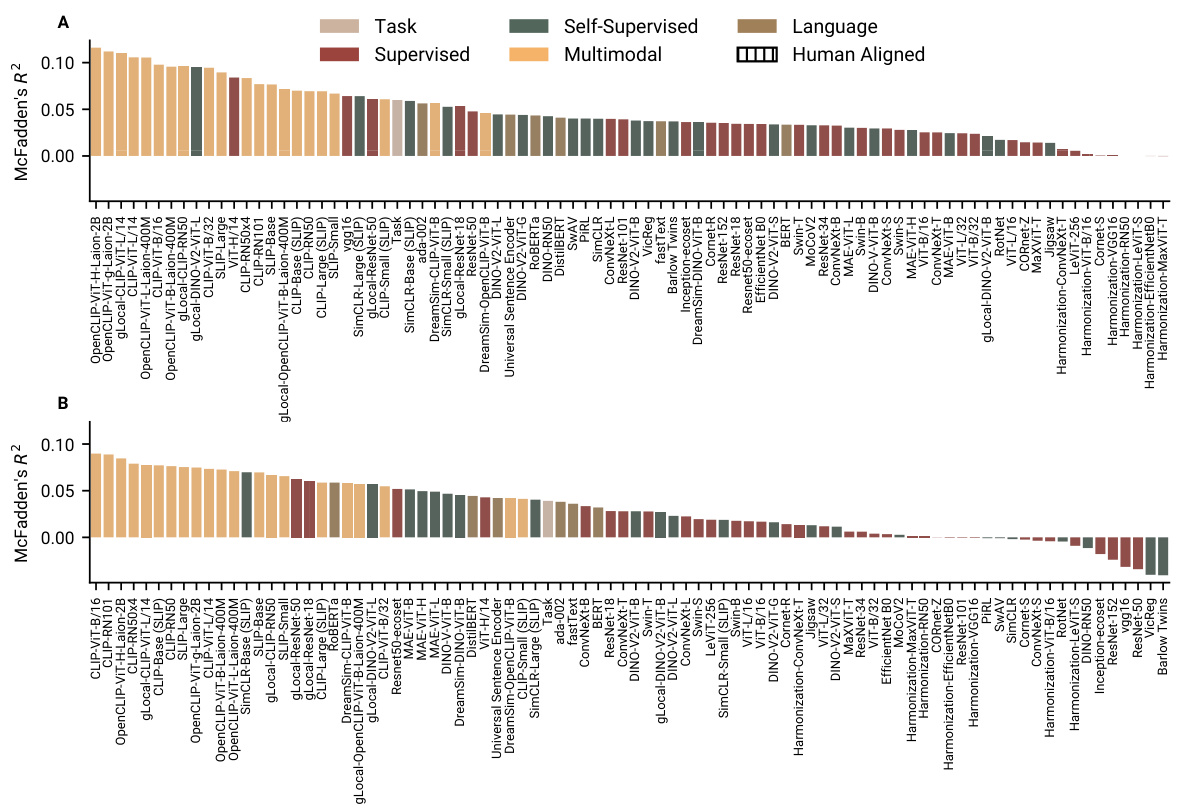
🔼 This figure displays the goodness of fit of various neural network models in predicting human choices in two tasks: category learning and reward learning. The McFadden’s R-squared statistic is used to quantify the fit, with higher values indicating better alignment between model predictions and human choices. CLIP models consistently show the best fit, outperforming even the generative features used to create the tasks, while supervised, self-supervised and language models show more variability in their performance.
read the caption
Figure 3: Model fits to human choice data. In both category learning (A) and reward learning tasks (B), several CLIP models predict human choices the best, even better than the generative features of the tasks. How well the models fitted human choice was more heterogeneously distributed for supervised, self-supervised, and language models. Plotted are the cross-validated McFadden's R2 of each representation for the category learning and the reward learning tasks respectively. Higher values indicate better fits to human behaviour. 0 marks the alignment of a random model.
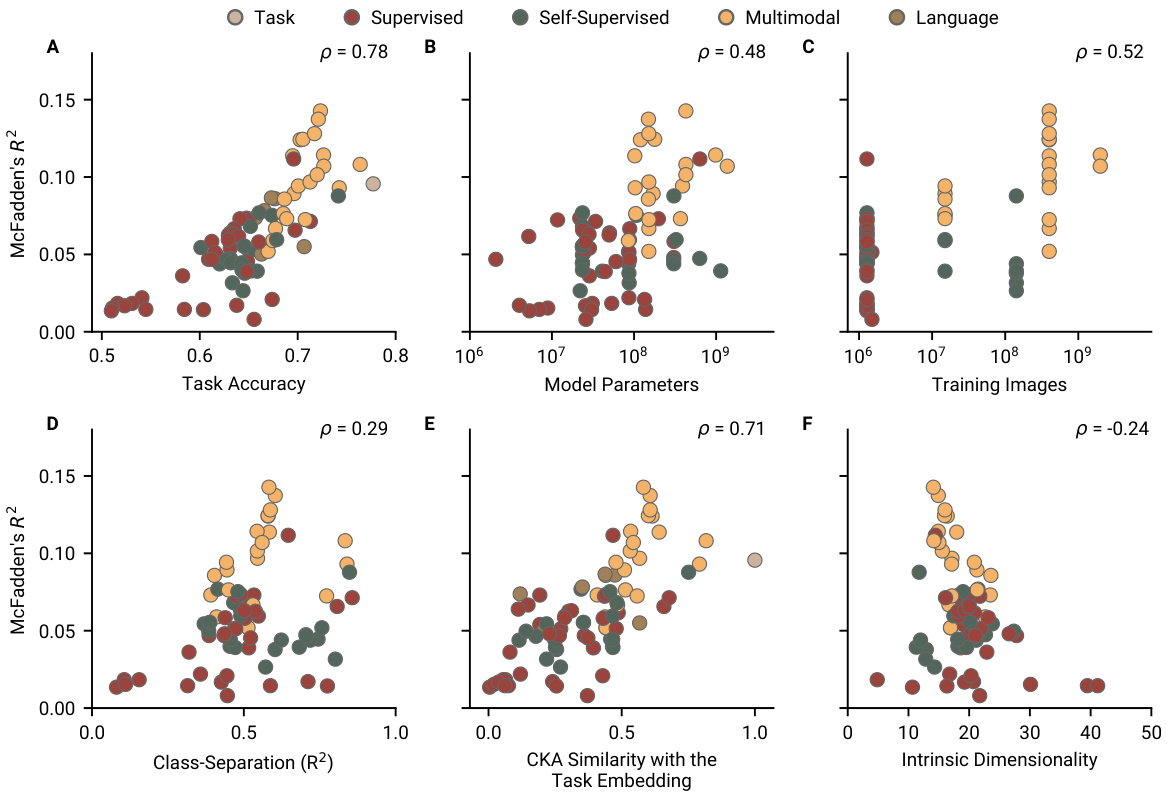
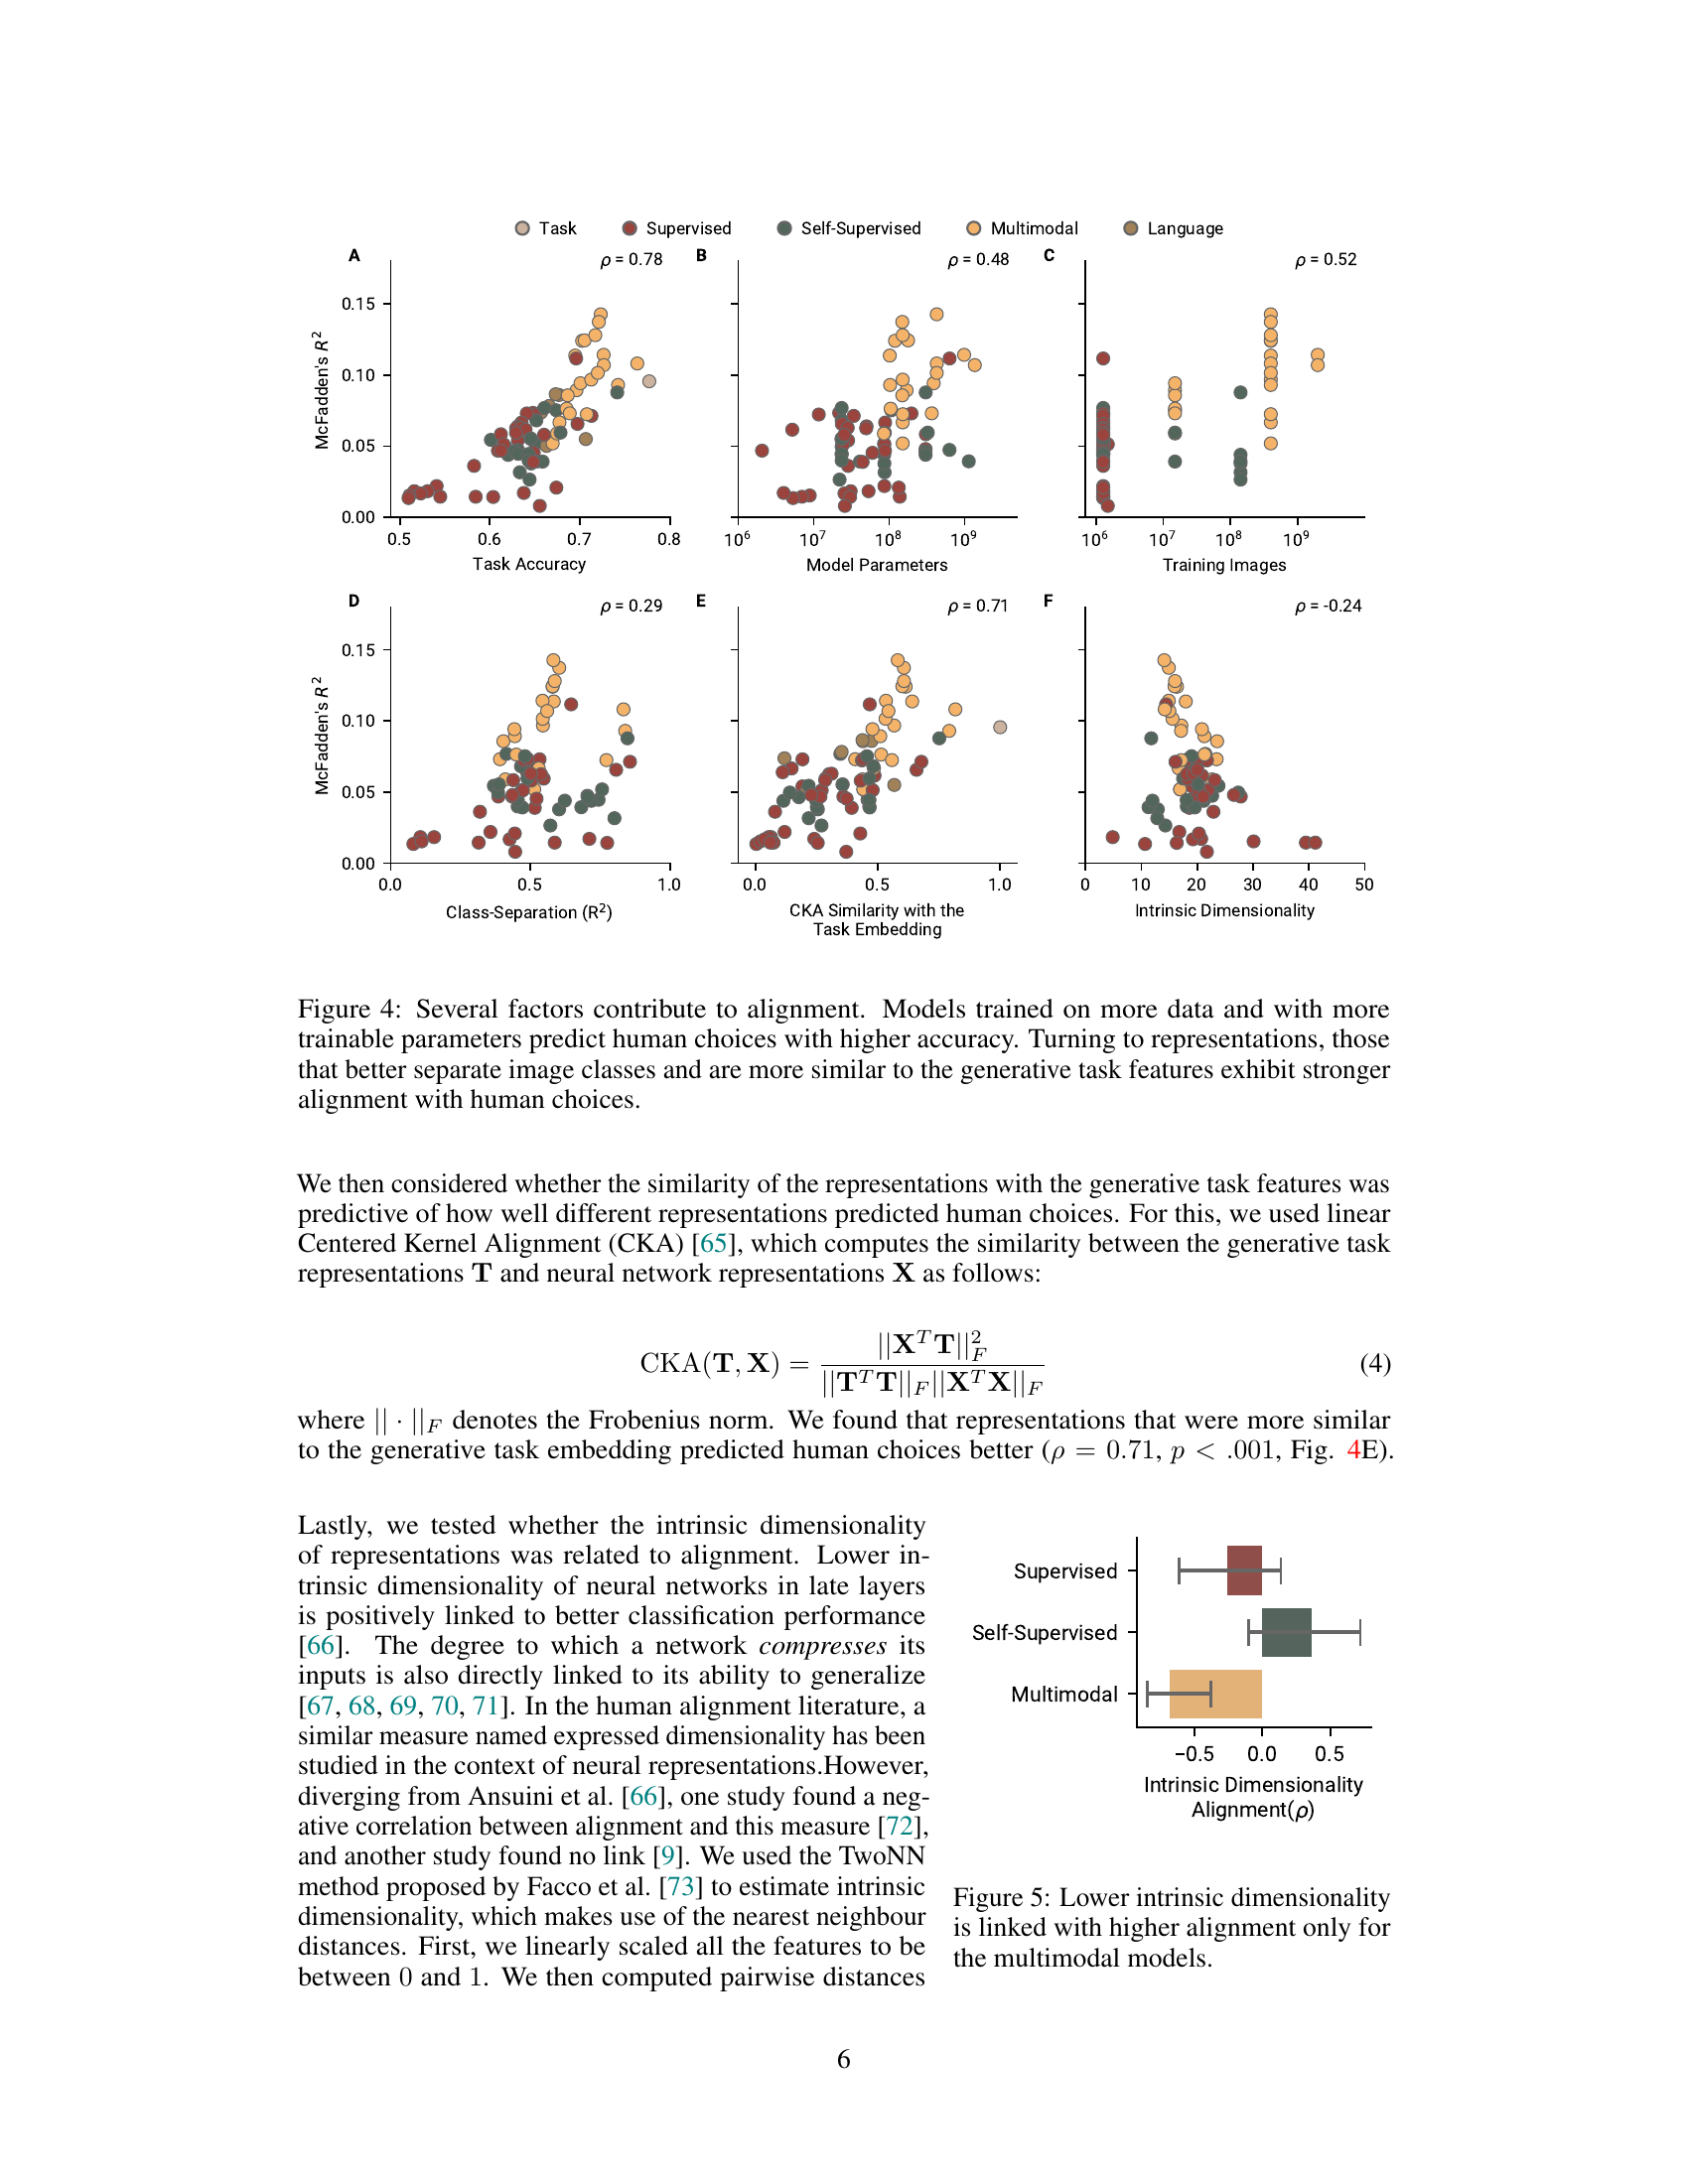
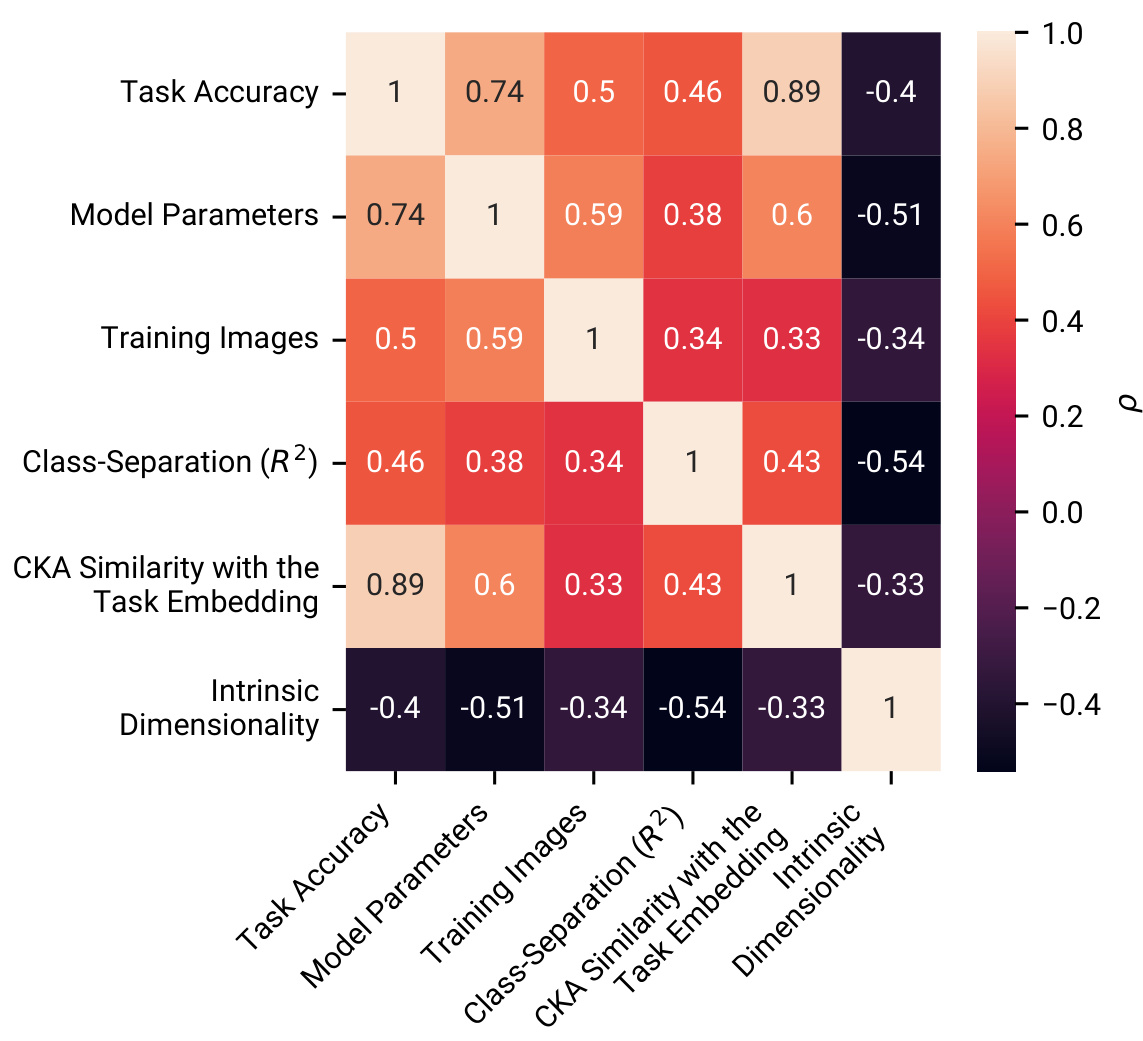
🔼 This figure displays the correlation between several factors and the alignment of neural network models with human choices in two image-based learning tasks. The factors examined include task accuracy, the number of model parameters, the number of training images, class separation in representations, the similarity between representations and the generative task embedding (measured by Kernel Alignment), and intrinsic dimensionality. The results indicate a positive correlation between model size, amount of training data, class separation, and similarity to the task embedding, and alignment with human choices. Conversely, lower intrinsic dimensionality is associated with higher alignment, particularly for multimodal models.
read the caption
Figure 4: Several factors contribute to alignment. Models trained on more data and with more trainable parameters predict human choices with higher accuracy. Turning to representations, those that better separate image classes and are more similar to the generative task features exhibit stronger alignment with human choices.
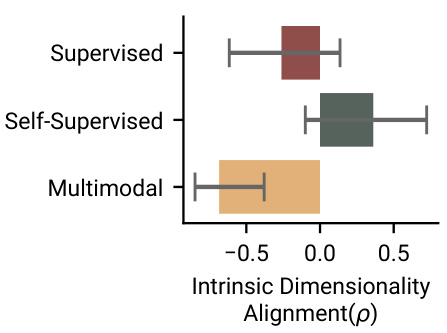
🔼 This figure displays the relationship between intrinsic dimensionality and alignment (measured by Pearson correlation) for different model types (supervised, self-supervised, and multimodal). It reveals that lower intrinsic dimensionality correlates positively with higher human alignment, but only for the multimodal models. This finding suggests that the capability of multimodal models to compress input effectively contributes to their better alignment with human behaviour in the cognitive tasks described in the paper.
read the caption
Figure 5: Lower intrinsic dimensionality is linked with higher alignment only for the multimodal models.
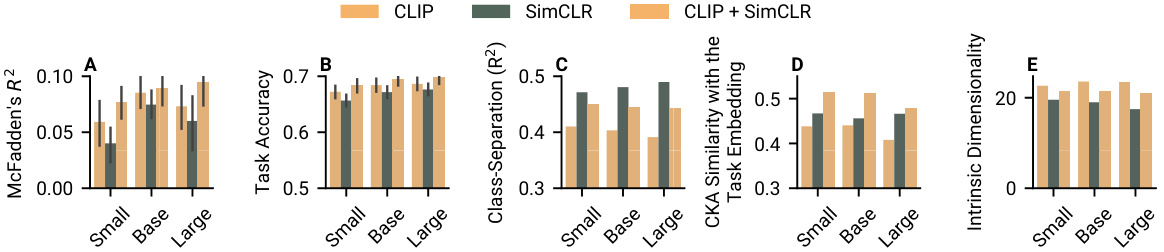
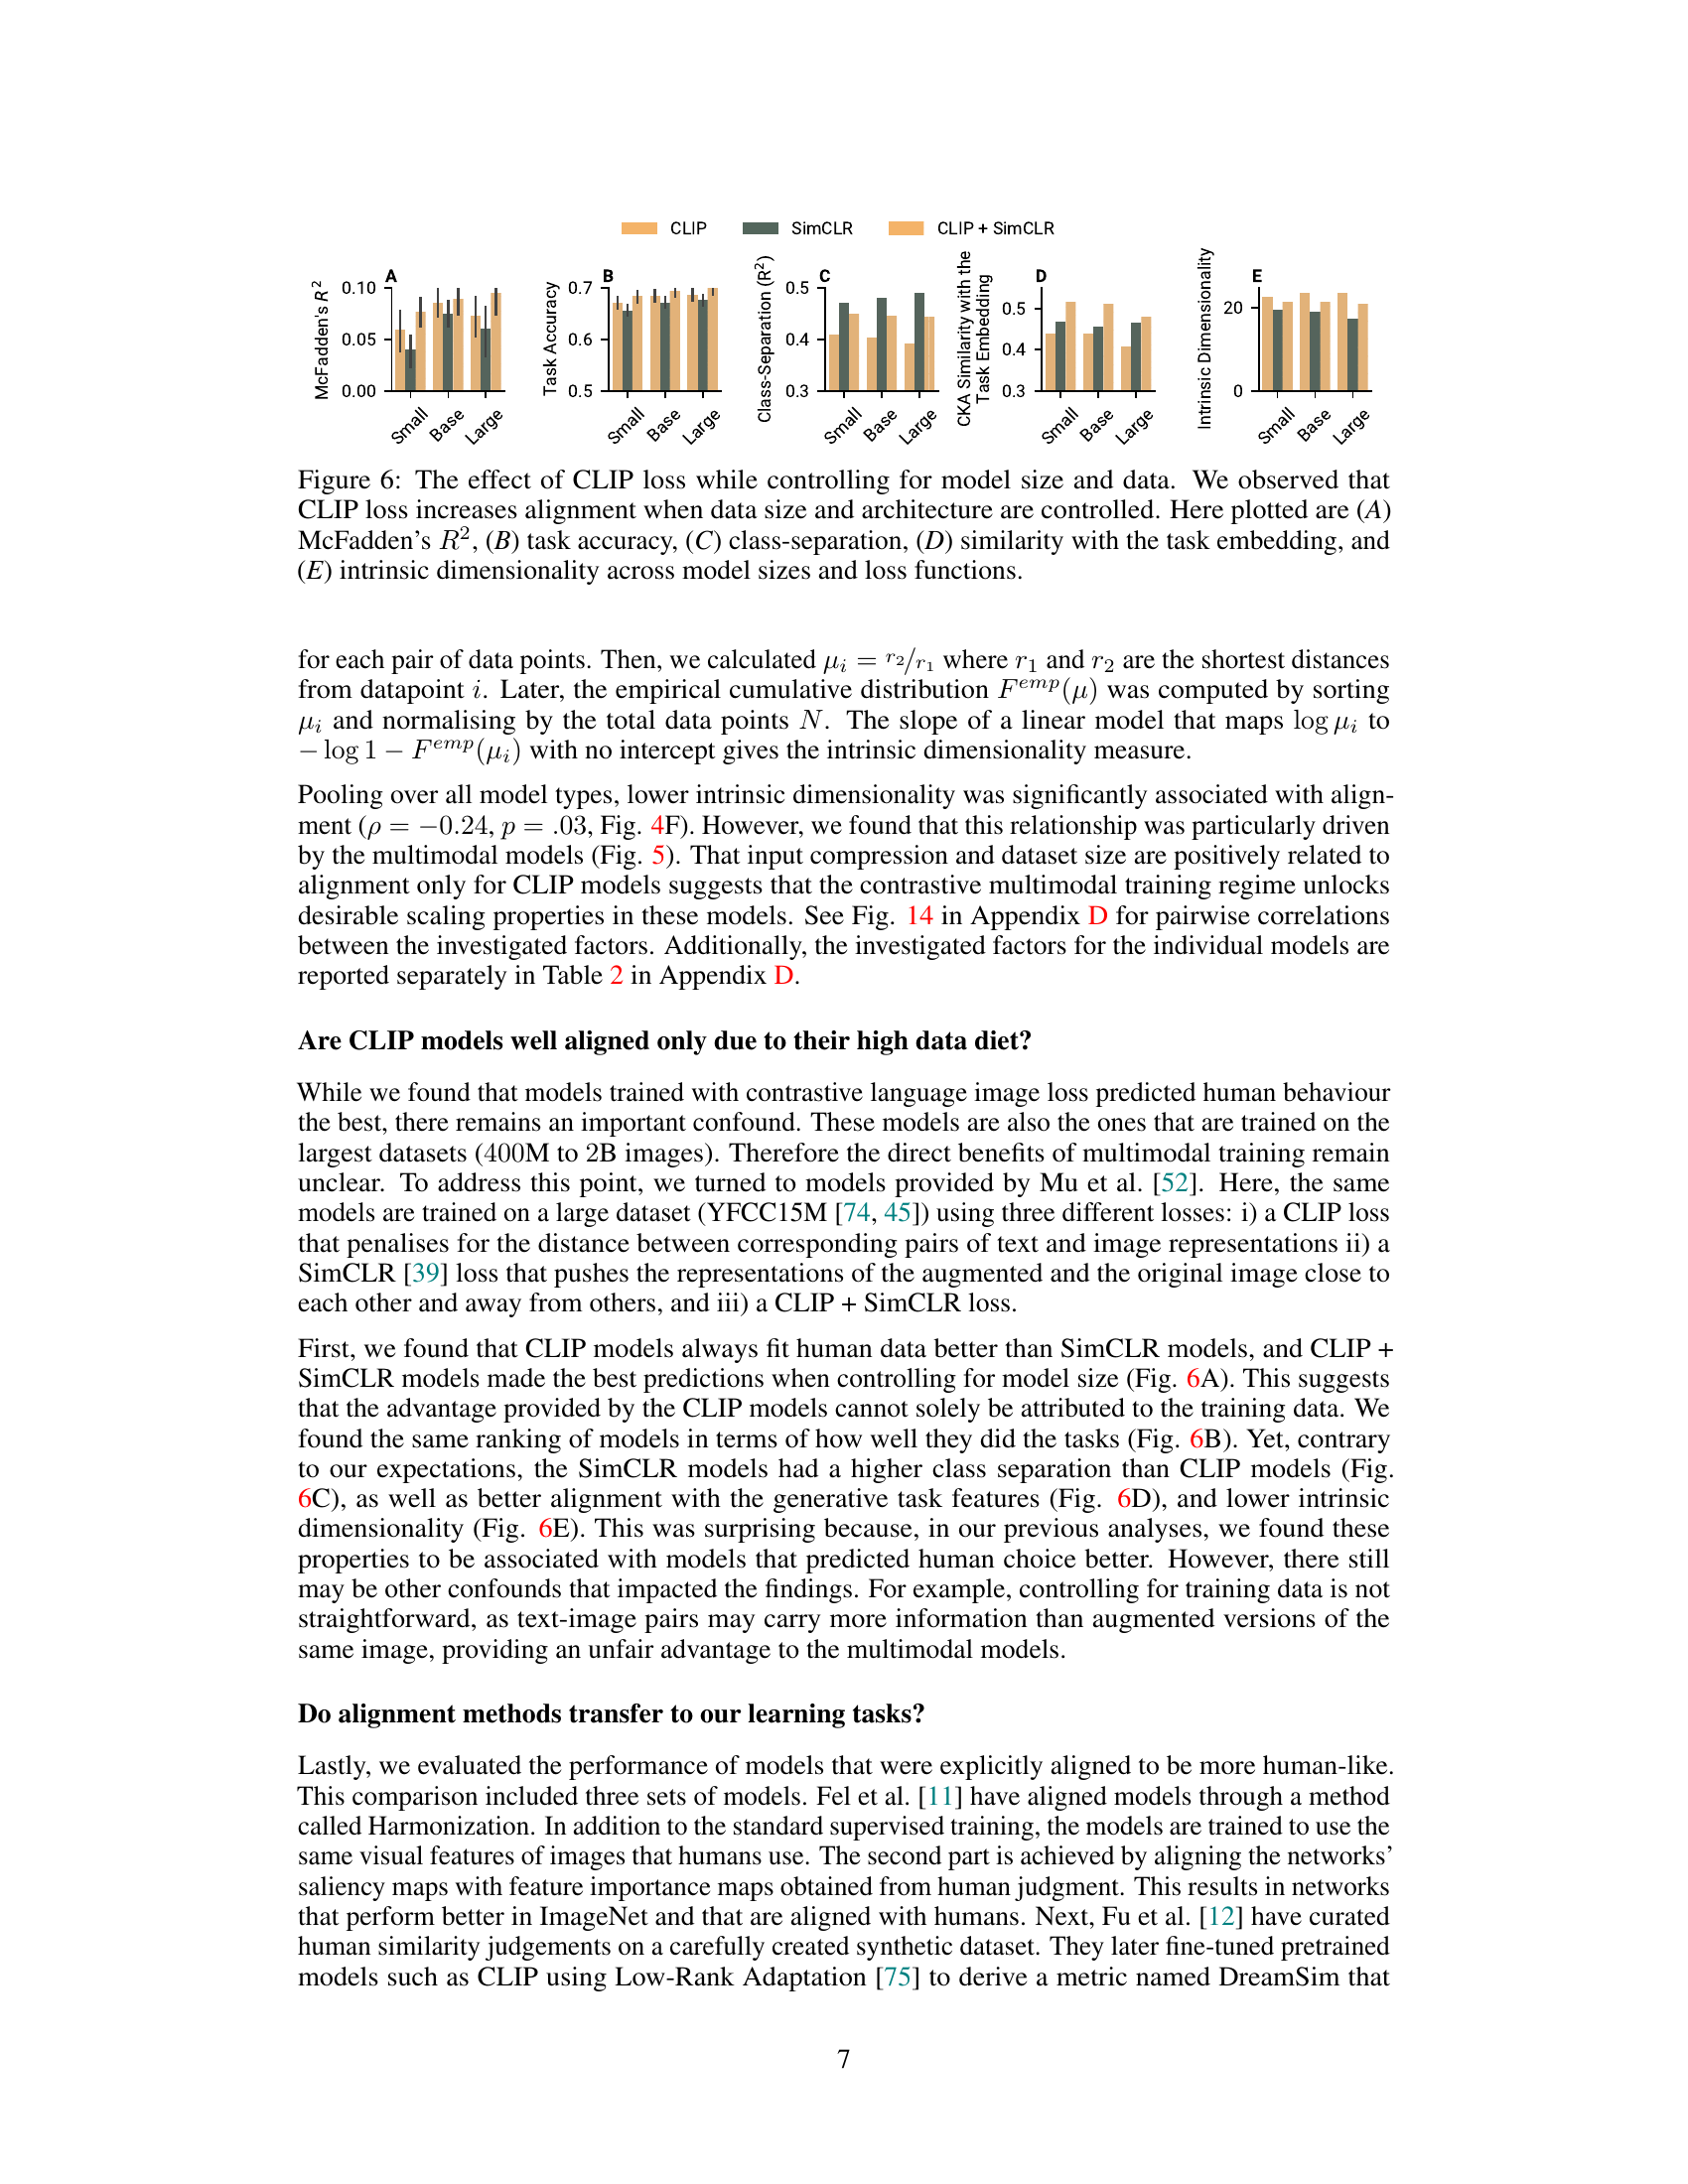
🔼 This figure analyzes the impact of CLIP loss on model alignment with human choices, while controlling for model size and dataset size. It displays five key metrics across three model sizes (small, base, large) trained with three loss functions: CLIP, SimCLR, and CLIP+SimCLR. The metrics visualized are McFadden’s R2 (model fit to human choices), task accuracy, class separation, similarity to the task embedding (CKA), and intrinsic dimensionality. The figure helps determine if the benefits of CLIP are due to its specific loss function or other factors such as increased model capacity and data.
read the caption
Figure 6: The effect of CLIP loss while controlling for model size and data. We observed that CLIP loss increases alignment when data size and architecture are controlled. Here plotted are (A) McFadden's R2, (B) task accuracy, (C) class-separation, (D) similarity with the task embedding, and (E) intrinsic dimensionality across model sizes and loss functions.
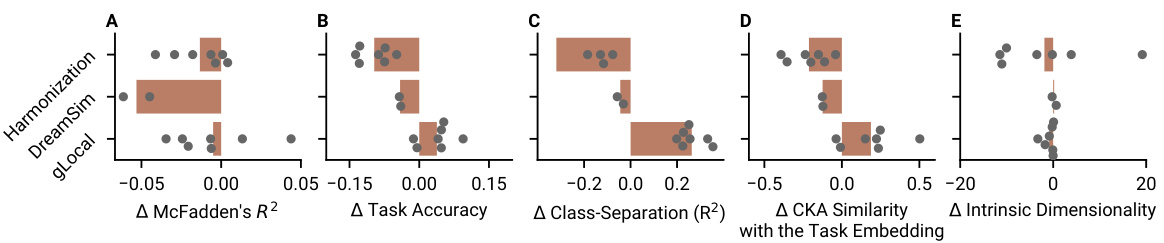
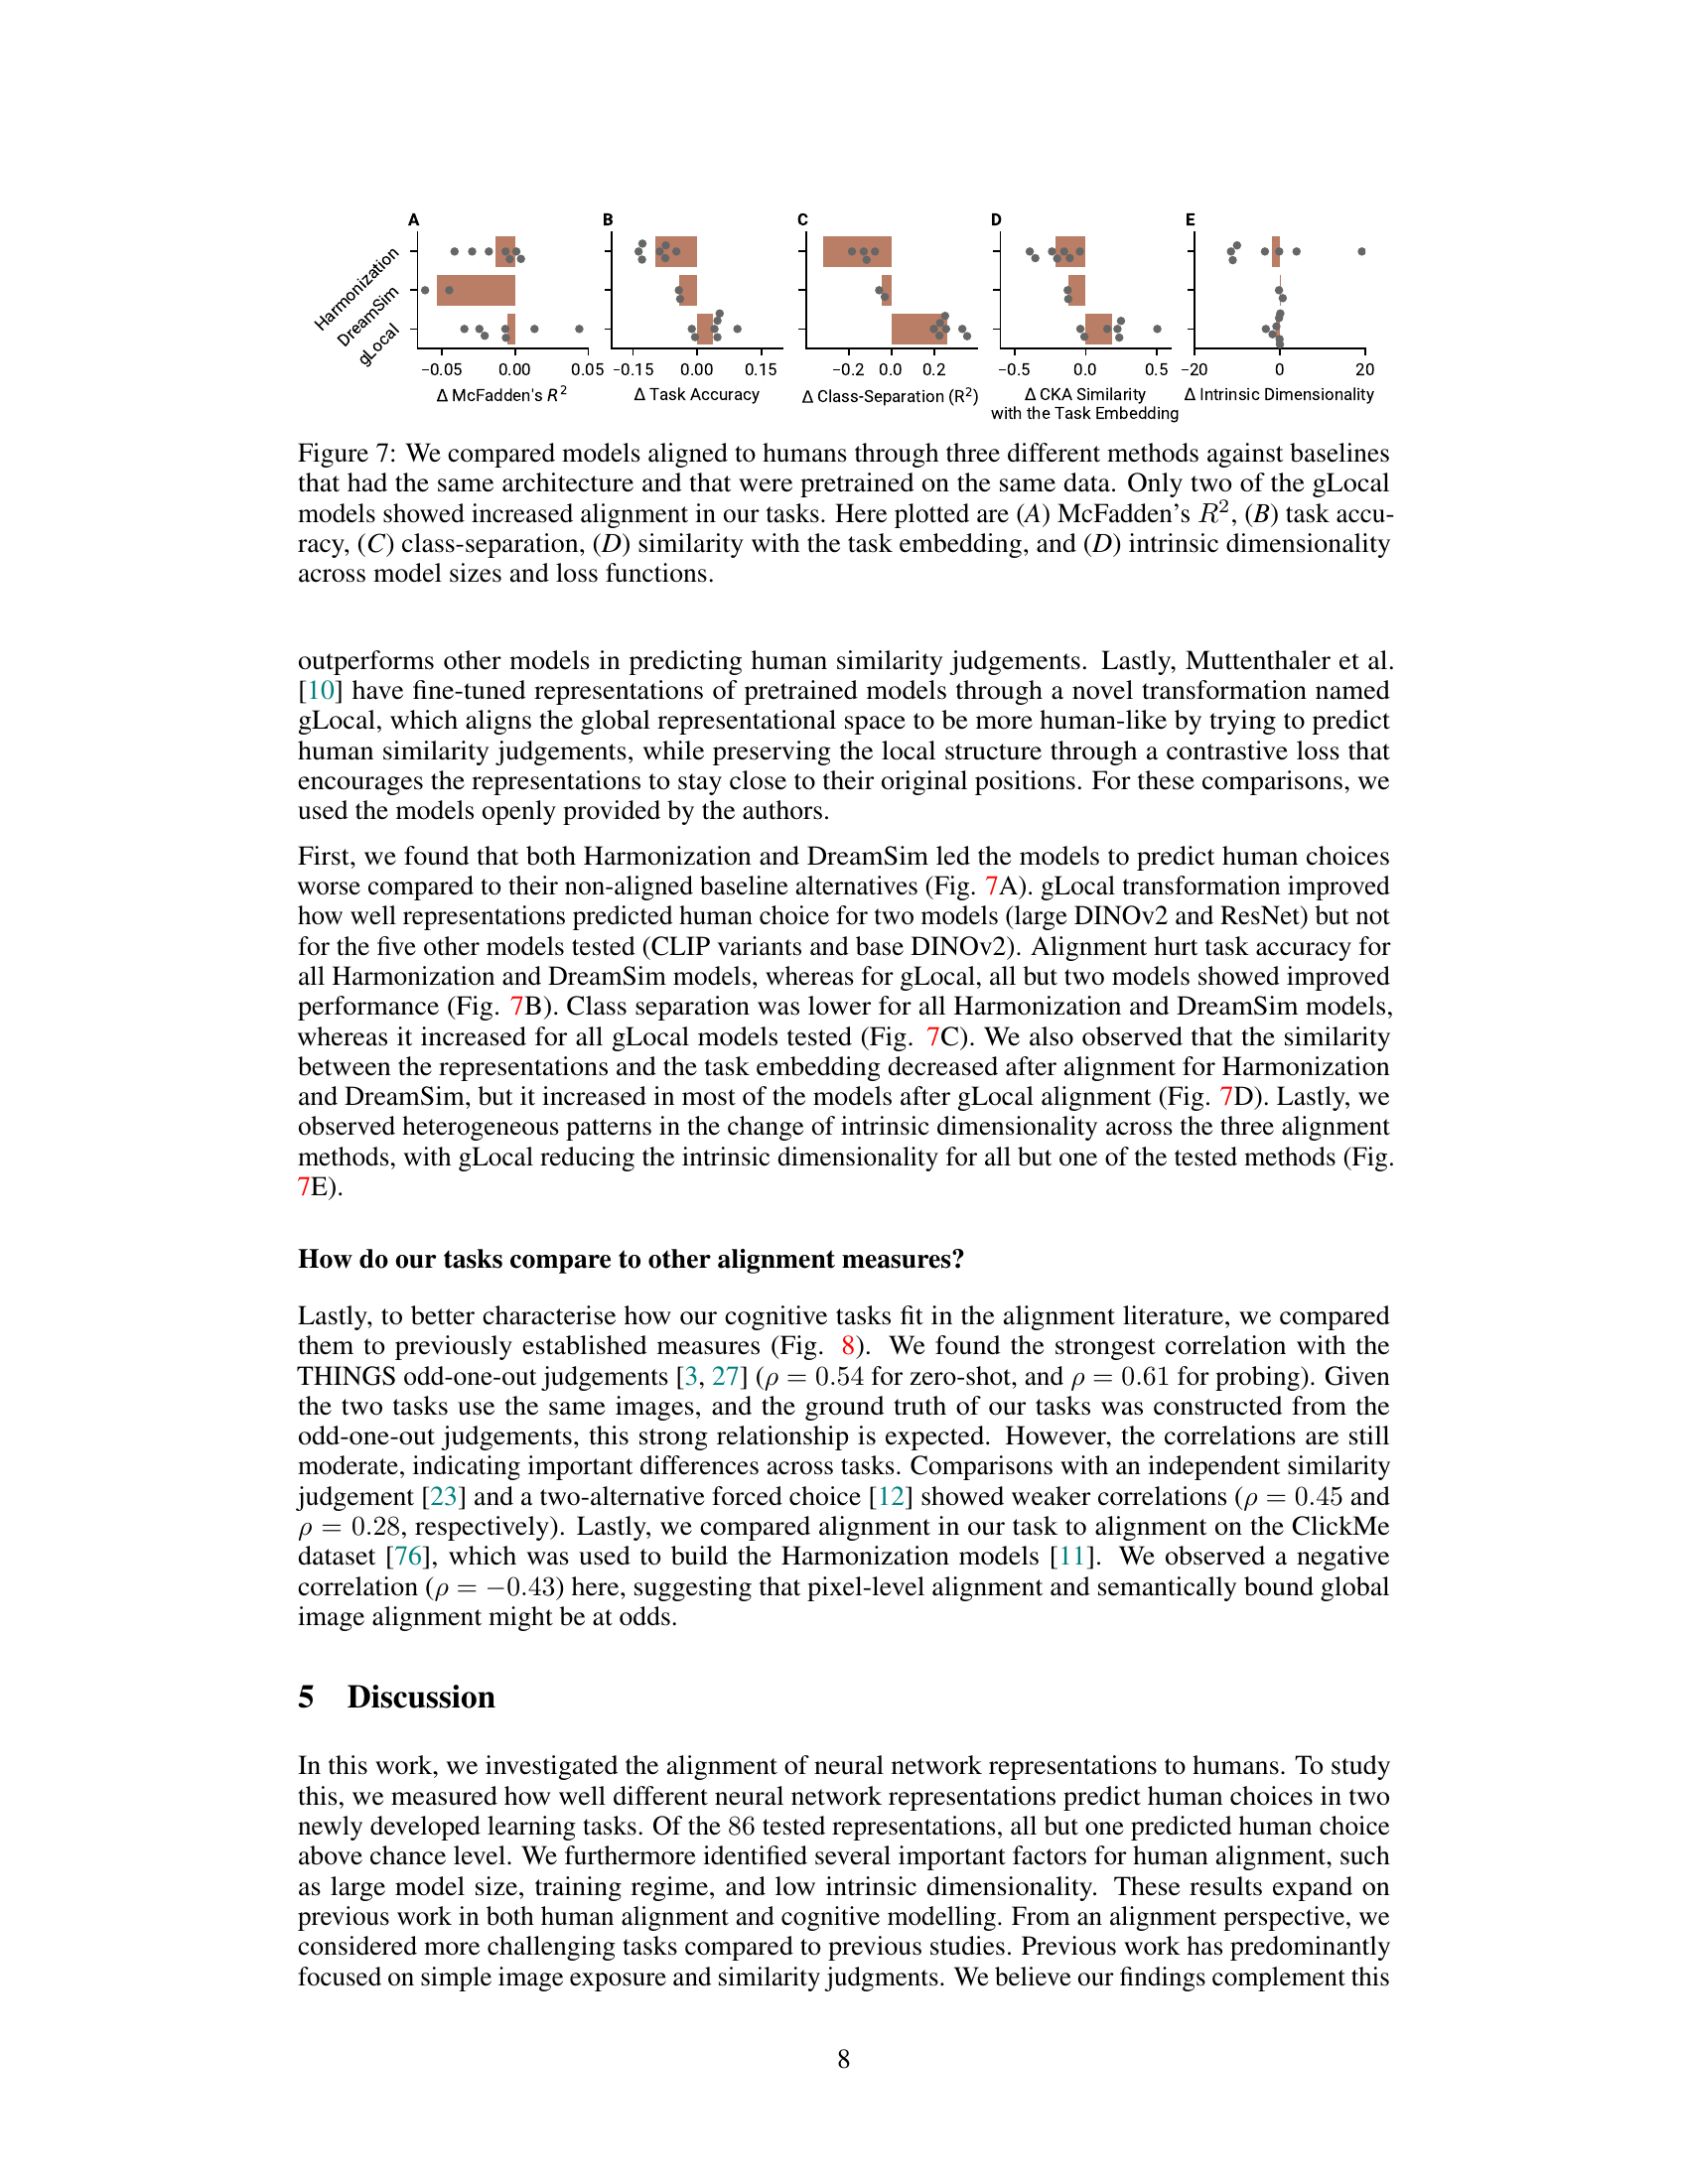
🔼 This figure compares the performance of three different human-aligned models (Harmonization, DreamSim, and gLocal) against their baselines across various metrics. The metrics include McFadden’s R2 (a measure of model fit), task accuracy, class separation (how well the model separates different classes in its representations), CKA similarity with the task embedding (how similar the model’s representation is to the task’s features), and intrinsic dimensionality (a measure of the complexity of the model’s representation). The results show that only some gLocal models exhibit improved alignment compared to their baselines, suggesting the effectiveness of human alignment techniques is highly dependent on the method and model used.
read the caption
Figure 7: We compared models aligned to humans through three different methods against baselines that had the same architecture and that were pretrained on the same data. Only two of the gLocal models showed increased alignment in our tasks. Here plotted are (A) McFadden's R2, (B) task accuracy, (C) class-separation, (D) similarity with the task embedding, and (D) intrinsic dimensionality across model sizes and loss functions.
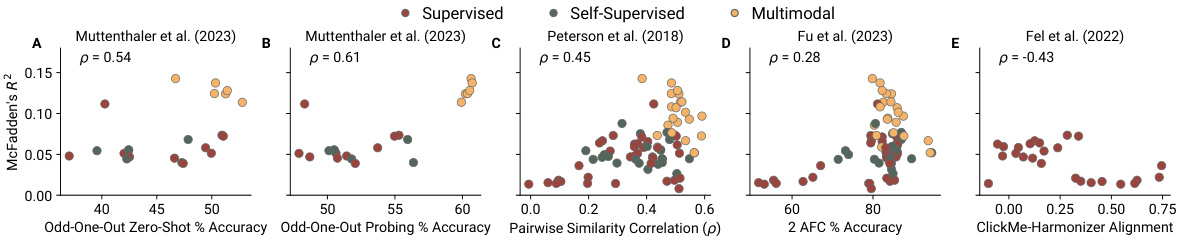
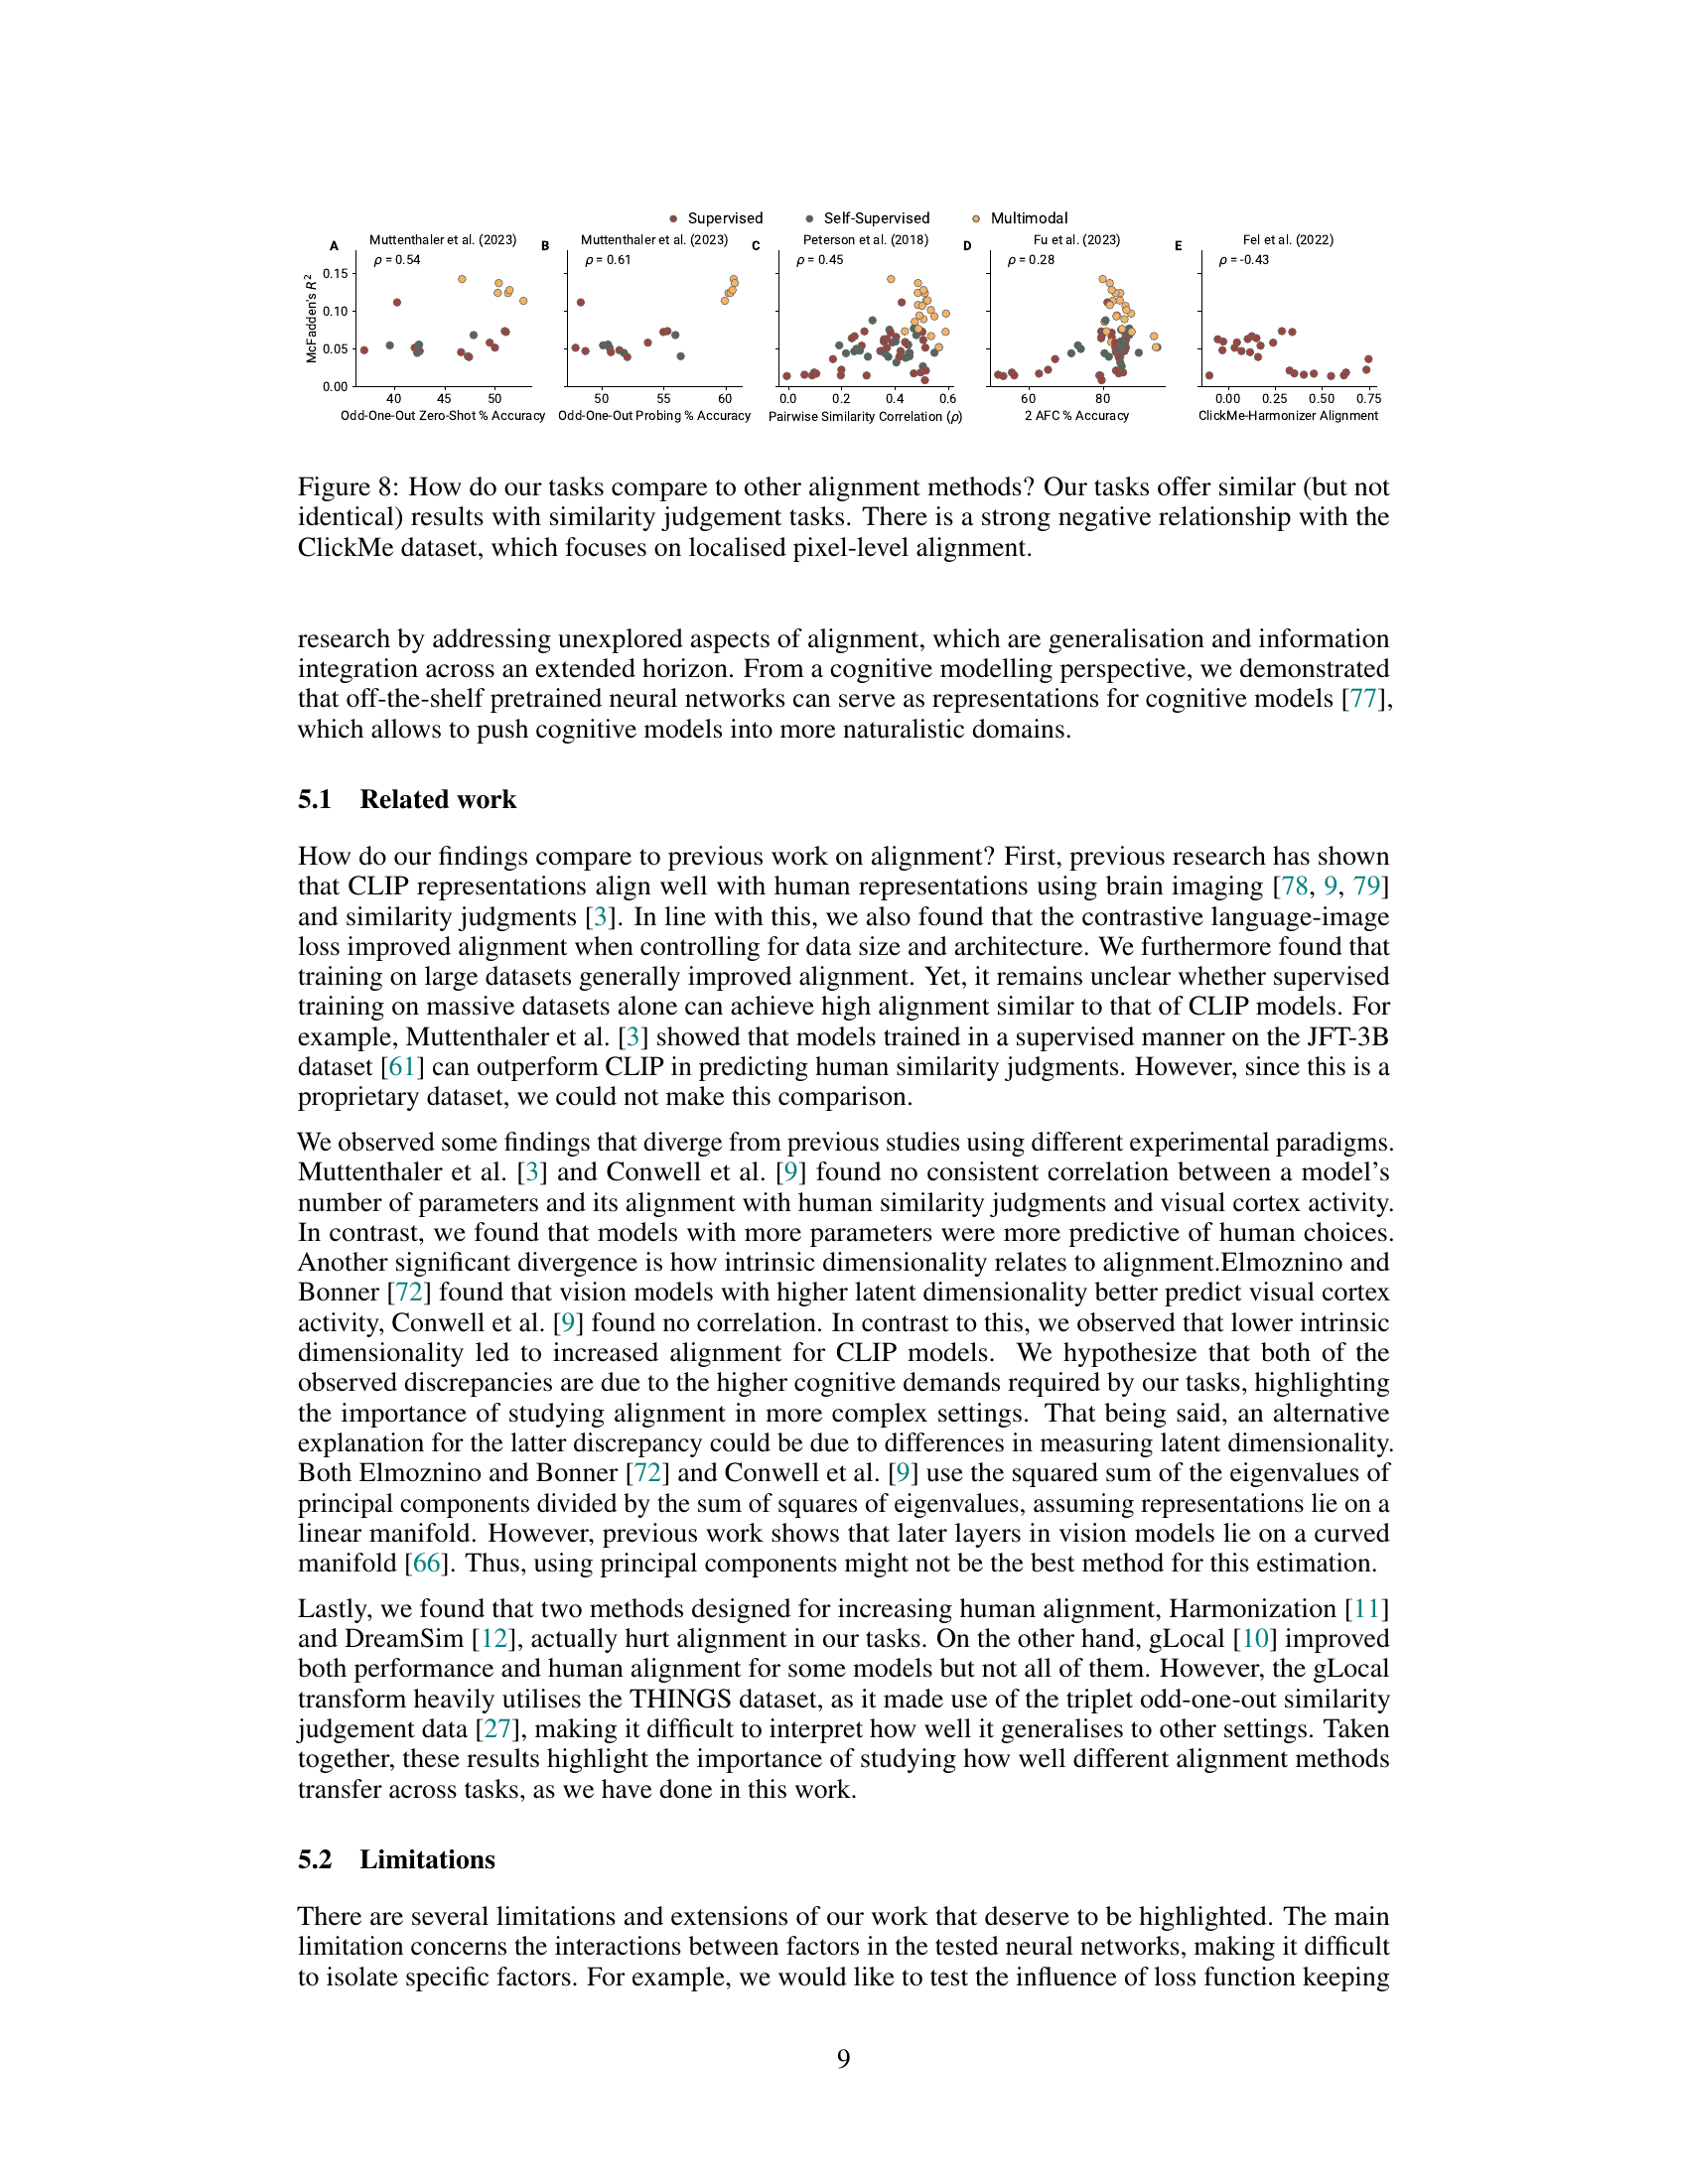
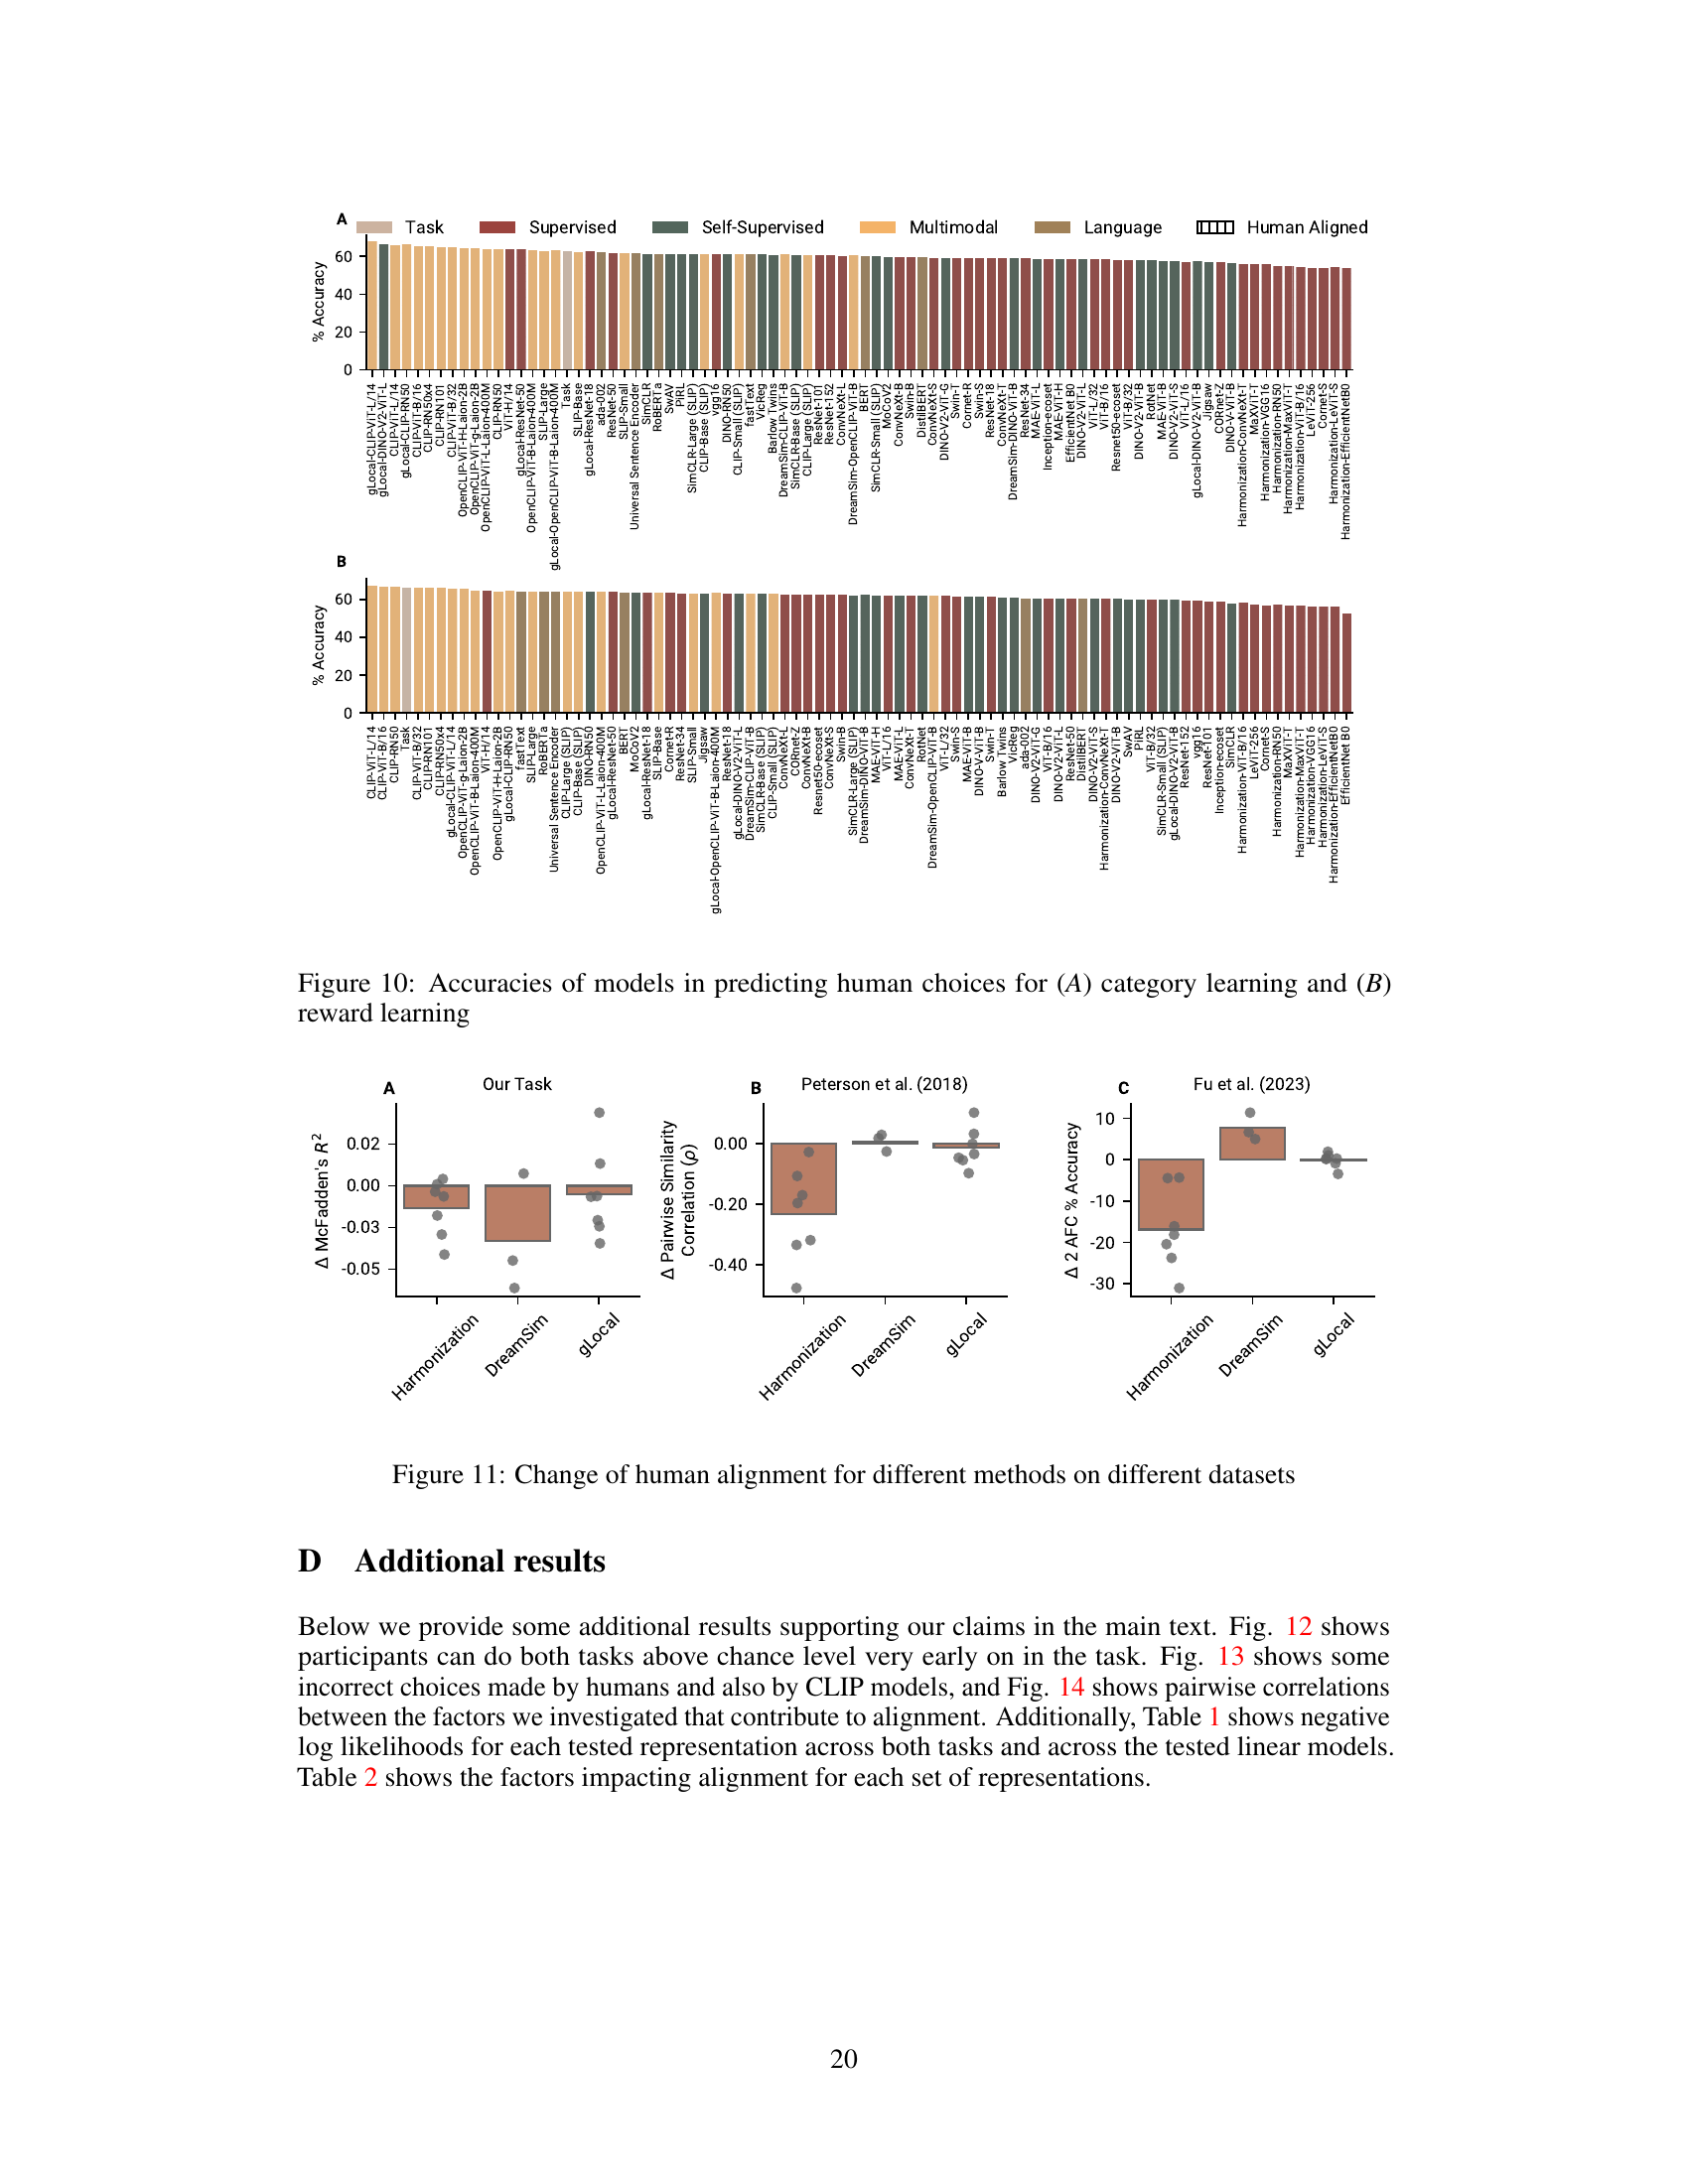
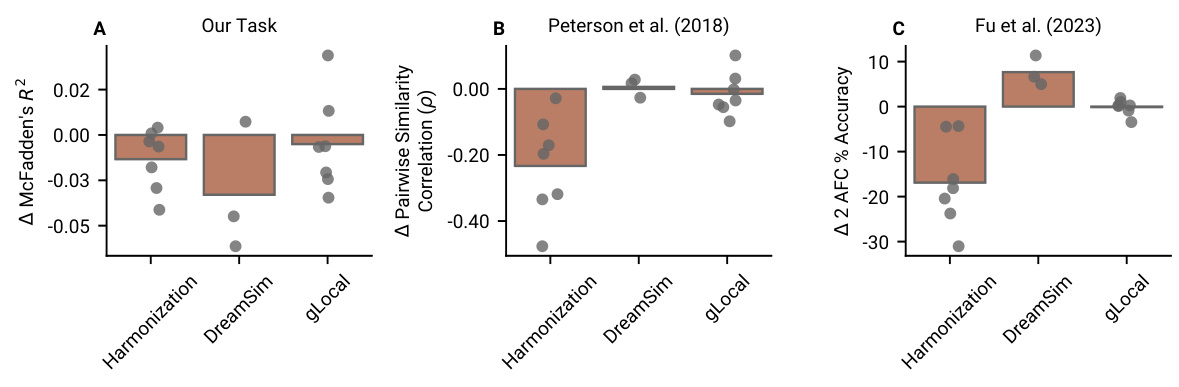
🔼 This figure shows the correlation between the alignment scores obtained from the authors’ proposed tasks and those obtained from other established alignment methods in the literature. The methods used for comparison include: Muttenthaler et al. (2023) odd-one-out zero-shot and probing accuracy, Peterson et al. (2018) pairwise similarity correlation, Fu et al. (2023) two-alternative forced-choice accuracy, and Fel et al. (2022) ClickMe-harmonizer alignment. The results indicate that the authors’ tasks show stronger correlations with similarity judgment tasks and a negative correlation with pixel-level alignment measures.
read the caption
Figure 8: How do our tasks compare to other alignment methods? Our tasks offer similar (but not identical) results with similarity judgement tasks. There is a strong negative relationship with the ClickMe dataset, which focuses on localised pixel-level alignment.
🔼 This figure shows the performance of various neural network models in predicting human choices in two tasks: category learning and reward learning. The McFadden’s R-squared (R2) values represent the goodness of fit, with higher values indicating better alignment with human behavior. The figure highlights that CLIP models generally outperform other models, even exceeding the performance of the generative features used to create the tasks. The performance of supervised, self-supervised, and language models is more varied.
read the caption
Figure 3: Model fits to human choice data. In both category learning (A) and reward learning tasks (B), several CLIP models predict human choices the best, even better than the generative features of the tasks. How well the models fitted human choice was more heterogeneously distributed for supervised, self-supervised, and language models. Plotted are the cross-validated McFadden's R2 of each representation for the category learning and the reward learning tasks respectively. Higher values indicate better fits to human behaviour. 0 marks the alignment of a random model.
🔼 This figure shows the performance of various neural network models in predicting human choices in two tasks: category learning and reward learning. The model performance is measured using McFadden’s R-squared, which indicates the goodness of fit. CLIP models consistently outperformed other model types, suggesting their representations are highly aligned with human decision-making processes. The figure also reveals that alignment varied significantly across different model training approaches.
read the caption
Figure 3: Model fits to human choice data. In both category learning (A) and reward learning tasks (B), several CLIP models predict human choices the best, even better than the generative features of the tasks. How well the models fitted human choice was more heterogeneously distributed for supervised, self-supervised, and language models. Plotted are the cross-validated McFadden's R2 of each representation for the category learning and the reward learning tasks respectively. Higher values indicate better fits to human behaviour. 0 marks the alignment of a random model.
🔼 This figure compares the performance of three human-aligned models (Harmonization, DreamSim, and gLocal) against their respective baselines across various metrics (McFadden’s R2, task accuracy, class separation, similarity with the task embedding, and intrinsic dimensionality) for two naturalistic learning tasks (category and reward learning). The results show that only some gLocal models exhibited improved alignment compared to their baselines, while others showed either no improvement or even a decrease in alignment.
read the caption
Figure 7: We compared models aligned to humans through three different methods against baselines that had the same architecture and that were pretrained on the same data. Only two of the gLocal models showed increased alignment in our tasks. Here plotted are (A) McFadden’s R2, (B) task accuracy, (C) class-separation, (D) similarity with the task embedding, and (D) intrinsic dimensionality across model sizes and loss functions.
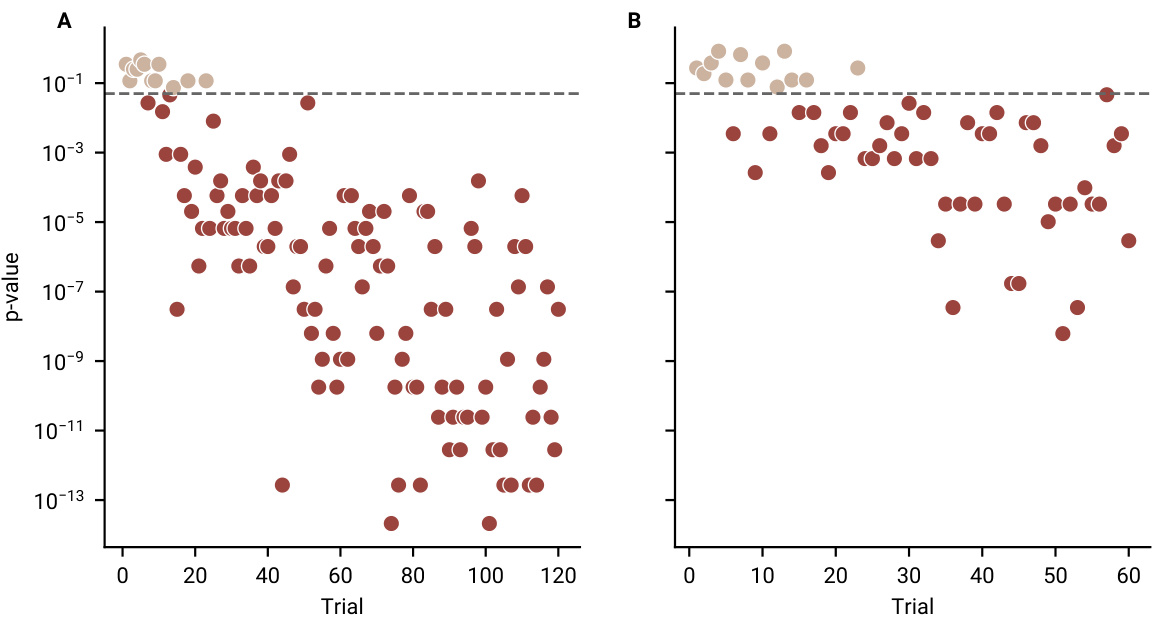
🔼 The figure shows the results of 1-sample t-tests comparing participants’ performance to chance level for each trial in both the category learning and reward learning tasks. The x-axis represents the trial number, and the y-axis shows the p-value. The dashed horizontal line indicates the significance threshold (p=0.05). Points above the line indicate that the participants’ performance was not significantly different from chance in that trial, while those below represent trials where the participants performed significantly above chance. The plot illustrates how quickly participants learned to perform above chance in both tasks.
read the caption
Figure 12: Participant Performance Against Chance Level at Each Trial. Trial-by-trial p-values from 1 sample t-tests testing accuracy against chance level for (A) category learning task and the (B) reward learning task.
🔼 This figure displays example trials from the category and reward learning tasks, highlighting instances where both CLIP models and human participants made the same incorrect choices. These examples illustrate scenarios where the choices made deviate from those predicted by the task’s generative embedding, demonstrating the complexities involved in aligning human decisions with model predictions.
read the caption
Figure 13: Example trials showing the similarity between CLIP and human decisions that show disagreement with the task embedding. Each row shows three trials from a different condition. Orange highlighted text shows the option chosen by all CLIP models and the human participant, whereas grey text shows the decision made by the task embedding. As the tasks were generated using the task embedding, all the choices shown here made by CLIP and humans are suboptimal. Shown examples are from the second half of the task, as to eliminate the learning process as a confound. The original images are replaced with copyright-free alternatives from the THINGSplus database [89].
🔼 This figure shows the results of an analysis investigating factors that contribute to the alignment between human choices and neural network model predictions. Panel A shows the relationship between task accuracy and model parameters, training images, class separation (R2), CKA similarity to task embeddings, and intrinsic dimensionality. Panels B-F depict these relationships individually, with statistical significance (p-values) indicated for each correlation. The results suggest that models with more parameters, trained on larger datasets, with better class separation, and greater similarity to human representations achieve better alignment.
read the caption
Figure 4: Several factors contribute to alignment. Models trained on more data and with more trainable parameters predict human choices with higher accuracy. Turning to representations, those that better separate image classes and are more similar to the generative task features exhibit stronger alignment with human choices.
More on tables
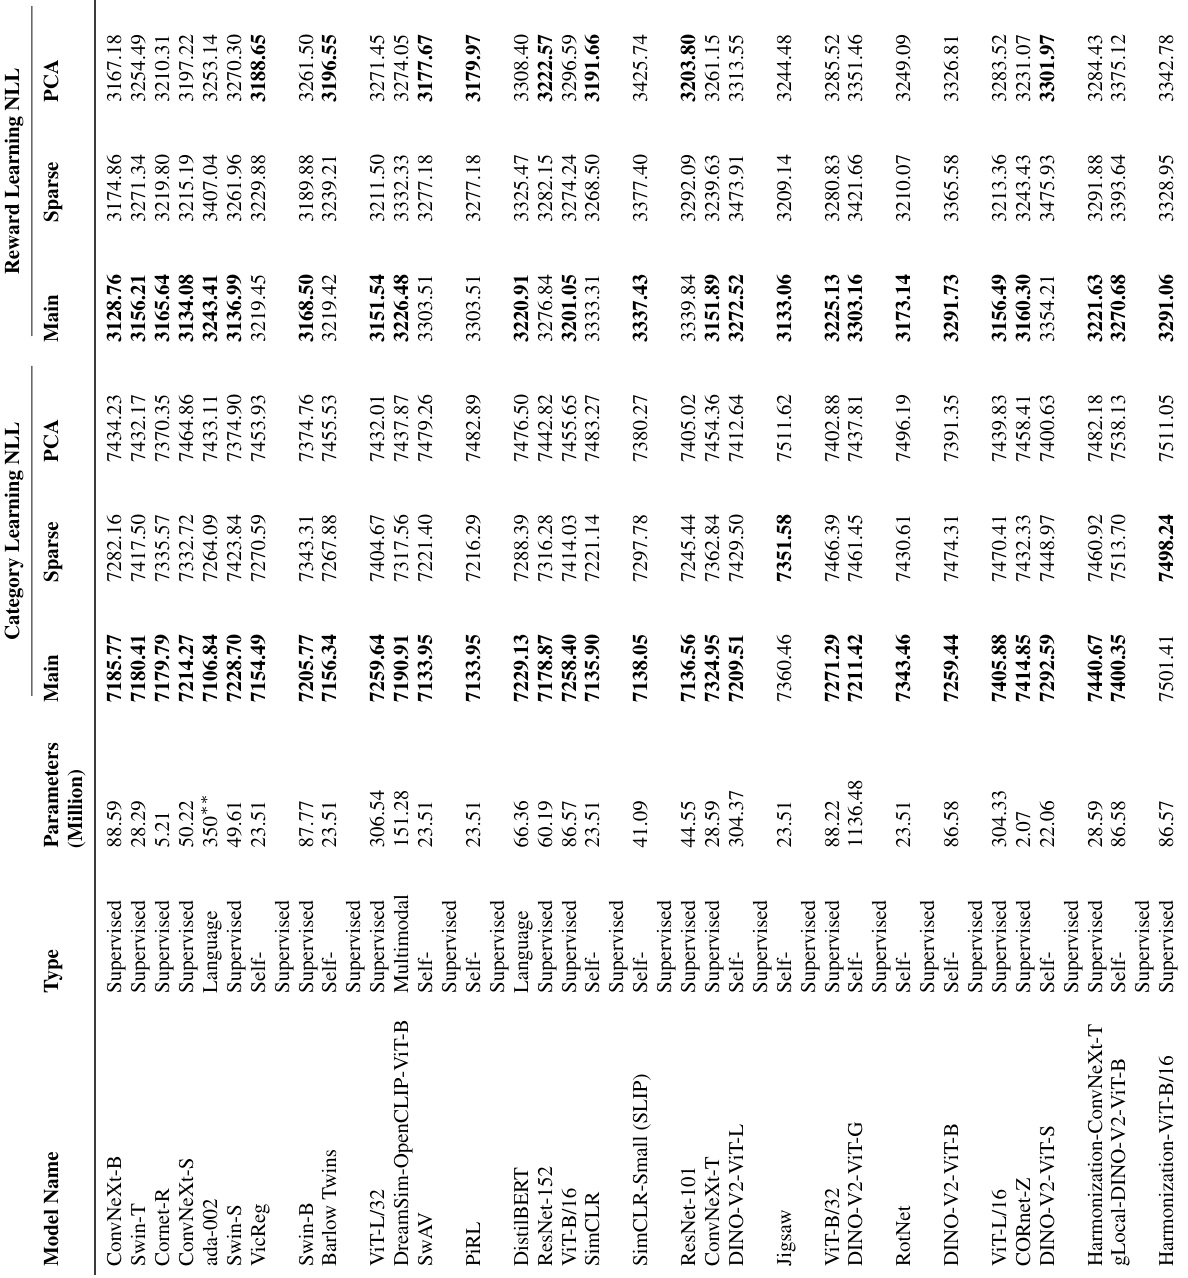
🔼 This table presents detailed information about the 86 pretrained neural network models used in the study. For each model, it lists the type (Supervised, Self-Supervised, Multimodal, Language), the number of parameters (in millions), and the negative log-likelihood (NLL) scores for both the category and reward learning tasks. The NLL is a measure of how well the model’s predictions fit the human data. Lower NLL values indicate better fits. The table also shows results from three variations of the model training processes (Main, Sparse, PCA) to explore the impact of different training methods on model performance and alignment with human behaviour.
read the caption
Table 1: Details on Models and Model Performance. Here, we report the model size, the type, and the negative log-likelihoods (NLL) for different tasks and different learning models. For a given representation and task, the best-performing learning model's NLL is highlighted in bold. The models are ordered such that the ones reported higher have lower negative log likelihoods across the two asks, as measured through the performance of the linear models reported in the main text.

🔼 This table presents detailed information about the 86 pretrained neural network models used in the study. It includes the model name, type (supervised, self-supervised, multimodal, or language), number of parameters (in millions), and the negative log-likelihood (NLL) for each model on both the category learning and reward learning tasks. The NLL measures how well each model predicts human choices in the respective tasks. Lower NLL values indicate better predictive performance. The models are ranked according to their overall performance (combined NLL across both tasks).
read the caption
Table 1: Details on Models and Model Performance. Here, we report the model size, the type, and the negative log-likelihoods (NLL) for different tasks and different learning models. For a given representation and task, the best-performing learning model’s NLL is highlighted in bold. The models are ordered such that the ones reported higher have lower negative log likelihoods across the two asks, as measured through the performance of the linear models reported in the main text.
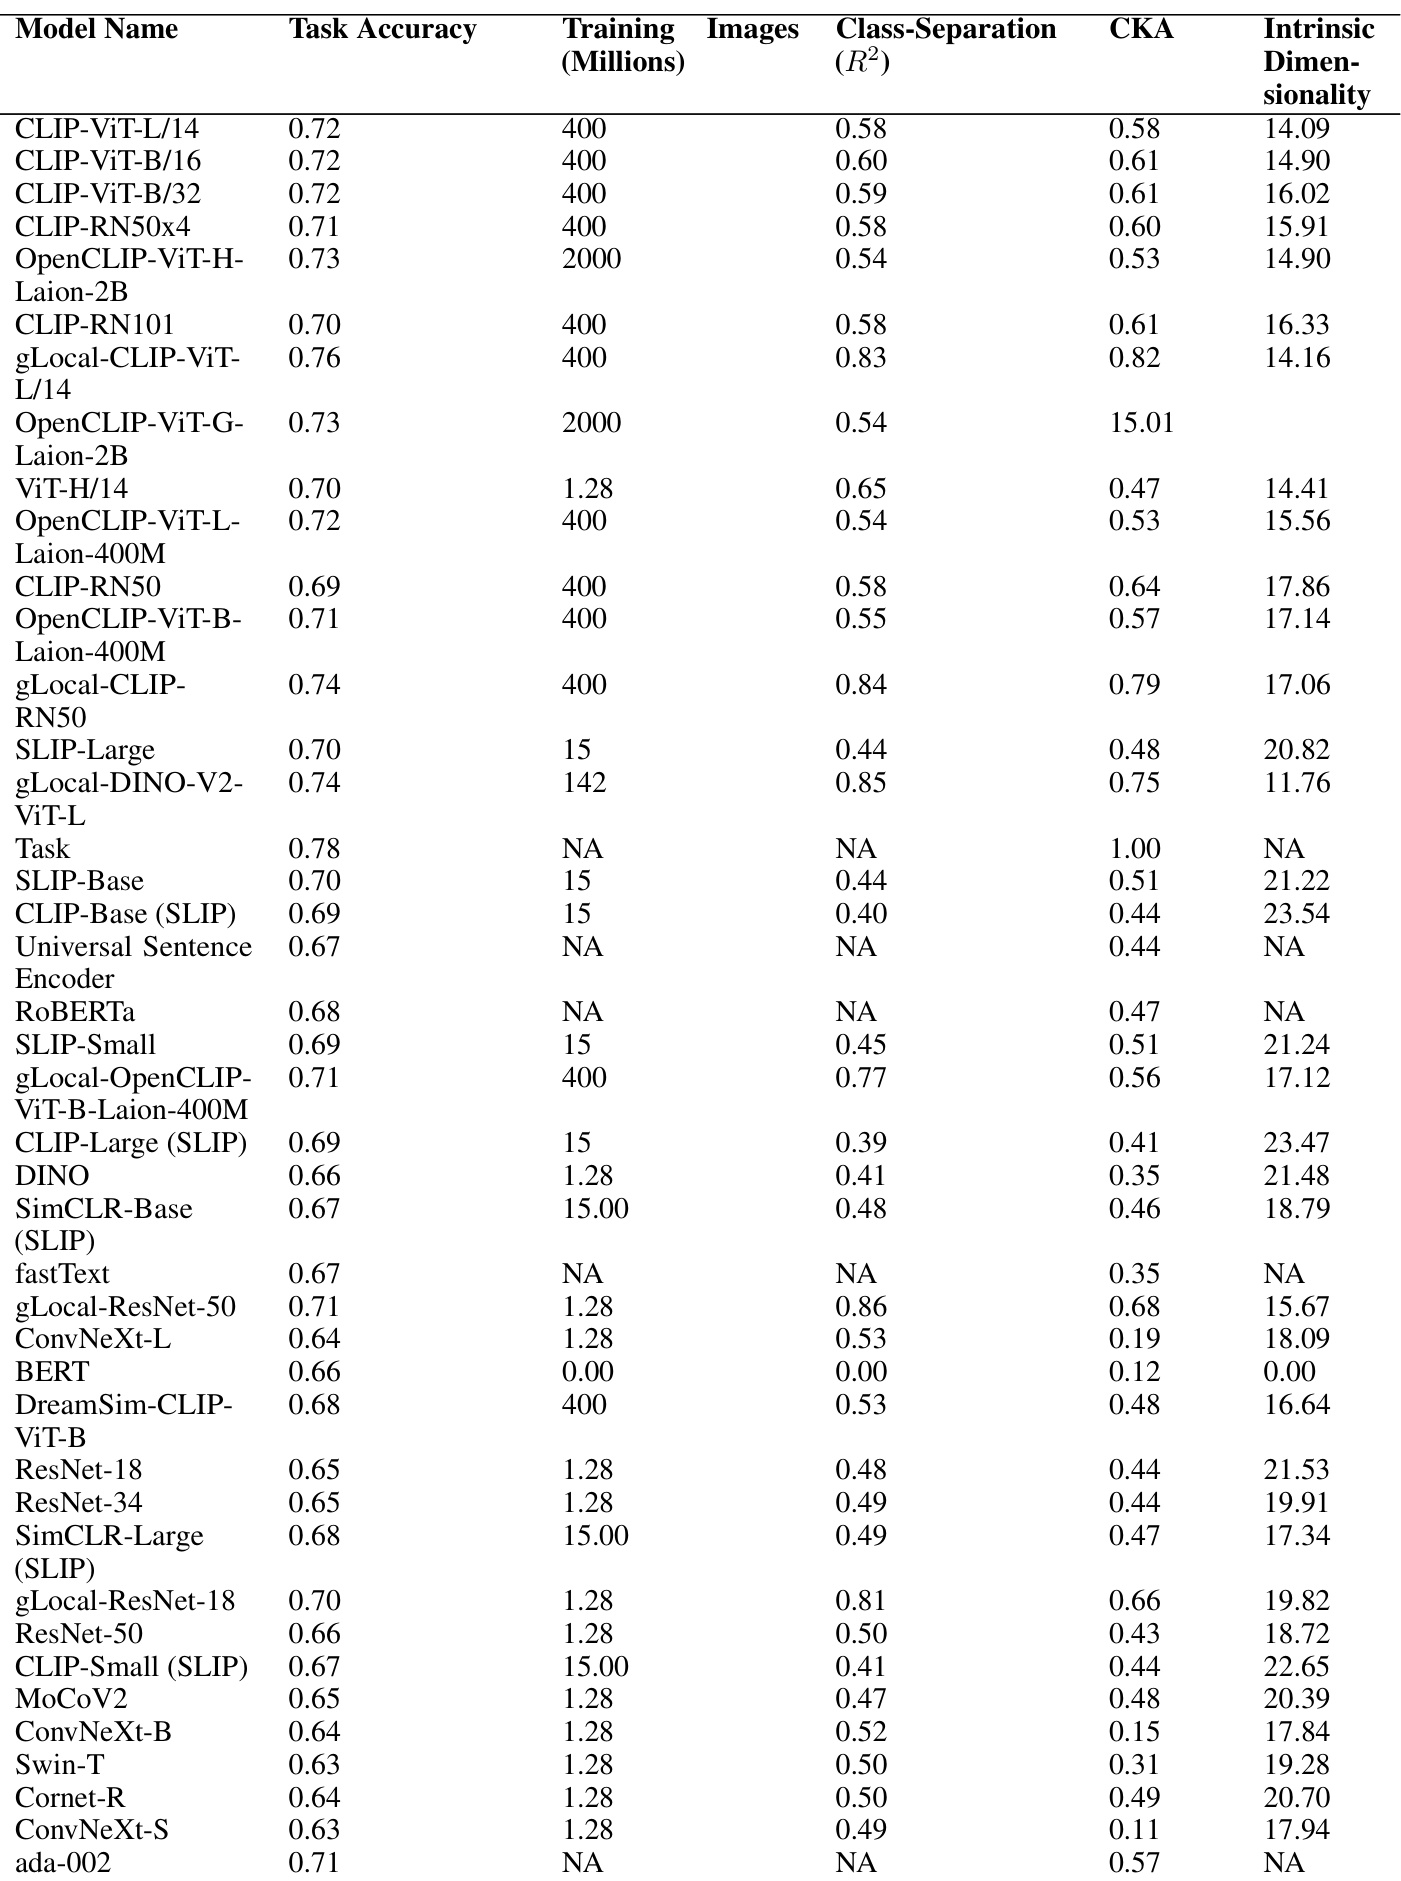
🔼 This table presents the results of an analysis investigating the factors that contribute to the alignment of neural network representations with human choices. For a range of neural network models, the table shows task accuracy, training image size, class separation (R2), centered kernel alignment (CKA) similarity with task embedding, and intrinsic dimensionality. This allows for a comparison of the various factors’ influence on the level of alignment between human choices and model predictions.
read the caption
Table 2: Investigated factors that contribute to alignment for each model
🔼 This table presents a detailed breakdown of the factors contributing to the alignment of various neural network models with human performance in the image-based learning tasks. For each model, it lists its type (supervised, self-supervised, multimodal, or language), the number of parameters (in millions), the task accuracy, the number of training images (in millions), the class separation (R2), the Centered Kernel Alignment (CKA) similarity with the task embedding, and the intrinsic dimensionality. This allows for a comparison of different model characteristics and their relative impact on alignment.
read the caption
Table 2: Investigated factors that contribute to alignment for each model
Full paper#