TL;DR#
Current multimodal models like CLIP and Stable Diffusion exhibit impressive “zero-shot” performance on downstream tasks. However, the extent to which their pretraining data encompasses these downstream concepts remains unclear. This raises questions about the true meaning of “zero-shot” generalization for these models. The existing notion of “zero-shot” learning is largely an artifact of the massive amount of data used in pretraining, which contains many concepts later used for evaluation.
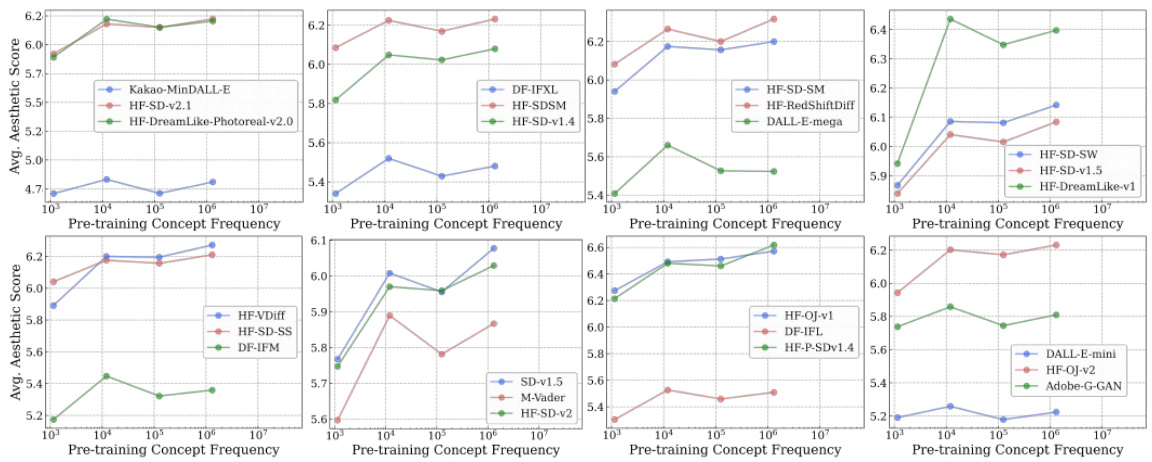
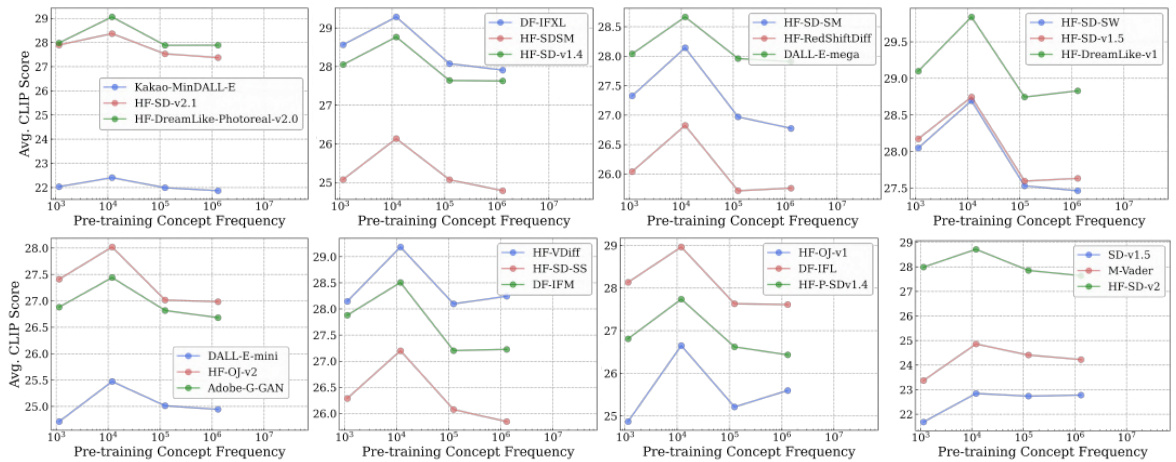
This paper investigates the relationship between the performance of multimodal models and the frequency of concepts in their pretraining datasets. They empirically demonstrate a log-linear scaling trend: a model needs exponentially more data to achieve linearly better performance on a downstream task, even when controlling for other factors. Their analysis reveals that the distribution of concepts in the pretraining data is heavily long-tailed, leading to poor performance on rare concepts. To further research in this direction, the authors introduce “Let It Wag!” a new benchmark dataset designed to test model performance on long-tail concepts.
Key Takeaways#
Why does it matter?#
This paper is crucial because it challenges the prevailing assumptions about “zero-shot” capabilities in multimodal models. By revealing the exponential data dependency underlying apparent zero-shot performance, it redirects research towards more realistic and effective training paradigms. It also introduces a valuable benchmark dataset, Let It Wag!, for testing long-tail concept generalization. This work is highly relevant for researchers in computer vision, natural language processing, and multimodal learning.
Visual Insights#

🔼 This figure illustrates the process of concept extraction and frequency estimation used in the paper. The left side shows how 4029 concepts are collected from 27 different downstream datasets. The right side details how those concepts are identified within pretraining datasets. It begins by creating indices for text (using unigram indexing) and image (using RAM++) searches. Finally, by intersecting the results of both text and image searches, the matched image-text frequencies for each concept are computed.
read the caption
Figure 1: Concept Extraction and Frequency Estimation. (left) We compile 4, 029 concepts from 27 evaluation datasets. (right) We construct efficient indices for text-search (unigram indexing (1)) and image-search (RAM++ (2)); intersecting hits from both gives (3) image-text matched frequencies.

🔼 This table lists the pretraining datasets used for training CLIP models and the downstream datasets used for evaluating their performance on image classification and retrieval tasks. The pretraining datasets represent large-scale image-text corpora used to initialize the CLIP models, each with different scales, data collection methods, and sources. The downstream datasets are smaller, curated datasets representing specific tasks (classification or retrieval) and cover a variety of object categories, scenes, and camera types. This diversity allows researchers to assess the generalizability of the pretrained CLIP models across a range of tasks and data characteristics.
read the caption
Table 1: Pretraining and downstream datasets used in Image-Text (CLIP) experiments.
In-depth insights#
Frequency’s Role#
The research paper’s central argument revolves around the profound impact of concept frequency within pretraining datasets on the performance of multimodal models. The ‘Frequency’s Role’ isn’t explicitly a heading, but it’s the paper’s core theme. The authors compellingly demonstrate that performance isn’t a matter of zero-shot generalization, but rather a direct reflection of how often concepts appear during training. Models struggle with rare concepts, exhibiting exponential data requirements for even linear performance improvements. This challenges the notion of zero-shot learning and highlights the importance of data-centric analysis in developing more robust and generalizable multimodal AI. The study introduces a new benchmark dataset, Let it Wag!, specifically designed to expose this long-tail bias in model performance, prompting further research into sample-efficient training strategies and fairer data representation.
Log-linear Scaling#
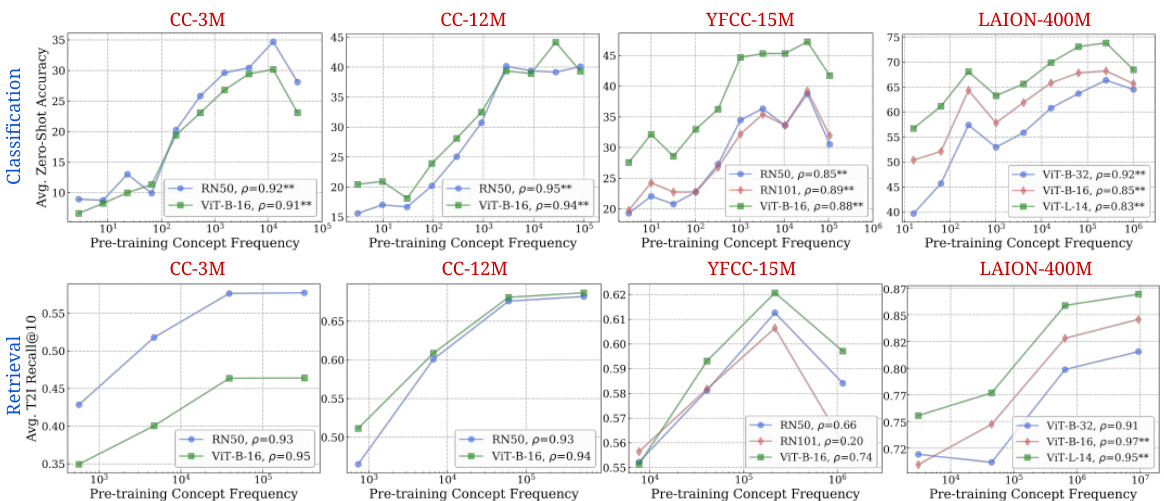
The concept of “log-linear scaling” in the context of multimodal models reveals a crucial insight into the relationship between model performance and the frequency of concepts present in their pretraining data. The findings indicate that improvements in zero-shot performance on downstream tasks are not linear with the increase in training data but rather follow a logarithmic trend. This implies that achieving even marginal gains in performance for rarely seen or new concepts during testing requires an exponentially larger amount of training data. This sample inefficiency is a fundamental challenge for achieving true zero-shot generalization in these models. The authors’ work highlights the significant implications of data scarcity, particularly for long-tail phenomena, and provides strong evidence that the success of multimodal models in zero-shot settings isn’t due to true generalization, but rather a reflection of the extensive representation of common concepts in massive training datasets. This underscores the need for novel strategies to address this fundamental limitation of current paradigms in multimodal model training.
Long-tailed Datasets#
The concept of long-tailed datasets is crucial in evaluating the robustness and generalizability of machine learning models. Real-world data often exhibits a long-tail distribution, where a few classes have numerous examples while many other classes have only a few. Standard benchmarks typically focus on head classes, neglecting the tail, which is problematic. This paper highlights the significant performance drop-off in multimodal models when tested on long-tail data. This indicates a critical limitation in current training paradigms, demonstrating a lack of effective generalization to underrepresented concepts. Addressing this challenge requires developing new training strategies and evaluation metrics to better assess model performance on long-tail scenarios. The work introduced a novel long-tail benchmark dataset called ‘Let It Wag!’ to encourage further research in this direction, emphasizing the need for improved methods of generalization and data augmentation techniques.
Zero-shot Fallacy#
The concept of “zero-shot” in multimodal models, implying generalization to unseen data without explicit training, is a fallacy revealed by this research. The paper’s core argument is that impressive zero-shot performance hinges on the frequency of concepts in pretraining data. Models don’t magically generalize; they perform well on downstream tasks because those tasks’ concepts are already extensively represented in the pretraining data. This implies that the seemingly impressive capabilities are not true zero-shot generalization, but rather a consequence of massive pretraining scale and the inherent bias of web-crawled data towards frequently occurring concepts. The observed log-linear scaling between pretraining concept frequency and downstream performance powerfully demonstrates this point, showing a sample inefficiency where exponentially more data is needed for linear improvements in zero-shot accuracy. This finding has significant implications for understanding the true capabilities of multimodal models and necessitates a shift in focus towards addressing data imbalance and achieving genuine zero-shot capabilities.
Let It Wag! Benchmark#
The “Let It Wag!” benchmark is a crucial contribution, addressing the limitations of current multimodal models’ performance on long-tail data. It highlights the exponential relationship between pretraining concept frequency and zero-shot performance, demonstrating the inadequacy of current models in handling rare concepts. The benchmark consists of a carefully curated dataset featuring 290 underrepresented concepts, forcing a critical evaluation of models beyond their performance on frequent data. The dataset’s long-tailed distribution underscores the need for more data-efficient training paradigms and pushes the field toward improved generalization capabilities. Let It Wag! serves as a strong call to action for researchers to develop models robust to the inherent biases present in large-scale web-crawled datasets and to create training techniques that address the long-tail effectively. Its public availability allows for broader investigation into data-centric approaches, ultimately improving the capabilities and fairness of multimodal models.
More visual insights#
More on figures

🔼 This figure displays the strong correlation between the frequency of a concept in the pretraining dataset and the performance of CLIP models on that concept in zero-shot classification and retrieval tasks. The log-linear relationship observed is consistent across different model architectures and pretraining datasets.
read the caption
Figure 2: Log-linear relationships between concept frequency and CLIP zero-shot performance. Across all tested architectures (RN50, RN101, ViT-B-32, ViT-B-16, ViT-L-14) and pretraining datasets (CC-3M, CC-12M, YFCC-15M, LAION-400M), we observe a consistent linear relationship between CLIP's zero-shot performance on a concept and the log-scaled pretraining concept frequency. This trend holds for both zero-shot classification (results averaged across 17 datasets) and image-text retrieval (results averaged across 2 datasets). ** indicates that the result is significant (p < 0.05 with a two-tailed t-test [118]), and thus we show Pearson correlation (p) [73] as well.
🔼 This figure shows the consistent log-linear relationship between a concept’s frequency in the pretraining dataset and the zero-shot performance of CLIP models across various architectures and pretraining datasets. The linear trend is observed for both classification and retrieval tasks, indicating that models perform better on concepts that are more frequent in their training data. Statistical significance (p<0.05) is indicated for the correlations.
read the caption
Figure 2: Log-linear relationships between concept frequency and CLIP zero-shot performance. Across all tested architectures (RN50, RN101, ViT-B-32, ViT-B-16, ViT-L-14) and pretraining datasets (CC-3M, CC-12M, YFCC-15M, LAION-400M), we observe a consistent linear relationship between CLIP's zero-shot performance on a concept and the log-scaled pretraining concept frequency. This trend holds for both zero-shot classification (results averaged across 17 datasets) and image-text retrieval (results averaged across 2 datasets). ** indicates that the result is significant (p < 0.05 with a two-tailed t-test [118]), and thus we show Pearson correlation (p) [73] as well.

🔼 This figure shows two sets of graphs that further support the log-linear relationship between concept frequency and model performance. The left graphs control for sample similarity between the pretraining and testing datasets. The right graphs test the relationship using a synthetic pretraining data distribution, demonstrating robustness.
read the caption
Figure 4: Stress-testing the log-linear scaling trends. We provide further evidence for the log-linear relationship between performance and concept frequency, across different scenarios: (left) we control for 'similarity' between downstream test sets and pretraining datasets, and (right) we conduct experiments on an entirely synthetic pretraining distribution with no real-world images or captions.

🔼 This figure shows the distribution of concept frequencies in five large-scale image-text pretraining datasets. The x-axis represents the concepts (sorted in descending order of frequency), and the y-axis represents the normalized frequency of those concepts. The plots show that the distribution of concept frequencies is highly skewed towards a long tail, meaning that a large proportion of concepts are rare (appear infrequently in the datasets). This long-tailed distribution is consistent across all five datasets (CC-3M, CC-12M, YFCC-15M, LAION-400M, and LAION-Aesthetics), and it highlights the fact that most of the concepts in these pretraining datasets are infrequent, even though these datasets are very large.
read the caption
Figure 5: Concept distribution of pre-training datasets is highly long-tailed. We showcase the distribution of pretraining frequencies of all concepts aggregated across all 17 of our downstream classification datasets. Across all the pretraining datasets, we observe very heavy tails. We normalize the concept frequencies and remove concepts with 0 counts for improved readability of the plots.

🔼 This figure shows the accuracy of 40 CLIP models on the ImageNet dataset and the newly introduced Let It Wag! dataset. The Let It Wag! dataset consists of long-tailed concepts that are underrepresented in typical training datasets. The figure reveals a significant performance drop for all models on Let It Wag! compared to ImageNet. Interestingly, the performance gap between the two datasets is smaller for models with a larger number of parameters, suggesting that model capacity plays a role in handling long-tailed distributions.
read the caption
Figure 6: Large-drops in accuracy on “Let It Wag!”. Across 40 tested CLIP models, we note large performance drops compared to ImageNet. Further, the performance gap seems to decrease for high-capacity models as demonstrated by larger positive slope (1.58) for those models.

🔼 This figure shows qualitative results on the ‘Let It Wag!’ dataset, which focuses on long-tail concepts. Four prompts per concept were created using Gemini and GPT-4, and then used with three different Stable Diffusion models to generate images. The borders on the generated images indicate whether the image is correct (green), incorrect (red), or ambiguous (yellow). The figure highlights the challenges that state-of-the-art T2I models still face when generating images of rare or unusual concepts.
read the caption
Figure 7: Qualitative results on “Let It Wag!” concepts demonstrate failure cases of T2I models on the long-tail. We created 4 prompts for each concept using Gemini [121] and GPT-4 [12] which are fed to 3 Stable Diffusion [104] models. Generations with red border are incorrect, green border are correct and yellow border are ambiguous. Despite advances in high-fidelity image generation, there is large scope for improvement for such long-tail concepts (quantitative results in Appx. N.1).

🔼 This figure shows the strong correlation between a concept’s frequency in the pretraining dataset and the model’s zero-shot performance on that concept across various CLIP models and datasets. The consistent log-linear relationship observed demonstrates that better performance is strongly linked to more frequent exposure to the concept during pretraining, rather than true zero-shot generalization.
read the caption
Figure 2: Log-linear relationships between concept frequency and CLIP zero-shot performance. Across all tested architectures (RN50, RN101, ViT-B-32, ViT-B-16, ViT-L-14) and pretraining datasets (CC-3M, CC-12M, YFCC-15M, LAION-400M), we observe a consistent linear relationship between CLIP's zero-shot performance on a concept and the log-scaled pretraining concept frequency. This trend holds for both zero-shot classification (results averaged across 17 datasets) and image-text retrieval (results averaged across 2 datasets). ** indicates that the result is significant (p < 0.05 with a two-tailed t-test [118]), and thus we show Pearson correlation (p) [73] as well.

🔼 This figure displays the results of experiments showing the relationship between the frequency of a concept in the training dataset and the performance of CLIP models on that concept in zero-shot classification and retrieval tasks. The plots show a consistent linear relationship between the log-scaled pretraining concept frequency and the performance metrics (accuracy for classification and recall for retrieval), suggesting that the success of CLIP models in zero-shot settings is strongly linked to the inclusion of the test concepts in their pretraining data.
read the caption
Figure 2: Log-linear relationships between concept frequency and CLIP zero-shot performance. Across all tested architectures (RN50, RN101, ViT-B-32, ViT-B-16, ViT-L-14) and pretraining datasets (CC-3M, CC-12M, YFCC-15M, LAION-400M), we observe a consistent linear relationship between CLIP’s zero-shot performance on a concept and the log-scaled pretraining concept frequency. This trend holds for both zero-shot classification (results averaged across 17 datasets) and image-text retrieval (results averaged across 2 datasets). ** indicates that the result is significant (p < 0.05 with a two-tailed t-test [118]), and thus we show Pearson correlation (ρ) [73] as well.

🔼 This figure displays the results of an experiment investigating the relationship between the frequency of a concept in a model’s pretraining data and the model’s zero-shot performance on that concept. The experiment used five different large-scale image-text pretraining datasets and five different CLIP models with varying architectures and parameter scales. The results show a consistent log-linear relationship between the log-scaled pretraining concept frequency and zero-shot performance, holding true for both classification and retrieval tasks. This indicates that models require exponentially more data to achieve linear improvements in zero-shot performance.
read the caption
Figure 2: Log-linear relationships between concept frequency and CLIP zero-shot performance. Across all tested architectures (RN50, RN101, ViT-B-32, ViT-B-16, ViT-L-14) and pretraining datasets (CC-3M, CC-12M, YFCC-15M, LAION-400M), we observe a consistent linear relationship between CLIP's zero-shot performance on a concept and the log-scaled pretraining concept frequency. This trend holds for both zero-shot classification (results averaged across 17 datasets) and image-text retrieval (results averaged across 2 datasets). ** indicates that the result is significant (p < 0.05 with a two-tailed t-test [118]), and thus we show Pearson correlation (p) [73] as well.

🔼 This figure shows the consistent log-linear relationship between the frequency of a concept in the pretraining dataset and its zero-shot performance using CLIP models across various architectures and datasets, for both classification and retrieval tasks. The log-scaled frequency is used for visualization.
read the caption
Figure 2: Log-linear relationships between concept frequency and CLIP zero-shot performance. Across all tested architectures (RN50, RN101, ViT-B-32, ViT-B-16, ViT-L-14) and pretraining datasets (CC-3M, CC-12M, YFCC-15M, LAION-400M), we observe a consistent linear relationship between CLIP's zero-shot performance on a concept and the log-scaled pretraining concept frequency. This trend holds for both zero-shot classification (results averaged across 17 datasets) and image-text retrieval (results averaged across 2 datasets). ** indicates that the result is significant (p < 0.05 with a two-tailed t-test [118]), and thus we show Pearson correlation (p) [73] as well.

🔼 This figure shows the consistent log-linear relationship between the frequency of a concept in the pretraining dataset and the zero-shot performance of CLIP models on that concept across different architectures and four different pretraining datasets. The linear trend holds for both classification and retrieval tasks, demonstrating that models with more frequent concepts during training achieve significantly better zero-shot performance.
read the caption
Figure 2: Log-linear relationships between concept frequency and CLIP zero-shot performance. Across all tested architectures (RN50, RN101, ViT-B-32, ViT-B-16, ViT-L-14) and pretraining datasets (CC-3M, CC-12M, YFCC-15M, LAION-400M), we observe a consistent linear relationship between CLIP's zero-shot performance on a concept and the log-scaled pretraining concept frequency. This trend holds for both zero-shot classification (results averaged across 17 datasets) and image-text retrieval (results averaged across 2 datasets). ** indicates that the result is significant (p < 0.05 with a two-tailed t-test [118]), and thus we show Pearson correlation (p) [73] as well.

🔼 This figure displays the strong correlation between the frequency of concepts in the pretraining data and the model’s zero-shot performance on those concepts for CLIP models across various architectures and datasets. The log-linear relationship shows that exponentially more data is needed for linear improvement, indicating a lack of true zero-shot generalization.
read the caption
Figure 2: Log-linear relationships between concept frequency and CLIP zero-shot performance. Across all tested architectures (RN50, RN101, ViT-B-32, ViT-B-16, ViT-L-14) and pretraining datasets (CC-3M, CC-12M, YFCC-15M, LAION-400M), we observe a consistent linear relationship between CLIP's zero-shot performance on a concept and the log-scaled pretraining concept frequency. This trend holds for both zero-shot classification (results averaged across 17 datasets) and image-text retrieval (results averaged across 2 datasets). ** indicates that the result is significant (p < 0.05 with a two-tailed t-test [118]), and thus we show Pearson correlation (p) [73] as well.
🔼 This figure shows the log-linear relationship between the frequency of a concept in the pretraining data and the zero-shot performance of CLIP models on that concept for both classification and retrieval tasks. The consistent trend across various architectures and datasets supports the paper’s claim that ‘zero-shot’ performance is heavily dependent on pretraining data.
read the caption
Figure 2: Log-linear relationships between concept frequency and CLIP zero-shot performance. Across all tested architectures (RN50, RN101, ViT-B-32, ViT-B-16, ViT-L-14) and pretraining datasets (CC-3M, CC-12M, YFCC-15M, LAION-400M), we observe a consistent linear relationship between CLIP's zero-shot performance on a concept and the log-scaled pretraining concept frequency. This trend holds for both zero-shot classification (results averaged across 17 datasets) and image-text retrieval (results averaged across 2 datasets). ** indicates that the result is significant (p < 0.05 with a two-tailed t-test [118]), and thus we show Pearson correlation (p) [73] as well.

🔼 This figure shows the user interface used for human evaluation of text-to-image alignment in the context of people concepts. Participants were shown a generated image alongside a reference image and asked to rate how accurately the generated image depicted the person named in the prompt (Yes, Somewhat, No). This interface is part of a smaller scale human evaluation study to verify the results from the automated aesthetic score used in the main experiment, which is discussed in Appendix C of the paper.
read the caption
Figure 16: User Interface for T2I human evaluation for text-image alignment for people concepts. See Appx. C for further details.
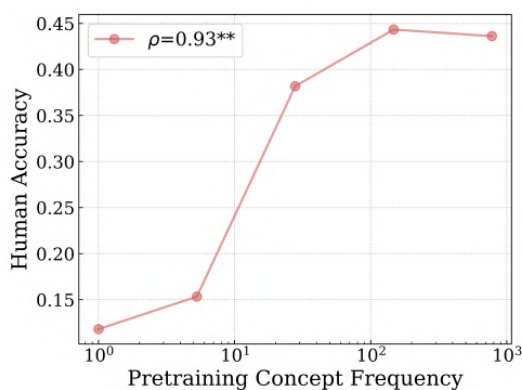
🔼 This figure shows the results of a human evaluation study on the relationship between the frequency of a concept in the pre-training data and the accuracy of text-to-image models in generating images of that concept. The x-axis represents the log-scaled frequency of the concept in the pre-training data, while the y-axis represents the human-rated accuracy of the generated image. A log-linear trend is observed, indicating that as the frequency of the concept in the training data increases exponentially, the model’s performance increases linearly.
read the caption
Figure 17: Log-linear relationship between concept frequency and T2I human evaluation for text-image alignment for people concepts. We observe a consistent linear relationship between T2I zero-shot performance on a concept and the log-scaled concept pretraining frequency.

🔼 This figure shows the strong correlation between the frequency of a concept in the pretraining data and the performance of CLIP models on that concept in zero-shot classification and retrieval tasks. The log-linear relationship demonstrates that exponentially more data is needed to achieve linear improvements in performance.
read the caption
Figure 2: Log-linear relationships between concept frequency and CLIP zero-shot performance. Across all tested architectures (RN50, RN101, ViT-B-32, ViT-B-16, ViT-L-14) and pretraining datasets (CC-3M, CC-12M, YFCC-15M, LAION-400M), we observe a consistent linear relationship between CLIP's zero-shot performance on a concept and the log-scaled pretraining concept frequency. This trend holds for both zero-shot classification (results averaged across 17 datasets) and image-text retrieval (results averaged across 2 datasets). ** indicates that the result is significant (p < 0.05 with a two-tailed t-test [118]), and thus we show Pearson correlation (p) [73] as well.
🔼 This figure shows the results of experiments evaluating the relationship between the frequency of a concept in the pretraining dataset and the model’s zero-shot performance on that concept. The experiments were conducted on various CLIP models with different architectures and pretraining datasets. The results indicate a consistent log-linear relationship between concept frequency and performance, suggesting that models require exponentially more data to achieve linear improvements in zero-shot performance. This trend persists across different architectures, pretraining datasets, and downstream tasks.
read the caption
Figure 2: Log-linear relationships between concept frequency and CLIP zero-shot performance. Across all tested architectures (RN50, RN101, ViT-B-32, ViT-B-16, ViT-L-14) and pretraining datasets (CC-3M, CC-12M, YFCC-15M, LAION-400M), we observe a consistent linear relationship between CLIP's zero-shot performance on a concept and the log-scaled pretraining concept frequency. This trend holds for both zero-shot classification (results averaged across 17 datasets) and image-text retrieval (results averaged across 2 datasets). ** indicates that the result is significant (p < 0.05 with a two-tailed t-test [118]), and thus we show Pearson correlation (p) [73] as well.

🔼 This figure shows the log-linear relationship between concept frequency and zero-shot performance for SLIP and CyCLIP models. It demonstrates that the log-linear relationship observed in the main CLIP experiments persists even when using different training objectives aimed at improving generalization. The plots show average zero-shot classification accuracy across three different datasets (CC-3M, CC-12M, YFCC-15M) against the log-scaled pretraining concept frequency for models trained with the SLIP and CyCLIP methods.
read the caption
Figure 20: Log-linear scaling trends for SLIP and CyCLIP models

🔼 This histogram visualizes the distribution of concept frequencies within the ‘Let-It-Wag!’ dataset. The x-axis represents the frequency of each concept, and the y-axis shows the number of concepts with that frequency. The distribution is heavily skewed to the left, indicating a long tail, meaning many concepts have low frequencies and a few concepts have very high frequencies. This is consistent with the paper’s overall finding of data scarcity in the long tail of the concept distribution.
read the caption
Figure 21: Histogram of concept frequencies for Let-It-Wag! Dataset

🔼 This figure compares the performance of three different models (OWL-v2, RAM++, and CLIP) in identifying fine-grained concepts within images. It highlights that while OWL-v2 (an open-vocabulary object detector) struggles with precise identification, RAM++ demonstrates superior performance in tagging images with the relevant concepts. CLIP’s results are also shown for comparison, illustrating its performance on a ‘photo of a …’ prompting scheme.
read the caption
Figure 22: Qualitative Results comparing OWL-v2, RAM++ and CLIP. We show qualitative examples across three different models: OWL-v2, RAM++ and CLIP on fine-grained concepts.

🔼 This figure shows a qualitative comparison of the RAM++ model’s performance at three different thresholds (0.5, 0.6, 0.7) for identifying concepts in images. The higher threshold (0.7) yields better results by reducing false positives. Images are from the CC-3M dataset.
read the caption
Figure 23: Qualitative Results with different RAM++ thresholds. We show qualitative examples across three different thresholds: {0.5, 0.6, 0.7} for estimating concept frequency using the RAM++ model. We note the significantly better concepts identified by the higher threshold (0.7) compared to the lower thresholds (0.5, 0.6). The images are sourced from the CC-3M dataset.
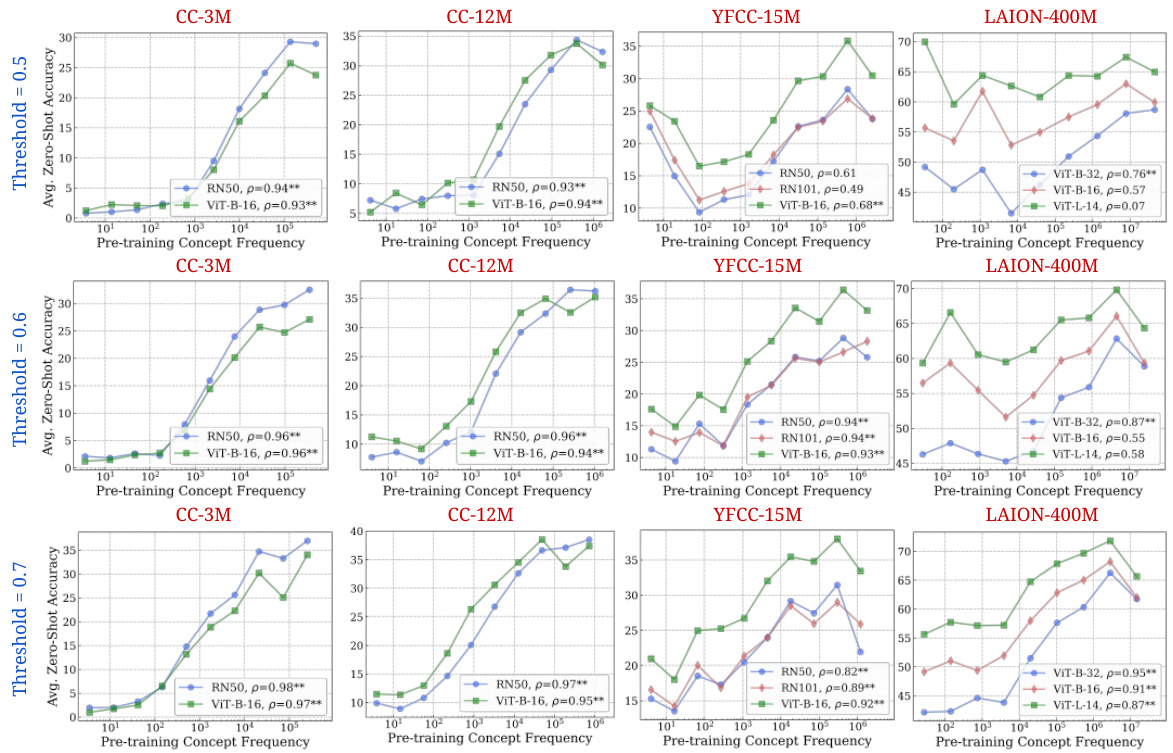
🔼 This figure shows the consistent log-linear relationship between a concept’s frequency in the pretraining dataset and the zero-shot performance of CLIP models across various architectures and datasets, for both classification and retrieval tasks. The log scale highlights the exponential relationship between the amount of data and performance improvement.
read the caption
Figure 2: Log-linear relationships between concept frequency and CLIP zero-shot performance. Across all tested architectures (RN50, RN101, ViT-B-32, ViT-B-16, ViT-L-14) and pretraining datasets (CC-3M, CC-12M, YFCC-15M, LAION-400M), we observe a consistent linear relationship between CLIP's zero-shot performance on a concept and the log-scaled pretraining concept frequency. This trend holds for both zero-shot classification (results averaged across 17 datasets) and image-text retrieval (results averaged across 2 datasets). ** indicates that the result is significant (p < 0.05 with a two-tailed t-test [118]), and thus we show Pearson correlation (p) [73] as well.

🔼 This figure shows the consistent log-linear relationship between the frequency of a concept in the pretraining dataset and the zero-shot performance of CLIP models on that concept across various architectures and pretraining datasets, for both classification and retrieval tasks. The log-scaled frequency is used for better visualization, and statistical significance (p-value < 0.05) is indicated using **. Pearson correlation coefficients (p) are also shown.
read the caption
Figure 2: Log-linear relationships between concept frequency and CLIP zero-shot performance. Across all tested architectures (RN50, RN101, ViT-B-32, ViT-B-16, ViT-L-14) and pretraining datasets (CC-3M, CC-12M, YFCC-15M, LAION-400M), we observe a consistent linear relationship between CLIP's zero-shot performance on a concept and the log-scaled pretraining concept frequency. This trend holds for both zero-shot classification (results averaged across 17 datasets) and image-text retrieval (results averaged across 2 datasets). ** indicates that the result is significant (p < 0.05 with a two-tailed t-test [118]), and thus we show Pearson correlation (p) [73] as well.
🔼 This figure shows the consistent log-linear relationship between the frequency of a concept in the pretraining dataset and the CLIP model’s zero-shot performance on that concept for classification and retrieval tasks. The results are consistent across various CLIP model architectures and four different pretraining datasets. The log scale emphasizes the exponential relationship, showing that a significant increase in pretraining data is required for linear improvements in zero-shot performance.
read the caption
Figure 2: Log-linear relationships between concept frequency and CLIP zero-shot performance. Across all tested architectures (RN50, RN101, ViT-B-32, ViT-B-16, ViT-L-14) and pretraining datasets (CC-3M, CC-12M, YFCC-15M, LAION-400M), we observe a consistent linear relationship between CLIP's zero-shot performance on a concept and the log-scaled pretraining concept frequency. This trend holds for both zero-shot classification (results averaged across 17 datasets) and image-text retrieval (results averaged across 2 datasets). ** indicates that the result is significant (p < 0.05 with a two-tailed t-test [118]), and thus we show Pearson correlation (p) [73] as well.

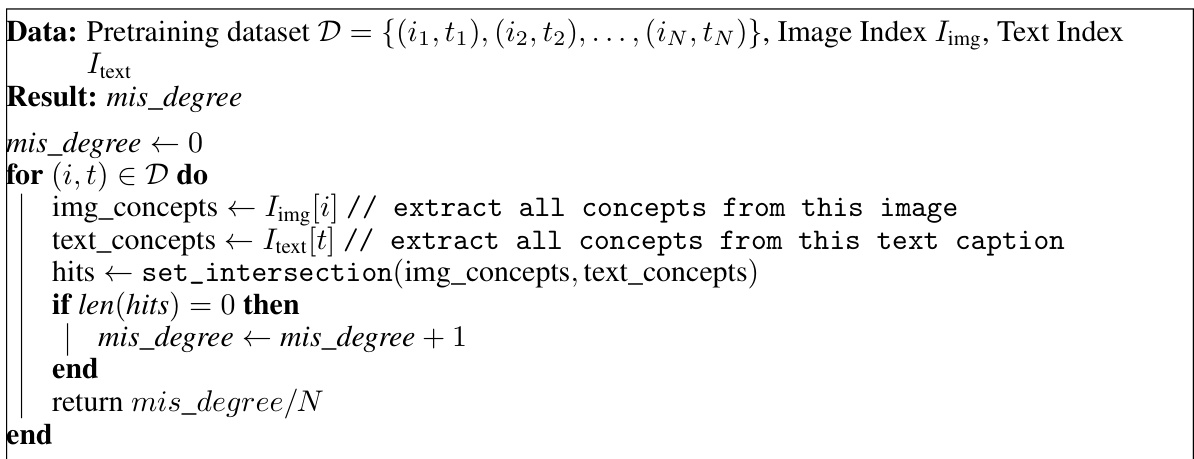
🔼 This figure shows four examples of image-text pairs from the CC-3M dataset that are identified as misaligned. The captions provided for each image do not accurately reflect the content of the image, highlighting the issue of image-text misalignment in pretraining datasets. This misalignment can hinder the model’s ability to learn effectively, as the provided text does not give a meaningful context for the image content. The misalignment is a significant challenge when working with large-scale datasets, and the figure illustrates the need for effective strategies to address and mitigate this issue.
read the caption
Figure 26: Qualitative examples of misaligned image-text pairs identified. We present 4 samples from the CC-3M pretraining dataset that are identified as misaligned by our analysis. Here, the text captions clearly do not entail the images, and hence do not provide a meaningful signal for learning.

🔼 This figure shows the strong log-linear relationship between the frequency of a concept in the pretraining dataset and the CLIP model’s zero-shot performance on that concept across various architectures and pretraining datasets. The results are consistent across both classification and retrieval tasks, demonstrating that models require exponentially more data for linearly better performance on a given concept.
read the caption
Figure 2: Log-linear relationships between concept frequency and CLIP zero-shot performance. Across all tested architectures (RN50, RN101, ViT-B-32, ViT-B-16, ViT-L-14) and pretraining datasets (CC-3M, CC-12M, YFCC-15M, LAION-400M), we observe a consistent linear relationship between CLIP's zero-shot performance on a concept and the log-scaled pretraining concept frequency. This trend holds for both zero-shot classification (results averaged across 17 datasets) and image-text retrieval (results averaged across 2 datasets). ** indicates that the result is significant (p < 0.05 with a two-tailed t-test [118]), and thus we show Pearson correlation (p) [73] as well.

🔼 This figure displays qualitative results from three different text-to-image models (Stable Diffusion XL, Stable Diffusion v2, and Dreamlike Photoreal) when generating images of six different aircraft types. The goal is to show how well these models handle relatively rare concepts (the different aircraft models) in generating realistic and accurate images. Red borders indicate incorrect generations, green borders correct generations, and yellow borders ambiguous generations.
read the caption
Figure 28: Qualitative results on the Aircraft cluster.

🔼 This figure displays a qualitative analysis of the performance of three different text-to-image models (Stable Diffusion XL, Stable Diffusion v2, and Dreamlike Photoreal) on a set of concepts related to activities. The concepts include cricket bowling, head massage, juggling balls, playing daf, soccer juggling, and wall pushups. For each concept, the figure shows four generated images from each model. The images are categorized as correct (green border), incorrect (red border), or ambiguous (yellow border).
read the caption
Figure 29: Qualitative results on the Activity cluster.
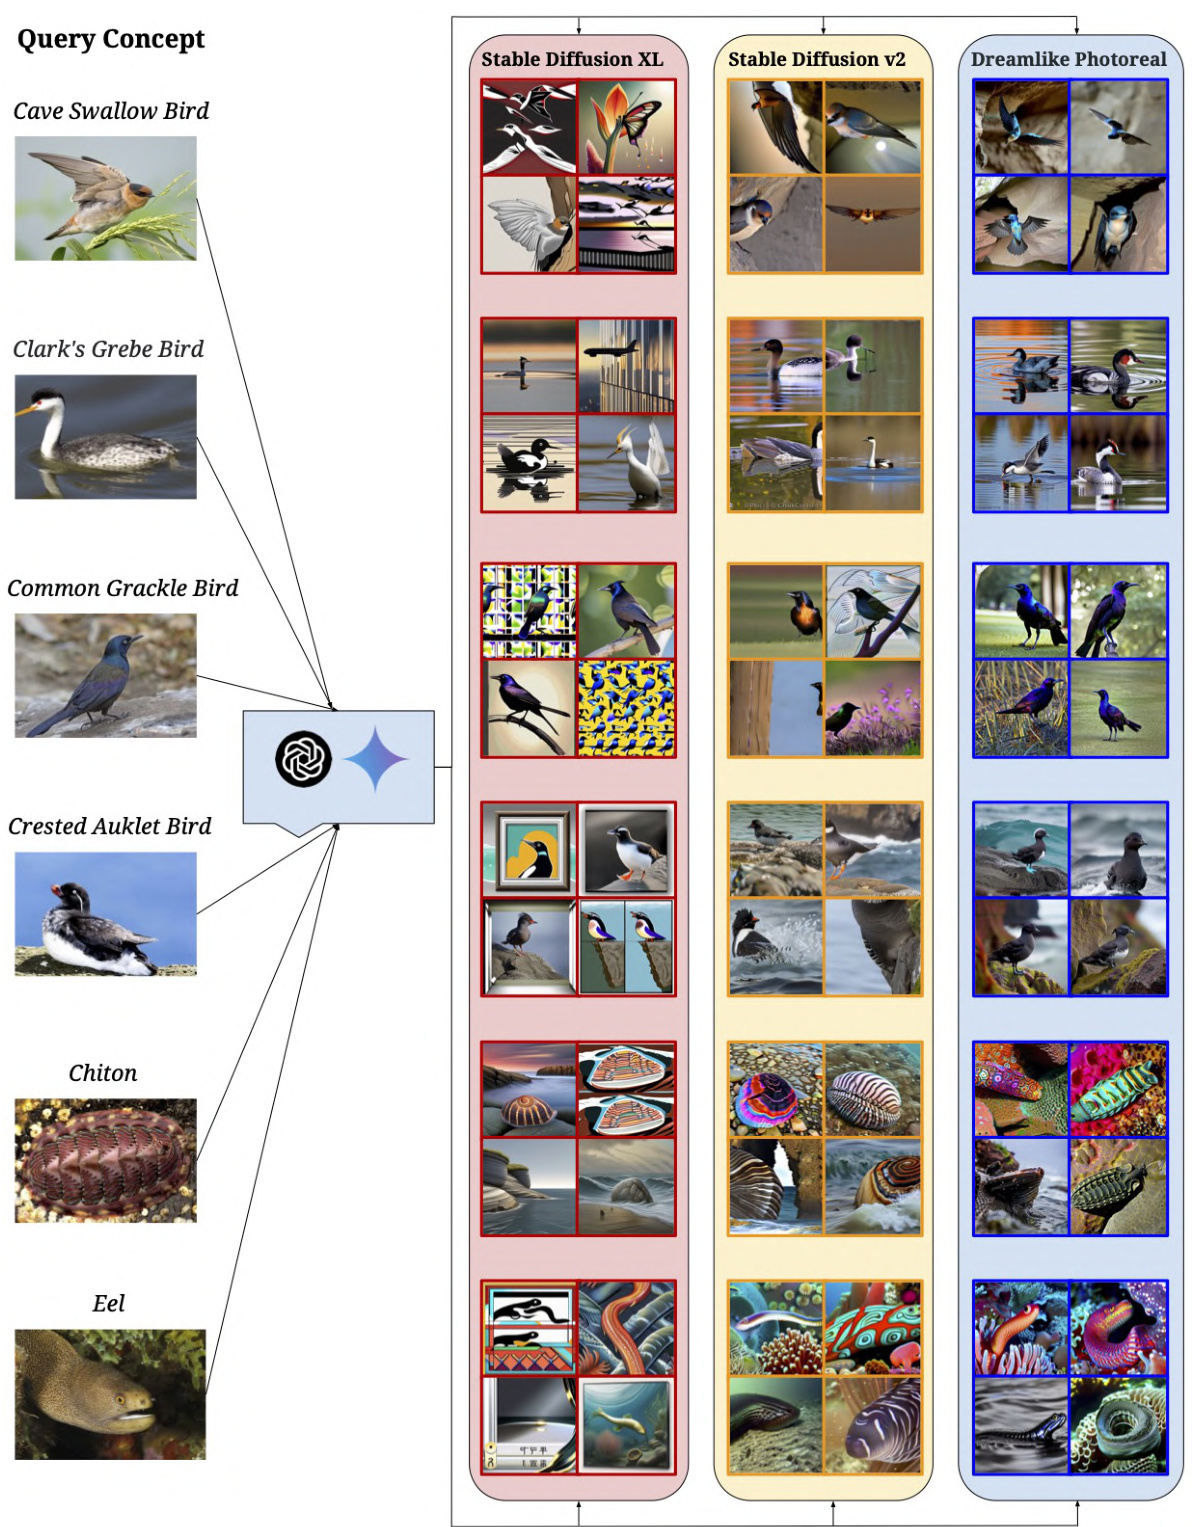
🔼 This figure shows qualitative results for the ‘Animal’ cluster from the Let It Wag! dataset. It displays example prompts for generating images of various animals (Cave Swallow Bird, Clark’s Grebe Bird, Common Grackle Bird, Crested Auklet Bird, Chiton, Eel) and compares the generated images from three different text-to-image models: Stable Diffusion XL, Stable Diffusion v2, and Dreamlike Photoreal. The images are organized to show the prompt, then the generated images from each model. The purpose is to illustrate the challenges these models face in generating images for less common animal concepts.
read the caption
Figure 30: Qualitative results on the Animal cluster.
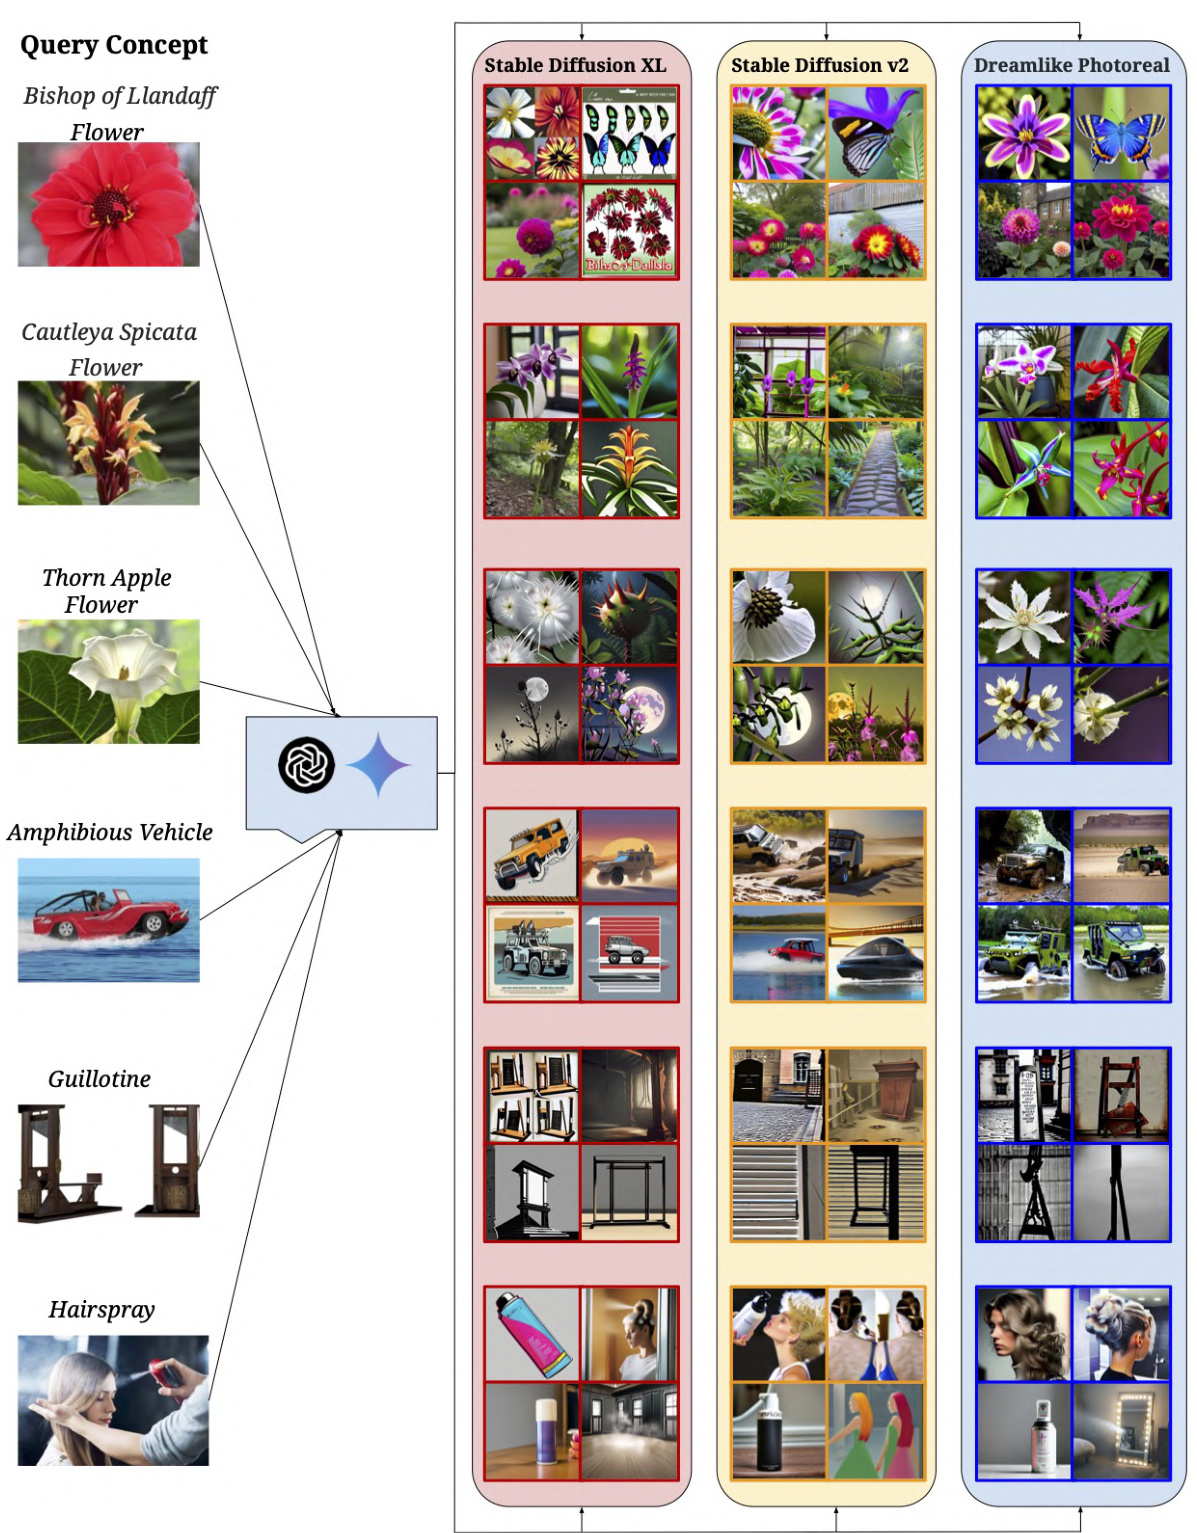
🔼 This figure shows qualitative results for several concepts from the long-tail dataset, ‘Let It Wag!’. Three different text-to-image (T2I) models (Stable Diffusion XL, Stable Diffusion v2, and Dreamlike Photoreal) were used to generate images for each concept. The results highlight the difficulty these models face in accurately representing certain concepts, particularly those with low frequency in pretraining datasets. Each concept is shown with a reference image, followed by the images generated by each model, indicating successes (green border) and failures (red border) in image generation.
read the caption
Figure 31: Qualitative results for other selected failure cases.
More on tables

🔼 This table lists the 24 text-to-image (T2I) models used in the experiments described in the paper. The models span various architectures and parameter scales, representing a range of model sizes and capabilities.
read the caption
Table 2: Models used in text-to-image (T2I) experiments.

🔼 This table presents the results of an analysis measuring the misalignment between images and their corresponding text captions in several large-scale image-text datasets used for pretraining multimodal models. For each dataset, it shows the total number of image-text pairs identified as misaligned and the percentage of the total dataset that this represents (the misalignment degree). The high misalignment rates highlight a significant challenge in the quality of these datasets, where images and their captions don’t always accurately reflect the same concepts.
read the caption
Table 3: For each pretraining dataset, we present the number of misaligned image-text pairs and the misalignment degree: fraction of misalignment pairs.

🔼 This table presents the correlation coefficients between the concept frequency distributions of four different large-scale image-text pretraining datasets: CC-3M, CC-12M, YFCC-15M, and LAION-400M. The high correlation values (above 0.7) indicate that despite differences in size, data curation methods, and sources, these datasets exhibit surprisingly similar distributions of concepts. This suggests that web-crawled data tends to share a common long-tailed distribution of concepts.
read the caption
Table 4: We compute correlation in concept frequency across pretraining datasets, observing strong correlations, despite major differences in scale and curation.

🔼 This table presents the results of a retrieval experiment using generated images as queries and real images from the Let It Wag! dataset as a gallery. The experiment compares retrieval performance (measured by CMC@k, where k is 1, 2, or 5) between head concepts (frequent concepts) and tail concepts (infrequent concepts) for three different text-to-image models: Stable Diffusion XL, Stable Diffusion v2, and Dreamlike Photoreal. The delta (△CMC@k) is calculated by subtracting the CMC@k score for tail concepts from the CMC@k score for head concepts, highlighting the performance difference between frequent and infrequent concepts in image retrieval.
read the caption
Table 8: Generated-real retrieval scores. We compare retrieval results of DINOv2 ViT-S/14 when using generated images as query images. We report △CMC@k results where k={1,2,5} between head and tail concepts.

🔼 This table demonstrates example GPT-4 descriptions used as input to the RAM++ model for a subset of the downstream datasets and concepts. For each concept, the table shows the corresponding GPT-4 description used for concept tagging in images. The descriptions are designed to be comprehensive and capture synonyms and hierarchical relationships, thereby aiding RAM++ in accurately identifying concepts within images, even in the presence of visual ambiguity or variations.
read the caption
Table 5: Example GPT-4 Descriptions fed to RAM++ on a subset of downstream datasets and concepts.
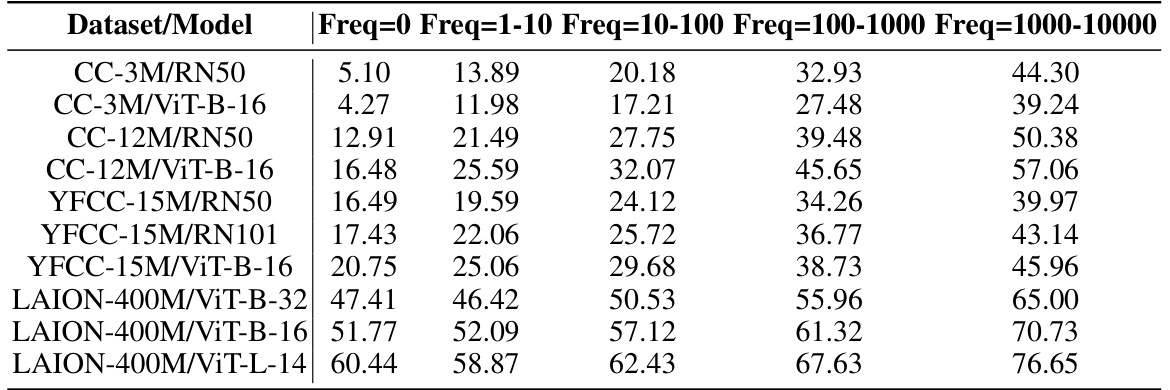
🔼 This table presents a detailed breakdown of the average classification performance achieved by various models trained on different pretraining datasets. The performance is categorized into different frequency bins, indicating the frequency of concepts in the pretraining data. The results show that models perform significantly worse on concepts with a frequency of 0 compared to those with higher frequencies. This supports the key finding of the paper that concept frequency exponentially impacts model performance.
read the caption
Table 6: Performance per frequency bin. Here, we explicitly report the average classification performance of models trained on different pretraining datasets, per frequency bin (i.e., 0-frequency concepts only, concepts with frequencies in the range 1-10, 10-100 etc.). We note that average performance for the 0-frequency concepts is significantly lower than other non-zero frequency concepts, especially when compared to the performance of very high-frequency concepts.

🔼 This table compares the automatically calculated misalignment degree (from Table 3) with human-verified results for four different pretraining datasets: CC-3M, CC-12M, YFCC-15M, and LAION-400M. The human verification involved manually annotating 200 random image-text pairs from each dataset to check for alignment. The table demonstrates that the automatically computed misalignment degrees are reasonably accurate, although there are some discrepancies, especially for the YFCC-15M dataset.
read the caption
Table 7: Human verification of mis-alignment results.
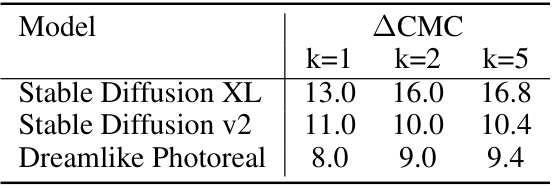
🔼 This table shows the results of a nearest neighbor retrieval task using images generated by three different text-to-image models. The task was to retrieve images from a gallery of real images (the ‘Let It Wag!’ dataset) that matched a generated image of a given concept. The table compares the performance on concepts that frequently appear in training data (head concepts) with those that appear infrequently (tail concepts) using the Cumulative Matching Characteristic (CMC) metric at different ranks (k=1, k=2, k=5). The larger the difference in CMC@k between the head and tail concepts, the bigger the performance gap between frequent and infrequent concepts in image retrieval.
read the caption
Table 8: Generated-real retrieval scores. We compare retrieval results of DINOv2 ViT-S/14 when using generated images as query images. We report △ CMC@k results where k={1,2,5} between head and tail concepts.
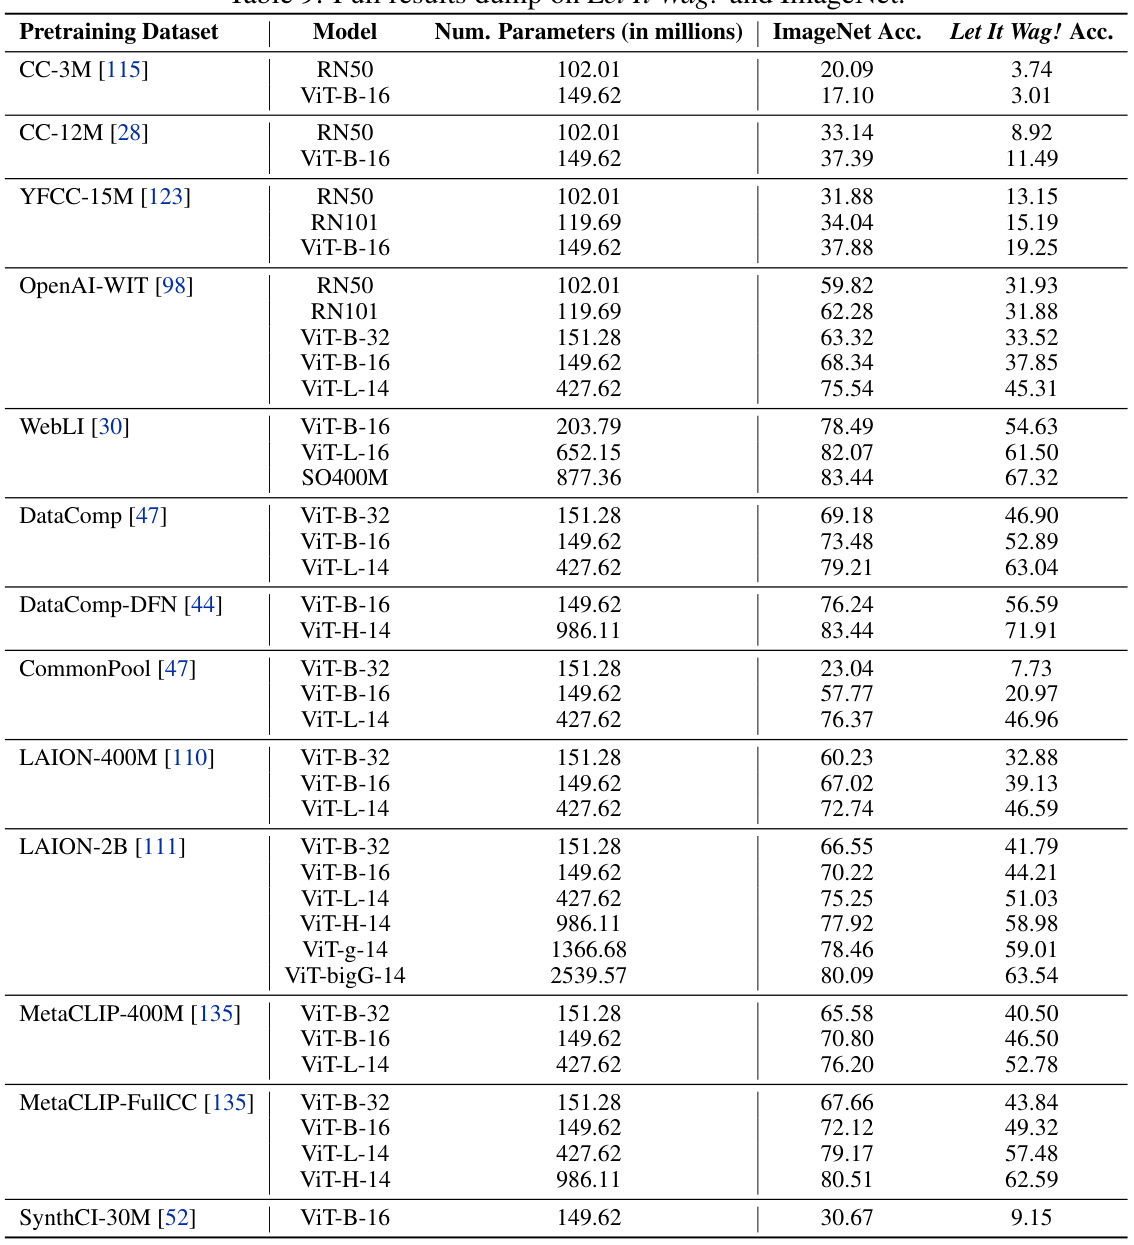
🔼 This table presents the classification accuracy of 40 different CLIP models on both the ImageNet dataset and the newly introduced Let It Wag! dataset. It shows the impact of the long tail on model performance by comparing accuracy across different model architectures, sizes and pretraining datasets.
read the caption
Table 9: Full results dump on Let It Wag! and ImageNet.

🔼 This table details the computational resources used in the paper’s experiments. It lists the disk space used, the number of shards created for each dataset, and the time taken for processing images and text indices using RAM++. The information helps understand the scale of the computational resources required for the research.
read the caption
Table 10: Compute and Storage Resources Utilized. We report the total disk space required for storing all pretraining datasets along with the number of shards stored. Further, we also report the exact wall-clock runtimes (WCT) for running the RAM++ image tagging scripts and the text-index construction across all downstream datasets, on a single GPU/CPU node.
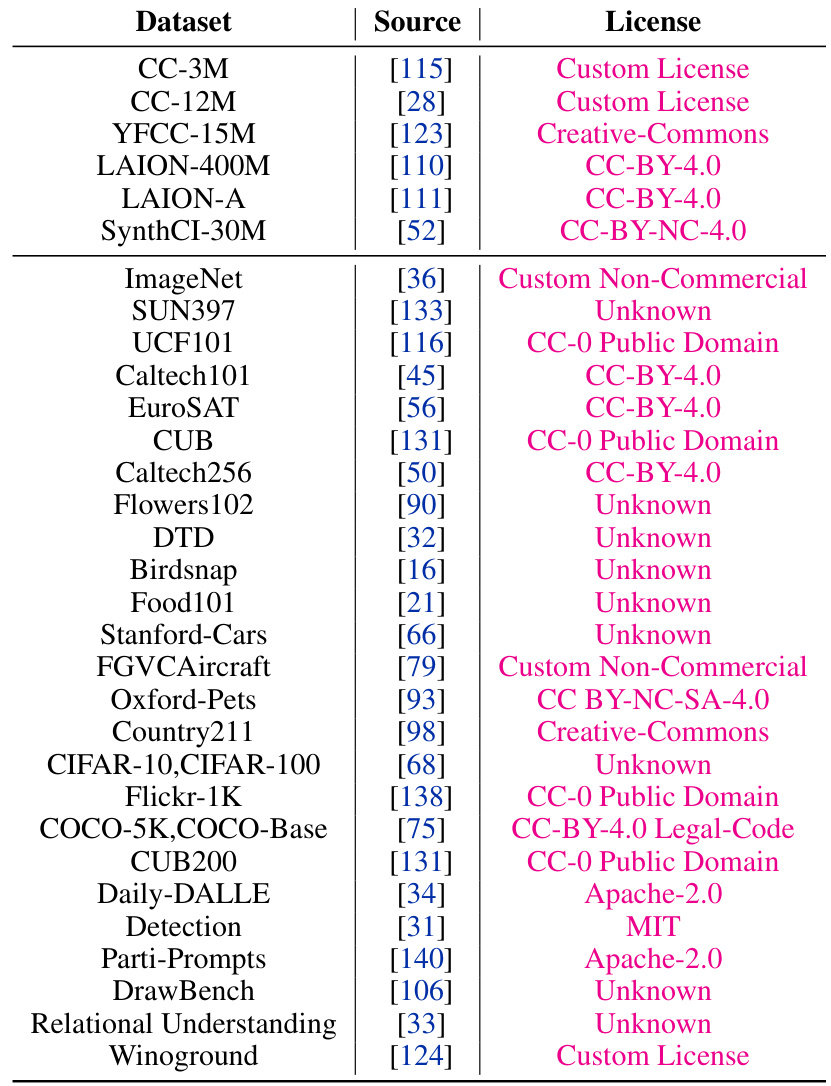
🔼 This table lists the pretraining and downstream datasets used in the image-text (CLIP) experiments described in the paper. The pretraining datasets include CC-3M, CC-12M, YFCC-15M, and LAION-400M, which are large-scale image-text datasets. The downstream datasets are categorized as classification-eval and retrieval-eval, and are further divided into many specific datasets, such as ImageNet, Caltech256, SUN397, etc. This table helps readers understand the scope of datasets used in the study for training and evaluating CLIP models.
read the caption
Table 1: Pretraining and downstream datasets used in Image-Text (CLIP) experiments.

🔼 This table lists the 24 text-to-image (T2I) models used in the experiments described in the paper. The models are categorized and their names are provided. The table provides a comprehensive overview of the models used in the text-to-image generation experiments.
read the caption
Table 2: Models used in text-to-image (T2I) experiments.
Full paper#


