↗ OpenReview ↗ NeurIPS Homepage ↗ Chat
TL;DR#
High-dimensional data analysis often struggles with noise and outliers, hindering accurate clustering and analysis. Principal Component Analysis (PCA) is commonly used for denoising, but its impact isn’t fully understood. Existing methods lack a robust way to quantify this impact and identify outliers effectively. This research addresses these issues.
This paper proposes a new metric called “compression ratio” to measure PCA’s denoising capabilities. It shows that PCA significantly reduces distances between data points within the same community (intra-community) but less so between different communities (inter-community). Using this metric, a novel outlier detection algorithm is developed. This method is validated through simulations and real-world high-dimensional noisy data, showing improvement in clustering accuracy compared to existing methods.
Key Takeaways#
Why does it matter?#
This paper is crucial because it introduces a novel metric, compression ratio, for quantifying PCA’s denoising effect on high-dimensional noisy data. This is particularly important for fields dealing with such data, like single-cell RNA sequencing. The proposed outlier detection method, based on compression ratio variance, significantly improves clustering accuracy. This work opens new avenues for research in high-dimensional data analysis and outlier detection, offering a robust and efficient approach.
Visual Insights#

The figure consists of two subfigures. Subfigure (a) shows the intra-community and inter-community compression ratios in the low noise, significant noise, and high noise settings. It demonstrates that the intra-community compression ratios are higher than the inter-community compression ratios, particularly in low-noise settings. As the noise increases, the gap between them decreases, indicating that the compression ratio is a useful metric even with heavy noise. Subfigure (b) presents the Area Under the ROC Curve (AUROC) scores of the variance-based outlier removal method compared to other popular outlier detection methods (LOF, KNN-dist, Isolation Forest, and ECOD) across the three noise levels. The results show that the variance-based method is competitive with the other methods and outperforms them in the low noise setting.

This table presents the average intra-cluster and inter-cluster compression ratios for nine different RNA-seq datasets. The intra-cluster compression ratio represents the average compression ratio between data points belonging to the same cluster, while the inter-cluster compression ratio represents the average compression ratio between points from different clusters. A higher intra-cluster compression ratio indicates that PCA brings points within the same cluster closer together, while a lower inter-cluster compression ratio indicates that PCA does not bring points from different clusters as close together. The table shows that, on average, the intra-cluster compression ratio is significantly higher than the inter-cluster compression ratio for all the datasets.
In-depth insights#
PCA Denoising#
PCA denoising leverages the inherent dimensionality reduction capabilities of Principal Component Analysis (PCA) to filter out noise from high-dimensional data. The core idea is that principal components, representing directions of maximum variance, capture the essential signal while noise is spread across many less significant components. By projecting the data onto a lower-dimensional subspace spanned by the top principal components, one effectively removes noise residing in the discarded dimensions. The effectiveness of PCA denoising depends on the nature of the noise, the signal-to-noise ratio, and the underlying data structure. While PCA excels at linear noise reduction, its performance on non-linear noise or data with complex structures might be limited. Outlier detection, often integrated with PCA denoising, further enhances the procedure’s accuracy by identifying and removing data points inconsistent with the primary signal. Applications span diverse fields, including bioinformatics, image processing, and financial modeling, where it aids in improving downstream analyses like clustering or classification.
Compression Ratio#
The concept of “Compression Ratio”, as described in the research paper, is a novel metric designed to quantify the denoising effect of Principal Component Analysis (PCA) on high-dimensional, noisy data. It’s calculated as the ratio of pre-PCA distance to post-PCA distance between data points. The core idea is that for data with underlying community structure, PCA significantly reduces the distance between points within the same community (intra-community distance) while minimally affecting the distance between points of different communities (inter-community distance). This phenomenon is theoretically justified and empirically validated, demonstrating PCA’s capability to effectively separate signal from noise. The compression ratio’s significance lies in its potential to not only quantify PCA’s denoising effect but also enable outlier detection. Points with low variance of compression ratios, indicating inconsistency in their relationship with other points, are identified as potential outliers. This method proves competitive with existing outlier detection techniques when tested on real-world datasets, particularly demonstrating its improvement in clustering accuracy by removing outliers prior to clustering. Overall, the “Compression Ratio” offers a powerful tool for understanding PCA and enhancing the accuracy of downstream machine learning tasks.
Outlier Detection#
The research paper explores outlier detection by introducing a novel metric called compression ratio which quantifies PCA’s denoising effect on high-dimensional data with underlying community structures. This metric measures the ratio of pre-PCA and post-PCA distances between data points. The core idea is that outliers, lacking a common signal with the community, exhibit lower compression ratio variance compared to inliers. An algorithm is proposed to identify outliers based on this variance; those with lower variance are flagged as potential outliers. The method’s effectiveness is demonstrated through simulations and real-world datasets like single-cell RNA-seq data, showcasing its competitiveness with established outlier detection techniques. The paper’s theoretical justification, experimental results, and analysis of real-world data strongly support the use of compression ratio as a robust and effective approach to outlier detection in high-dimensional noisy data, leading to improvements in downstream clustering algorithms.
RNA-Seq Analysis#
RNA-Seq analysis is a powerful technique for studying gene expression, but its complexity requires careful consideration of various factors. Data preprocessing, including quality control, read alignment, and normalization, is critical to ensure reliable downstream analysis. Differential expression analysis, identifying genes with altered expression levels between conditions, is a central goal. Popular methods like DESeq2 and edgeR offer robust statistical frameworks. Beyond simple differential expression, exploring alternative splicing, gene fusion detection, and isoform-level quantification can provide deeper insights. Integration with other omics data types, such as genomic variations or epigenetic modifications, offers a systems-level understanding. Finally, the analytical approach must be tailored to the specific biological questions, accounting for experimental design and potential confounding variables. Visualization and interpretation of results require careful consideration of both statistical significance and biological context.
Future Works#
The “Future Works” section of this research paper presents exciting avenues for further investigation. Extending the theoretical analysis to scenarios with more complex noise models is crucial, moving beyond the current simplified assumptions. This would enhance the generalizability and practical applicability of the compression ratio metric. Developing more sophisticated outlier detection algorithms based on the compression ratio, perhaps incorporating adaptive thresholding or considering the interplay between local and global outlier characteristics is also important. Exploring the use of compression ratio in other unsupervised learning tasks, such as dimensionality reduction beyond clustering, would showcase its broader utility. Finally, empirical validation on a wider range of high-dimensional datasets from diverse domains is critical to demonstrate the robustness and effectiveness of the proposed methods. Investigating the potential of the compression ratio metric to guide the selection of the optimal PCA dimension is another promising direction.
More visual insights#
More on figures

This figure presents simulation results to validate the proposed compression ratio metric and outlier detection method. Subfigure (a) shows the comparison of intra-community and inter-community compression ratios under different noise levels (low, significant, high). As expected, intra-community compression ratios are consistently higher than inter-community ratios, with the gap decreasing as the noise increases. Subfigure (b) displays the Area Under the ROC Curve (AUROC) scores for outlier detection using the variance-of-compression-ratio method and several popular outlier detection methods (LOF, KNN-dist, Isolation Forest, ECOD) both with and without PCA pre-processing. The results demonstrate the competitiveness of the proposed method, particularly in higher noise settings.

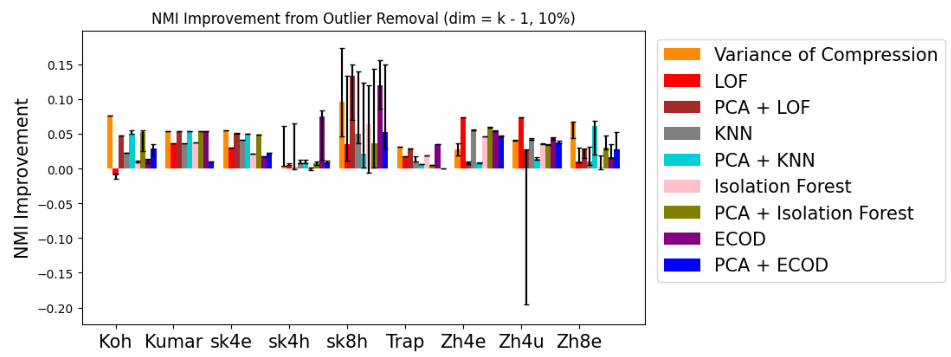
This figure shows the improvement in NMI (Normalized Mutual Information) achieved by removing 5% of outlier points detected using different methods, including the proposed variance of compression ratio method and other benchmark outlier detection methods. Each bar represents a dataset, comparing the improvement in NMI across various methods. Error bars indicate variability.
This figure presents simulation results demonstrating the effectiveness of the proposed compression ratio metric and outlier detection method. Panel (a) shows how the intra-community compression ratio (ratio of pre-PCA to post-PCA distance between points from the same community) and inter-community compression ratio (ratio of distances between points from different communities) change with different noise levels (low, significant, high). The results show that the compression ratio gap is larger in the low-noise setting compared to high noise, highlighting its utility even under strong noise. Panel (b) shows the Area Under the ROC Curve (AUROC) scores for the outlier detection methods on the simulated data, comparing the variance-based outlier removal method with other popular methods. The variance-based method displays competitive performance across various noise levels.
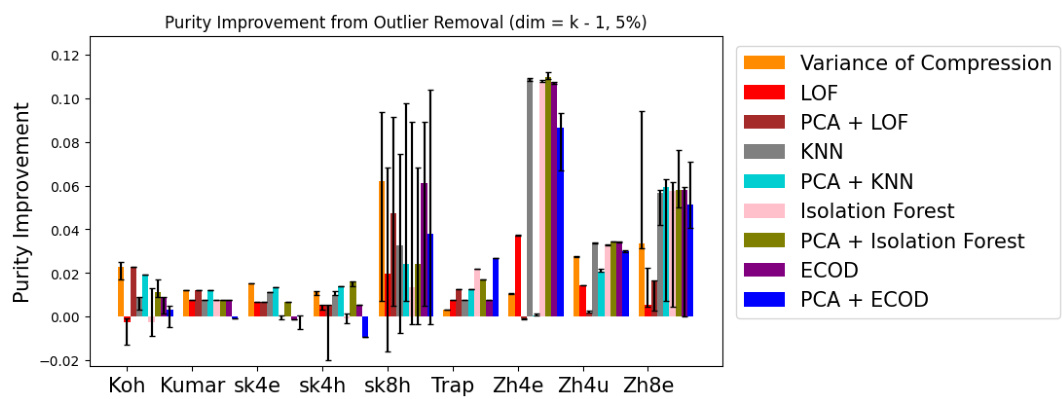
This figure shows the purity score improvements achieved by removing 5% of outlier points detected by different methods (Variance of Compression, LOF, PCA+LOF, KNN, PCA+KNN, Isolation Forest, PCA+Isolation Forest, ECOD, and PCA+ECOD) from various datasets (Koh, Kumar, Simkumar4easy, Simkumar4hard, Simkumar8hard, Trapnell, Zheng4eq, Zheng4uneq, and Zheng8eq). The y-axis represents the purity improvement, and the x-axis represents different datasets. Error bars are included to show the variability of the results.

This figure shows the improvement in purity score after removing the top 10% of outlier points detected by different methods, including the proposed variance of compression ratio method and several popular outlier detection methods. The x-axis represents different datasets, and the y-axis represents the change in purity score. Error bars indicate variability. The figure demonstrates the effectiveness of the proposed method compared to other methods in improving clustering purity by removing outliers.

This figure presents simulation results to validate the proposed compression ratio metric and outlier detection method. Subfigure (a) shows how intra-community compression ratios are higher than inter-community ratios in low-noise settings, but this gap decreases as noise increases. Subfigure (b) displays the Area Under the Receiver Operating Characteristic curve (AUROC) scores for outlier detection, comparing the proposed method to several other popular techniques, demonstrating its competitive performance across different noise levels.

This figure displays the purity score improvements achieved by removing 10% of outlier points across various datasets (Koh, Kumar, Simkumar4easy, Simkumar4hard, Simkumar8hard, Trapnell, Zheng4eq, Zheng4uneq, Zheng8eq). The improvements are shown for eight different outlier detection methods: Variance of Compression, LOF, PCA + LOF, KNN, PCA + KNN, Isolation Forest, PCA + Isolation Forest, ECOD, and PCA + ECOD. The graph uses a bar chart to represent the changes for each method in each dataset, allowing for easy visual comparison of their effectiveness. Error bars are included to indicate variability.
More on tables

This table presents the average intra-cluster and inter-cluster compression ratios for nine different RNA-seq datasets. The compression ratio is a novel metric proposed in the paper to quantify the denoising effect of Principal Component Analysis (PCA). A higher intra-cluster compression ratio indicates that PCA brings data points within the same cluster closer together, while a lower inter-cluster ratio suggests that PCA does not significantly reduce the distance between points in different clusters. The results in this table support the paper’s claim that PCA effectively denoises data with underlying community structure.

This table presents the average intra-cluster and inter-cluster compression ratios for nine different RNA-seq datasets. The compression ratio is a newly proposed metric in the paper that quantifies the denoising effect of PCA. A higher intra-cluster compression ratio indicates that PCA brings data points within the same cluster closer together, while a lower inter-cluster compression ratio indicates that PCA does not significantly reduce the distance between data points from different clusters. The results in this table demonstrate that PCA significantly improves data quality for clustering algorithms by bringing similar data points closer together while maintaining a larger distance between dissimilar data points.

This table presents the average intra-cluster and inter-cluster compression ratios for nine different RNA-seq datasets. The intra-cluster compression ratio is the average compression ratio between pairs of data points within the same cluster, while the inter-cluster compression ratio is the average compression ratio between pairs of data points from different clusters. The results show that, on average, PCA compresses points within the same cluster more effectively than points in different clusters, providing evidence that PCA has a denoising effect that is particularly beneficial in datasets with community structure. This supports a main finding of the paper.

This table summarizes the key characteristics of the nine single-cell RNA sequencing datasets used in the real-world experiments. For each dataset, it lists the number of clusters (representing distinct cell sub-populations), the total number of cells, and the number of genes (features) measured for each cell.

This table presents the average intra-cluster and inter-cluster compression ratios for several RNA-seq datasets. The compression ratio is a novel metric introduced in the paper to quantify the denoising effect of PCA. Higher intra-cluster ratios indicate that PCA brings data points within the same cluster closer together, while lower inter-cluster ratios suggest that PCA does not significantly reduce the distances between clusters. These results support the paper’s claim that PCA effectively denoises data with an underlying community structure.
This table presents the average intra-cluster and inter-cluster compression ratios for nine different RNA-seq datasets. The compression ratio is a metric proposed in the paper to quantify the denoising effect of PCA. Higher intra-cluster ratios indicate that PCA effectively brings data points within the same cluster closer together, while lower inter-cluster ratios suggest that PCA does not significantly reduce distances between points in different clusters. The table shows that intra-cluster compression ratios are generally much higher than inter-cluster compression ratios across all the datasets, supporting the paper’s claim that PCA’s denoising effect is more pronounced within clusters than between them.
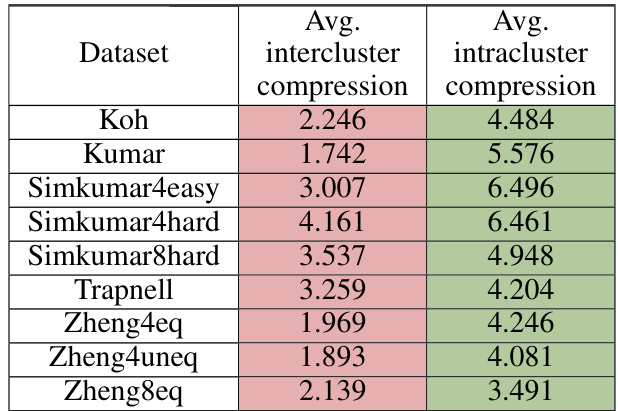
This table presents the average inter-cluster and intra-cluster compression ratios for nine different RNA-seq datasets. The PCA dimension used for calculating these ratios is 2k, where k is the number of clusters in the respective dataset. The table shows that, on average, the intra-cluster compression ratios are higher than the inter-cluster compression ratios across all the datasets, demonstrating that PCA brings data points within the same cluster closer together compared to data points from different clusters.

This table presents the Normalized Mutual Information (NMI) scores achieved by applying PCA followed by K-means clustering to several single-cell RNA-seq datasets. The NMI, a metric used to assess the quality of a clustering result by comparing it to a ground truth, is shown for each dataset before any outlier removal is performed. The lower NMIs observed in some datasets suggest that the presence of noise and outliers might be significantly affecting the accuracy of the clustering algorithm.
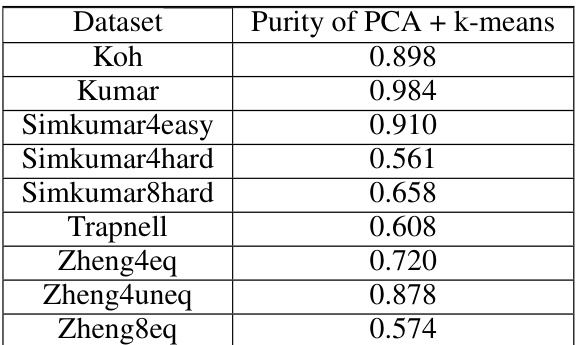
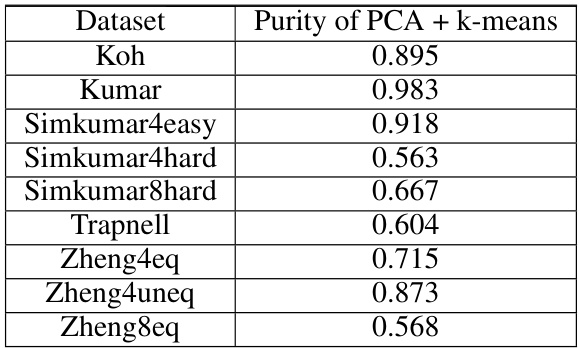
This table shows the average purity scores achieved by applying PCA followed by the k-means algorithm on several single-cell RNA sequencing datasets. These scores represent the performance of the clustering algorithm before any outlier removal is performed. The datasets vary in complexity, reflecting different levels of noise and difficulty in clustering. The table provides a baseline against which improvements after outlier detection can be measured.
Full paper#


