↗ OpenReview ↗ NeurIPS Homepage ↗ Chat
TL;DR#
Generative models, particularly diffusion models, are increasingly popular. A key technique for controlling the output is diffusion guidance, which aims to sample from a data distribution tilted by a conditional likelihood. However, existing understanding of guidance was largely based on assumptions that were not rigorously proven.
This paper rigorously proves that guidance fails to sample from the intended tilted distribution. It offers a fine-grained analysis of guidance dynamics for mixtures of compactly supported distributions and mixtures of Gaussians. The findings show that increasing guidance parameters pushes samples towards the boundary of the conditional distribution’s support, leading to a reduction in diversity and distorted generations. The work provides theoretical justifications, grounded in mathematical proofs, for observed empirical results, ultimately improving understanding and guiding best practices in model deployment.
Key Takeaways#
Why does it matter?#
This paper is crucial because it rigorously clarifies the workings of diffusion guidance, a widely used technique in generative modeling. By identifying its limitations and providing theoretical justifications, it guides researchers towards more effective and principled applications, ultimately advancing generative model development.
Visual Insights#

This figure shows the effect of guidance weight (w) on sampling from a 2D mixture of uniform distributions. (a) displays the ground truth distribution. (b) shows samples generated using the probability flow ODE with the conditional score (w=0), representing no guidance. (c) illustrates samples with a guided score (w=3), where a higher guidance weight leads to samples concentrating towards the edge of the positive class support, far from the negative class.
In-depth insights#
Guidance Failure#
The concept of ‘Guidance Failure’ in diffusion models, as explored in the research paper, centers on the misconception that guidance mechanisms directly sample from a data distribution tilted by the conditional likelihood raised to a power. The paper rigorously demonstrates that this is not the case. Instead, guidance biases sampling towards the boundary of the conditional distribution’s support. As the guidance parameter increases, this effect amplifies, leading to a loss of diversity and a concentration of generated samples at extreme points within the support. The authors provide a fine-grained analysis in simplified settings (mixtures of compactly supported distributions and mixtures of Gaussians) to rigorously prove this behavior. Crucially, their findings show that even with perfect score estimation, guidance will distort the sampling process, and that any nonzero estimation error is further amplified by strong guidance, theoretically explaining the common phenomenon of degraded generation quality at high guidance levels. The theoretical analysis provides invaluable prescriptions for practical deployment, suggesting the importance of carefully calibrating guidance parameters to avoid these pitfalls.
ODE Dynamics#
The heading ‘ODE Dynamics’ likely refers to a section detailing the mathematical behavior of ordinary differential equations (ODEs) within the context of the research. This section likely presents a core analysis of how these ODEs evolve over time and how their solutions shape the model’s behavior. A key aspect would be the theoretical underpinnings, focusing on the properties of these equations. Stability analysis, for instance, might determine whether the solutions converge to a steady state or diverge. Similarly, an analysis of convergence rates would inform on how quickly the model reaches its final state. The impact of model parameters on the dynamics might also be discussed, analyzing how changes in these parameters affect solution trajectories. Furthermore, a section on ‘ODE Dynamics’ might use simulations and visualization techniques to illustrate the behaviors described, thereby making the analysis more accessible and intuitive. The theoretical exploration of ODE behavior is crucial for understanding the model’s underlying mechanism and its behavior during generation, potentially highlighting limitations and suggesting improvements to the model’s design.
Synthetic Tests#
Synthetic tests in the context of a research paper on diffusion models, likely involve evaluating the model’s performance on artificial datasets with known characteristics. These tests are crucial because they allow for a controlled environment to isolate specific aspects of the model’s behavior. Unlike real-world data which is often complex and high-dimensional, synthetic data provides the ability to manipulate individual factors and measure their effect on the model’s output. Researchers could generate datasets with varying levels of noise, specific distributions, or carefully crafted features to investigate the model’s behavior under different circumstances. For instance, a study on the effects of guidance in diffusion models would use synthetic tests with varying levels of guidance weight, thus enabling researchers to understand how different parameters affect the sampling process. A primary focus would be on quantifiable metrics such as diversity and quality of the generated samples and their closeness to the underlying data distribution. Comparison of results from synthetic and real-world testing will provide valuable insight into the model’s generalizability and robustness.
ImageNet Results#
The ImageNet experiments section would ideally delve into the application of the theoretical findings on a more complex, real-world dataset. It should directly address how the previously observed phenomena (diversity drop, archetype divergence, and degradation with high guidance parameters) manifest in this high-dimensional setting. The results should demonstrate whether the proposed heuristics for selecting optimal guidance parameters translate to practical improvements in sample quality for ImageNet. A crucial element would be a comparison of the generated samples with the ground truth to quantitatively measure the efficacy of the proposed guidelines. Qualitative analysis of the generated images with varying guidance weights is also vital to assess visual fidelity and understand the impact of the guidance on perceptual quality. Analyzing the relationship between guidance strength and metrics such as diversity and fidelity will be particularly insightful. The discussion should acknowledge limitations imposed by the high dimensionality and complexity of ImageNet, such as difficulties in achieving true separation between classes or the presence of noise in score estimation. Finally, it should clearly state whether the observed behavior validates the previously developed theoretical insights and suggests directions for future work.
Future Work#
The paper’s lack of a dedicated “Future Work” section is notable. However, the concluding paragraph hints at several promising avenues. Extending the theoretical analysis to higher-dimensional settings is crucial for real-world applicability, as the current one-dimensional analysis limits its practical impact. Similarly, the authors acknowledge the need for a more rigorous examination of the optimal choice for the guidance parameter (w), moving beyond heuristic rules of thumb to derive principled guidance selection methods. Investigating the effect of score estimation error in more complex scenarios beyond the simplified examples is vital, particularly regarding the observed degradation of sample quality at high guidance parameters. Finally, applying these theoretical insights to more advanced tasks and datasets, such as ImageNet, warrants further study. The insights derived, particularly concerning the behavior of guidance in the presence of score-estimation errors, offer a clear path forward for the field of diffusion models. The emphasis on theoretically rigorous analysis sets a strong foundation for future research aimed at overcoming practical challenges and enhancing sample fidelity.
More visual insights#
More on figures

This figure shows the results of sampling from a 2D mixture of uniforms using the probability flow ODE with different guidance weights (w). The left panels display the final samples obtained for w = 1, 3, 7, and 15. The red points represent samples that successfully stayed within the positive class support. The proportion of such ‘good’ samples is indicated in the upper-right corner of each panel. The right panels show the mean sampling trajectories along the x-coordinate, with a standard deviation band providing a visual representation of the variability in the trajectories. As w increases, the samples concentrate towards the boundary of the positive class, illustrating the effects of increasing guidance strength and the potential for sampling to be biased towards extreme points.

This figure shows the results of experiments on a 2D mixture of uniform distributions. The left panel shows samples generated using the probability flow ODE with different guidance weights (w). The right panel shows the mean sampling trajectories for each guidance weight. As the guidance weight increases, the samples become more concentrated towards the edge of the support of the positive class. The standard deviation band illustrates the variance in the sampling trajectories. The caption also mentions that the proportion of ‘good’ samples (meaning samples within the support of the target class) is indicated on each subplot.

This figure shows the results of an experiment on ImageNet using classifier-guided diffusion. The top shows samples generated with increasing guidance weight (s = 1.0, 5.0, 10.0, 25.0). The bottom shows the mean projected trajectories for the same guidance weights, illustrating the effect of increasing guidance on sample generation. The ‘Error’ values likely represent some measure of deviation from the expected or ideal trajectory.

This figure shows the results of an experiment similar to the one in Figure 2, but using a mixture of Gaussians instead of a mixture of uniforms. The top row shows the final samples generated using the guided probability flow ODE, and the bottom row shows the mean sampling trajectories. As the guidance weight increases, the samples become more concentrated, and the trajectories show a similar pattern. However, there is increased numerical instability, which leads to some trajectories diverging, resulting in less meaningful mean projected trajectory plots.

This figure shows the results of repeating the experiment in Figure 3 but with the positive class fixed to be the digit 1. It shows samples generated and mean projected sampling trajectories for increasing guidance parameter values. The results show similar trends to those observed in Figure 3, with increasing guidance leading to a pullback effect.

This figure shows the MNIST experiments with the positive class fixed to be the digit 1. It’s a parallel to Figure 3, which explored the effects of varying the guidance parameter (w) on sampling trajectories. The figure shows both the final generated samples and plots of their mean projected trajectories. The results illustrate the dynamics of diffusion guidance, similar to Figure 3, with a focus on how the choice of guidance parameter influences sample quality and concentration towards the target class (digit 1 in this case).
This figure shows the results of sampling from a 2D mixture of uniform distributions using the probability flow ODE with guidance. The top row shows samples generated with increasing guidance weight (w). As the guidance weight increases, the samples concentrate towards the boundary of the support of the positive class, demonstrating the effect of guidance on sample distribution and diversity. The bottom row depicts the mean trajectories of the ODE solver for different guidance weights. The shaded area represents the 1 standard deviation band around the mean, reflecting the variance in trajectories. The figure visually supports the theoretical findings of the paper, illustrating how increasing guidance biases samples towards extreme points within the support of the target distribution.
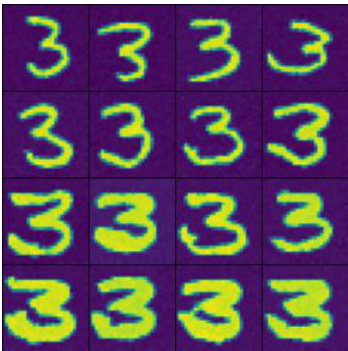
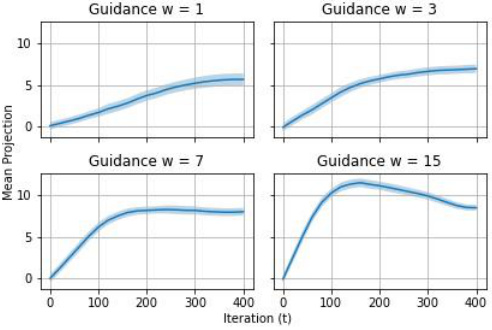
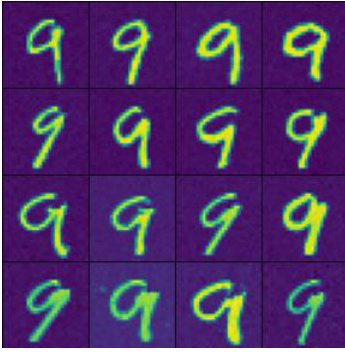
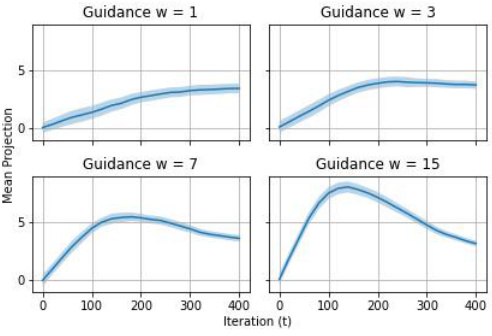
This figure shows the results of an experiment similar to Figure 3, but focusing on the digit ‘3’ as the positive class. It consists of two subfigures: (a) shows a grid of 16 MNIST digit ‘3’ images generated using classifier-free diffusion guidance. (b) presents graphs showing the mean projection of the sampling trajectories for different guidance parameters (w = 1, 3, 7, 15). The trajectories illustrate how the sampling dynamics change with varying guidance strength, similar to the observations in Figure 3 but for the specific digit ‘3’.
This figure shows the results of an experiment on a 2D mixture of uniform distributions. It illustrates the effects of increasing the guidance weight (w) on the sampling process. The top row displays scatter plots of generated samples for different guidance weights. The bottom row shows the mean trajectories of the sampling process alongside standard deviation bands, visualizing the dynamics of the sampling process. As guidance increases, samples concentrate near the boundary of the distribution’s support. The proportion of successfully sampled points within the desired area decreases with higher w values.
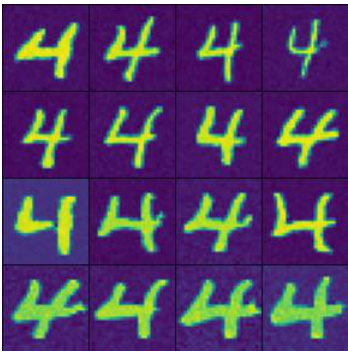
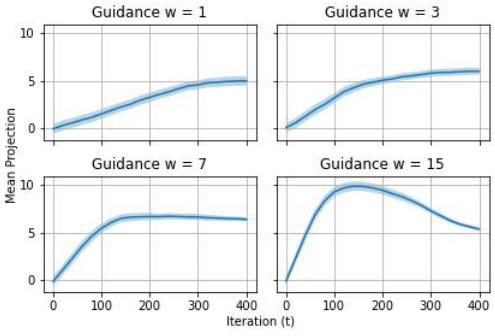
This figure shows the results of an experiment similar to Figure 3, but with a specific change. Figure 3 examines the behavior of diffusion guidance on MNIST data when the positive class is chosen arbitrarily. Figure 9 repeats this experiment, but specifically focuses on when the digit ‘4’ is designated as the positive class. The top panel displays samples generated under different levels of guidance (w=1, 3, 7, 15), illustrating how the samples shift as the guidance increases. The bottom panel shows the mean projected sampling trajectories, again for different levels of guidance, providing a visual representation of the sampling process dynamics. The purpose is to determine if the observed behavior in Figure 3 generalizes across different MNIST digit classes.

This figure shows the results of an experiment where the authors sampled from a 2D mixture of uniform distributions using the probability flow ODE with guidance. The x-axis represents the iteration number (t), and the y-axis represents the mean x-coordinate of the samples. Each subplot shows the results for a different value of the guidance parameter (w). The shaded area represents the standard deviation of the samples. The figure demonstrates that increasing the guidance parameter leads to a greater concentration of samples toward the edge of the support of the target class, and that the trajectories are no longer monotone.
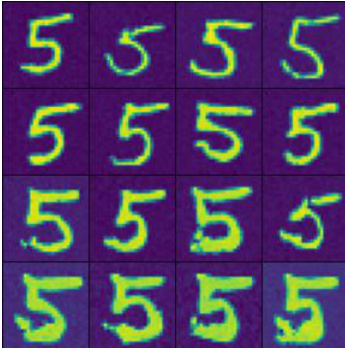
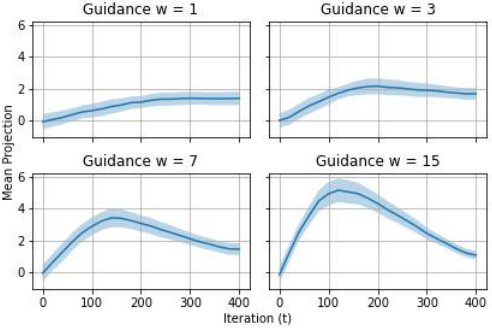
This figure shows the results of an experiment similar to Figure 3, but focusing on the digit ‘5’. It demonstrates the same trend as before, where increasing the guidance weight (w) initially concentrates generated samples towards the archetype, and then leads to a degradation of sample quality and a pullback effect in the projected sampling trajectories. The left panel shows the generated samples, and the right panel visualizes the mean projected trajectories, showing the movement of the generated samples over time in the reverse process.
This figure shows the results of sampling from a 2D mixture of uniform distributions using the probability flow ODE with guidance. The left column displays the final samples obtained at the end of the sampling process for increasing guidance weights (w = 1, 3, 7, 15). The right column shows the mean trajectory of the samples, with a shaded region representing one standard deviation around the mean trajectory. As the guidance weight increases, the samples concentrate towards the edge of the support of the target distribution, resulting in less diversity and potentially impacting sample quality.

This figure shows the results of repeating the MNIST experiments from Figure 3, but this time focusing only on samples from the digit 6. The figure is divided into two parts: (a) Samples and (b) Trajectories. (a) Shows a grid of sixteen generated images of the digit 6, with varying degrees of success in the generation quality. (b) Presents four plots showing the mean sampling trajectories for different guidance weights (w = 1, 3, 7, 15). Each plot shows the mean projection of the trajectories on a single axis, along with a shaded region indicating the standard deviation. The trajectories illustrate how the generated samples move towards the extreme points in the support of the conditional distribution of 6, as the guidance weight increases.

This figure shows the results of sampling from a 2D mixture of uniform distributions using the probability flow ODE with guidance. The plots demonstrate how increasing the guidance weight w concentrates the distribution of samples toward points far away from the support of the other class. Each subplot shows the samples (left) and mean sampling trajectories (right) produced by the ODE for different values of w. The proportion of ‘good’ samples (i.e., those that stayed within the support of the desired class) is also shown.
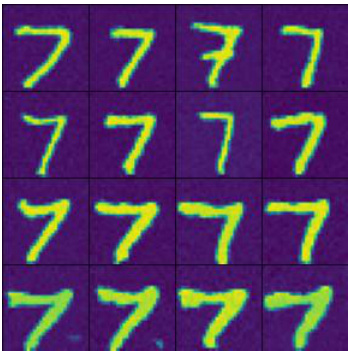
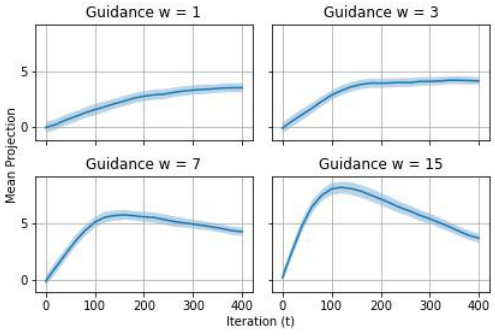
This figure shows the results of repeating the experiment in Figure 3, but this time the positive class is fixed to be the digit 7. The figure contains two subfigures: (a) Samples: A grid of generated images showing the digit 7 with different variations. (b) Trajectories: Plots of the mean projected sampling trajectories for different values of the guidance parameter (w). The plots illustrate how the trajectories change as the guidance parameter increases.
This figure shows the results of an experiment where samples are generated from a 2D mixture of uniform distributions using the probability flow ODE with guidance. The plots show both the final samples and the mean trajectory of the ODE solver for increasing values of the guidance parameter (w). The shaded area around each mean trajectory represents one standard deviation. As w increases, the samples concentrate towards the boundary of the positive class distribution, while the trajectories exhibit a characteristic ‘pullback’ effect, where the trajectory briefly moves away from the support before returning.

This figure shows the effect of guidance weight on sampling from a mixture of uniform distributions. The ground truth (a) is a 2D mixture where two classes have disjoint support. The conditional score (b), with w=0, correctly samples from the positive class conditional distribution. However, the guided score (c), with w=3, shows that increasing the guidance weight causes samples to cluster towards the boundary of the positive class, far away from the other class. This demonstrates how guidance can distort the sample distribution by focusing more on the edge of the support rather than the interior, even in a simple setting.

This figure shows the results of sampling from a 2D mixture of uniform distributions using the probability flow ODE with guidance. Four different levels of guidance weight (w = 1, 3, 7, 15) are shown. Each subplot displays the final samples (left) and the mean trajectories of the ODE (right). The mean trajectories show the average path followed by the ODE solver during the sampling process, with a shaded region indicating one standard deviation of the trajectory. The plots illustrate how increasing guidance weight concentrates the samples towards points far away from the other class support and the proportion of samples correctly sampled from the guided class.
This figure shows the effect of increasing guidance weight (w) on sampling from a mixture model. The ground truth (a) is a mixture of two uniform distributions. Using only the conditional score (b) samples are drawn from the positive class. As the guidance weight increases in (c), samples are increasingly biased toward the boundaries of the positive class, far away from the negative class.
This figure displays the results of an experiment where the authors sample from a 2D mixture of uniforms distribution using a probability flow ODE. They showcase the impact of varying guidance weights (w = 1, 3, 7, 15) on the resulting sample distribution and trajectories. The top row shows the final samples generated with each guidance weight, while the bottom row illustrates the mean trajectories of the ODE solver along with standard deviation bands. The ‘good’ sample proportion indicates the percentage of samples that end up within the support of the targeted class, highlighting the effect of guidance strength on both accuracy and diversity.

This figure shows the results of an experiment similar to Figure 4, but focusing on the positive class ‘peacock’ (ImageNet class 84) instead of a randomly selected class. It displays both sample images generated using the classifier-free guidance model and the mean projected sampling trajectories. The trajectories show the change in mean projection (a measure related to sample quality and concentration) over iterations. The ‘Error’ value likely reflects the cumulative error in score estimation and potentially other aspects of the numerical solving procedure.

This figure shows the results of an experiment comparing the sampling trajectories of a diffusion model guided towards a specific class (killer whale) in ImageNet dataset. The experiment is similar to Figure 4 in the paper, but uses a different positive class. The left panel shows sample images generated by the model for different guidance weights (w). The right panel displays the mean sampling trajectories projected onto a specific dimension, illustrating the effect of varying the guidance weight on the sampling dynamics. Error bars are included to show the variation in the mean trajectory across multiple runs. The plots show how increasing the guidance weight increases sample concentration but can lead to issues of sample diversity and model stability if the weight is too large.

This figure shows the results of an ImageNet experiment similar to those in Figure 4, but with the positive class changed to ‘basketball’. The left panel displays generated samples for various guidance parameter values (s). The right panel shows the mean projected trajectory plots alongside the error rate, illustrating the non-monotonic behavior of the trajectory and indicating that high guidance values lead to significant errors, impacting sample quality.

This figure shows the results of an ImageNet experiment where the positive class is basketball. The left panel shows samples generated using classifier-guided diffusion with different guidance parameter values (s). The right panel displays the mean projected sampling trajectories for each guidance value. Similar to previous experiments, this figure illustrates the non-monotonic behavior of the sampling process as the guidance parameter is increased. Note that the support error is not monotonically increasing, and the quality of samples is generally poor across different guidance levels.
Full paper#


