↗ OpenReview ↗ NeurIPS Homepage ↗ Chat
TL;DR#
Accurately predicting the performance of foundation models (FMs) in out-of-distribution (OOD) scenarios is crucial for their safe and effective deployment. However, evaluating OOD performance is typically challenging due to the scarcity of labeled OOD data. Existing methods often lack the versatility and efficiency required for large FMs. This research tackles this problem by leveraging the “agreement-on-the-line” phenomenon, which observes a strong linear correlation between in-distribution (ID) and OOD performance metrics.
This research investigates whether this phenomenon holds true for FMs, which undergo minimal finetuning from heavily pretrained weights. They discovered that carefully constructed ensembles, particularly through random linear head initialization, consistently induce agreement-on-the-line across different tasks and modalities. Further, they showed that this approach works even when ensembling FMs pretrained on different datasets. The proposed method demonstrates high precision in OOD performance prediction, outperforming existing techniques, especially for question-answering tasks. This study significantly advances our ability to reliably assess and improve the robustness of FMs in real-world applications.
Key Takeaways#
Why does it matter?#
This paper is crucial for researchers working with foundation models because it provides a reliable and efficient method for predicting out-of-distribution performance, a critical aspect for safe deployment. It addresses the challenges of limited labeled OOD data and offers a novel approach applicable across various tasks and modalities, thus impacting current research trends in model robustness and safety evaluation.
Visual Insights#

This figure visualizes the relationship between in-distribution (ID) and out-of-distribution (OOD) performance for accuracy and agreement in different machine learning models and datasets. It shows that when the heads of multiple model runs are randomly initialized, there is a stronger linear correlation between ID and OOD agreement, better predicting OOD accuracy. Different methods of inducing diversity in the ensembles (random head initialization, data ordering, data subsetting) are compared, illustrating the effectiveness of random head initialization in achieving this agreement-on-the-line phenomenon.

This table lists the in-distribution (ID) and out-of-distribution (OOD) datasets used in the paper’s experiments to evaluate the performance of models under distribution shift. The datasets cover various domains and types of shifts, including image classification (CIFAR, ImageNet, OfficeHome, WILDS), and natural language processing (MNLI, SNLI, SQUAD). The ID datasets represent the data used for fine-tuning the models, while the OOD datasets represent data with distribution shifts compared to the training data.
In-depth insights#
AGL for Foundation Models#
The paper explores the applicability of Agreement-on-the-Line (AGL), a method for predicting out-of-distribution (OOD) performance, to foundation models (FMs). A key challenge is that FMs, unlike classical neural networks, undergo minimal finetuning, potentially reducing ensemble diversity needed for AGL. The authors investigate various methods to induce diversity, including random linear head initialization, data ordering, and data subsetting. Surprisingly, only random head initialization reliably induces AGL across multiple vision and language benchmarks. The study also shows that ensembles of different FMs, even pretrained on diverse data, can exhibit AGL. These findings highlight the importance of careful ensemble construction to leverage AGL’s benefits in FMs. The results demonstrate that AGL can provide high-precision OOD performance predictions for FMs, surpassing other estimation methods.
Diversity in Finetuning#
The concept of ‘Diversity in Finetuning’ within the context of foundation models is crucial for achieving robust out-of-distribution (OOD) generalization. The paper highlights that lightly finetuning multiple runs from a single foundation model can yield drastically different levels of ensemble diversity, impacting the reliability of agreement-on-the-line (AGL) for OOD performance prediction. Randomly initializing the linear head emerges as the most effective approach for inducing such diversity, consistently promoting AGL across various vision and language benchmarks. However, other sources of randomness like data ordering and subsetting are less reliable. Furthermore, the study explores using multiple foundation models pretrained on different datasets, observing that carefully constructed ensembles of such models also demonstrate AGL, showcasing its broader applicability beyond single-model finetuning. This diverse ensemble approach significantly enhances the precision of AGL-based OOD performance estimation compared to alternative methods.
OOD Performance Prediction#
The paper explores out-of-distribution (OOD) performance prediction for foundation models (FMs), focusing on the phenomenon of “agreement-on-the-line” (AGL). AGL leverages the correlation between in-distribution (ID) and OOD agreement among multiple models to predict OOD accuracy, even without OOD labels. The study investigates the effectiveness of AGL on lightly finetuned FMs, highlighting the crucial role of diverse ensembles. Random initialization of linear heads emerges as a key strategy for inducing sufficient model diversity, improving OOD performance estimation. The research also examines the use of ensembles from multiple base FMs, demonstrating that careful ensemble construction is vital for reliable AGL-based predictions. The results show AGL’s versatility across various tasks and modalities, showcasing its potential for robust OOD performance estimation in FMs.
AGL Across Modalities#
The concept of “AGL Across Modalities” in the context of foundation models (FMs) suggests that the agreement-on-the-line (AGL) phenomenon, where a strong linear correlation exists between in-distribution (ID) and out-of-distribution (OOD) agreement among models, generalizes across different data types or modalities (image, text). This is significant because it implies that a single method of OOD performance estimation using AGL can be applied to various FMs trained on different tasks and datasets. The success of this approach, however, crucially depends on carefully ensuring diversity within the model ensembles, often achieved through random initialization of the linear head, rather than methods like data ordering or subsetting which may lead to less reliable results. This implies practical advantages by using AGL in a wide range of applications. A careful consideration of ensemble diversity is crucial for the reliability of AGL-based methods.
Limitations of AGL#
The Agreement-on-the-Line (AGL) method, while promising for out-of-distribution (OOD) performance prediction, has limitations. AGL’s reliance on a strong linear correlation between in-distribution (ID) and OOD performance may not hold for all distribution shifts. This limits its generalizability and predictive power in diverse scenarios. The diversity of the ensemble is crucial for AGL to succeed, but achieving this diversity through simple techniques such as data shuffling or subsetting may be unreliable. Careful ensemble construction is needed, and the choice of randomness (e.g., head initialization) significantly impacts AGL’s effectiveness. Finally, while AGL offers a computationally efficient approach, it does not provide theoretical guarantees, especially when applied to lightly finetuned foundation models. Further research is needed to explore the robustness and expand the applicability of AGL.
More visual insights#
More on figures

This figure shows the in-distribution (ID) versus out-of-distribution (OOD) accuracy and agreement for different models and datasets. Each point represents either a single model’s performance (blue) or the agreement between a pair of models (orange). The lines show the linear relationship between ID and OOD performance, illustrating the ‘agreement-on-the-line’ (AGL) phenomenon.

This figure shows that the agreement-on-the-line (AGL) phenomenon holds for ensembles of foundation models finetuned from different base models (Llama, GPT, OPT) across different tasks and datasets. Even when the out-of-distribution (OOD) performance drop is minimal (because of a small distribution shift), AGL is still observed. This suggests that AGL is a robust phenomenon that is not sensitive to the magnitude of the distribution shift.

This figure visualizes the relationship between in-distribution (ID) and out-of-distribution (OOD) performance for accuracy and agreement in various fine-tuned model ensembles. It shows that randomly initializing the linear head during fine-tuning produces the most consistent linear relationship between ID and OOD performance across different datasets and model architectures.

This figure visualizes the relationship between in-distribution (ID) and out-of-distribution (OOD) performance for accuracy and agreement in multiple fine-tuned model ensembles. Each point represents either a model’s performance (accuracy) or the agreement between a pair of models. The figure demonstrates that across various datasets and fine-tuning methods, the approach of randomly initializing the linear head during model training creates the strongest agreement on the linear fit between ID and OOD accuracy, a key element for the AGL method.

This figure visualizes the relationship between in-distribution (ID) and out-of-distribution (OOD) performance for accuracy and agreement in various fine-tuned model ensembles. It shows that randomly initializing the linear head in the models leads to better alignment between the accuracy and agreement trends across different datasets (CIFAR10, MNLI, SQUAD) and fine-tuning methods (linear probing, full fine-tuning).

This figure visualizes the relationship between in-distribution (ID) and out-of-distribution (OOD) performance of different models. It demonstrates the concept of ‘agreement-on-the-line’ by showing how the agreement between multiple model predictions on ID data correlates linearly with their OOD accuracy. The figure showcases this relationship across various datasets and fine-tuning strategies, highlighting the importance of random head initialization in achieving a strong linear correlation.

This figure shows the ID vs OOD accuracy and agreement for various datasets using linear probed CLIP models. The ensembles were created by using diverse random initializations. The results demonstrate that AGL (agreement-on-the-line) and ACL (accuracy-on-the-line) hold across various benchmarks when using diverse random initializations to create the ensembles. However, it also shows that neither AGL nor ACL holds for the Camelyon17-WILDS dataset.

This figure shows the results of applying the Agreement-on-the-Line (AGL) method to predict the out-of-distribution (OOD) performance of models on ImageNetV2 dataset. Three different variations of the ImageNetV2 dataset are used as OOD data: ImageNetV2 Top Images, ImageNetV2 Threshold 0.7, and ImageNetV2 Matched Frequency. The x-axis represents the in-distribution (ID) accuracy, and the y-axis represents the OOD accuracy. Each point represents a single model in an ensemble, and the blue points are the ensemble members. The orange points show the agreement of pairs of models within the ensemble, and the dashed lines are the linear fits for both accuracy and agreement. The results show a strong linear correlation between ID accuracy and OOD accuracy as well as between ID agreement and OOD agreement, supporting the validity of the AGL method for estimating OOD performance on ImageNetV2 dataset.

This figure shows the ID vs OOD performance of several models trained on different datasets. It demonstrates how the agreement between multiple models relates to their individual accuracy on in-distribution (ID) and out-of-distribution (OOD) data. The different columns show different methods for creating ensemble diversity, highlighting that random head initialization leads to the strongest linear correlation between agreement and accuracy.

This figure shows the in-distribution (ID) vs out-of-distribution (OOD) accuracy and agreement for different datasets and fine-tuned ensembles. Each point represents either an ensemble member’s accuracy (blue) or a pair of ensemble members’ agreement (orange). The x-axis represents ID performance and the y-axis represents OOD performance. Different columns represent different ways of diversifying the ensembles: random heads, data ordering, and data subsetting. The results suggest that randomly initializing the head during fine-tuning is the most effective method for inducing a linear relationship between ID and OOD performance, as indicated by the alignment between the accuracy and agreement lines.

This figure shows the ID vs OOD accuracy and agreement for three different tasks and finetuning methods. The plots show a clear linear relationship between ID and OOD performance and the consistency of the relationship across different random initializations of the linear head.

This figure shows the in-distribution (ID) vs. out-of-distribution (OOD) performance of different fine-tuned models across several datasets. The plots illustrate the relationship between accuracy (orange dots) and agreement (blue dots) for various ensemble generation methods. It demonstrates that randomly initializing the linear head during finetuning yields the strongest linear correlation between ID and OOD performance, while the other methods show less agreement.

This figure shows the in-distribution (ID) vs. out-of-distribution (OOD) performance of different models, trained on various datasets and using different fine-tuning strategies. Each point represents either the accuracy (orange) or agreement (blue) of the ensemble members. The x-axis represents the ID performance and the y-axis the OOD performance. The figure demonstrates the concept of ‘agreement-on-the-line’ where the correlation between ID and OOD performance is linear. Different columns show different methods to increase diversity of models within ensemble.

This figure visualizes the relationship between in-distribution (ID) and out-of-distribution (OOD) performance for accuracy and agreement in various fine-tuned ensemble models. Each point represents either a model’s ID/OOD accuracy or the agreement between two models on the ID/OOD task. The different columns show results for different datasets (CIFAR10, MNLI, SQUAD) and different model fine-tuning techniques. The key finding is that random head initialization, as a way to diversify the ensemble, produces the closest linear agreement between ID and OOD accuracy.

This figure visualizes the relationship between in-distribution (ID) and out-of-distribution (OOD) performance for accuracy and agreement in different fine-tuned model ensembles. The plots demonstrate how the agreement between multiple models correlates with their accuracy on both ID and OOD data, especially when using random head initialization as a source of ensemble diversity.
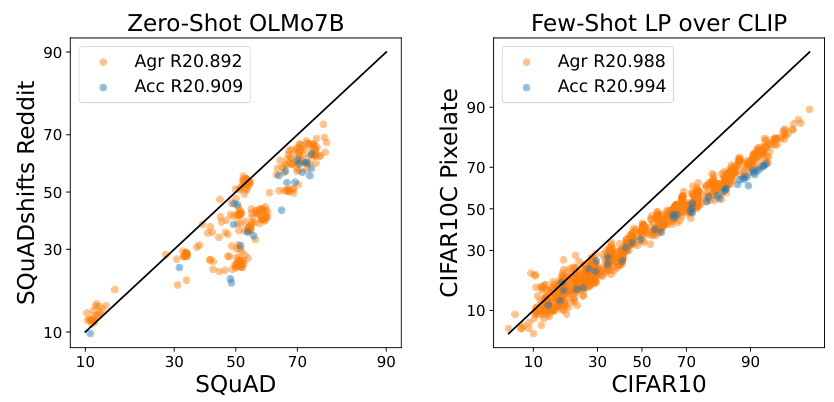
This figure compares the performance of zero-shot and few-shot learning approaches on two different tasks. The left panel shows the ID vs OOD performance (accuracy and agreement) for a zero-shot large language model (OLM) evaluated on question answering. The linear correlation between ID and OOD is weak, indicating that the model’s performance is not consistently affected by distribution shifts. The right panel shows the same for a few-shot model trained on a smaller dataset of images (CIFAR-10) and tested on corrupted images (CIFAR-10C). Here, the correlation is strong, and a clear linear relationship between in-distribution (ID) and out-of-distribution (OOD) performance is apparent. This suggests that few-shot learning may provide more robust OOD performance.

This figure shows the ID vs. OOD accuracy and agreement for different datasets and fine-tuned models. Each point represents either a single model’s performance (blue) or the agreement between two models (orange). The x-axis represents in-distribution (ID) performance, and the y-axis represents out-of-distribution (OOD) performance. The figure demonstrates that when using randomly initialized heads to create diverse ensembles, there is a stronger linear correlation between the ID and OOD agreement, suggesting that this approach is more effective at predicting OOD performance.
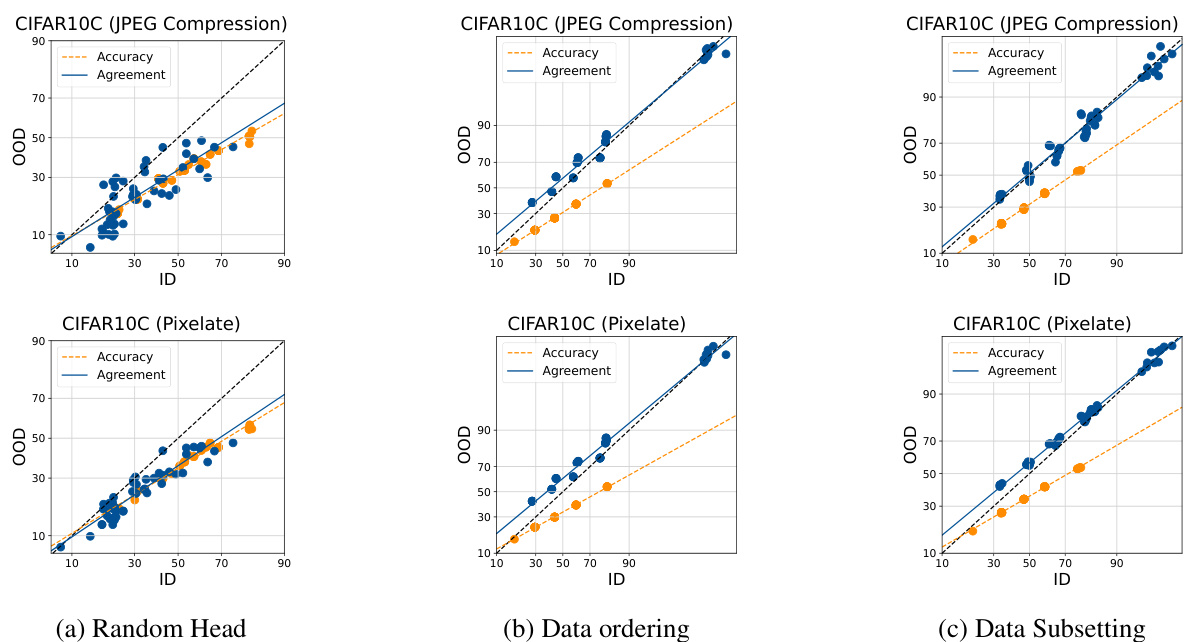
This figure displays the ID vs OOD accuracy and agreement for multiple datasets and fine-tuned ensemble models. It visualizes the ‘agreement-on-the-line’ phenomenon, showing the relationship between in-distribution (ID) and out-of-distribution (OOD) performance. The plot demonstrates how different methods of generating ensembles (random head initialization, data ordering, data subsetting) affect the level of agreement and its linear correlation with accuracy. The results suggest that random head initialization is the most effective method for inducing agreement-on-the-line in finetuned foundation models.

This figure visualizes the relationship between in-distribution (ID) and out-of-distribution (OOD) performance for accuracy and agreement across different datasets and fine-tuned model ensembles. It shows scatter plots where each point represents either a single model’s ID and OOD accuracy (blue dots) or the agreement between pairs of models on ID and OOD (orange dots). The figure demonstrates that randomly initializing the linear head during finetuning is most effective in creating diverse ensembles that exhibit a strong linear correlation between ID and OOD agreement.
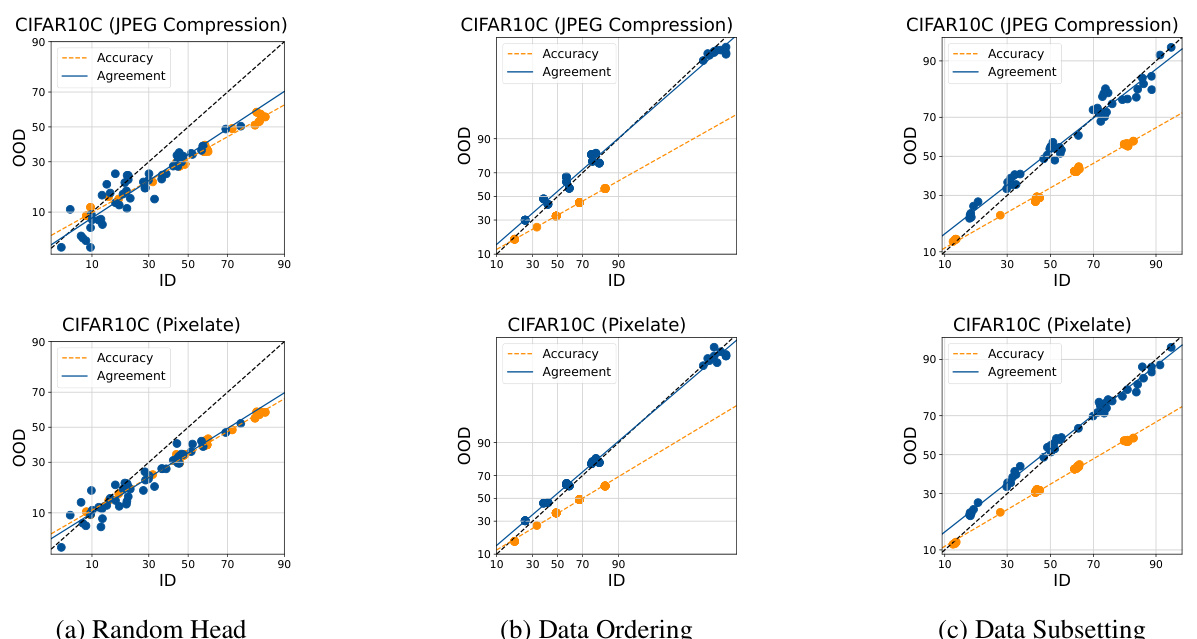
This figure displays the in-distribution (ID) versus out-of-distribution (OOD) performance of various foundation models across different datasets. Each point represents either the accuracy of a single model or the agreement between two models in the ensemble. The color orange represents accuracy and the color blue represents agreement. The figure shows that ensembles with randomly initialized heads exhibit a stronger linear correlation between ID and OOD performance, suggesting that this method of creating an ensemble is effective for predicting OOD performance.

This figure shows the in-distribution (ID) versus out-of-distribution (OOD) accuracy and agreement for different datasets and fine-tuned model ensembles. Each point represents either a single model’s performance (accuracy) or the agreement between a pair of models. The color-coding and arrangement highlight how different methods of creating diverse ensembles affect the relationship between ID and OOD performance, demonstrating that randomly initializing the head (a key component in the models) produces the strongest linear correlation between ID and OOD performance.

This figure displays the in-distribution (ID) vs out-of-distribution (OOD) performance of various models in terms of accuracy and agreement. Each point represents a single model (blue) or a model pair (orange), showing their ID and OOD performance. The goal is to demonstrate that ensembles generated with different random initializations during fine-tuning, specifically random head initialization, produce the closest linear correlation between ID and OOD performance, suggesting their use for accurately predicting OOD performance.

This figure visualizes the relationship between in-distribution (ID) and out-of-distribution (OOD) performance for accuracy and agreement in various fine-tuned model ensembles. The plots show how the agreement between models correlates with their accuracy on both ID and OOD data. The key finding is that random head initialization leads to a better linear relationship between agreement and accuracy.
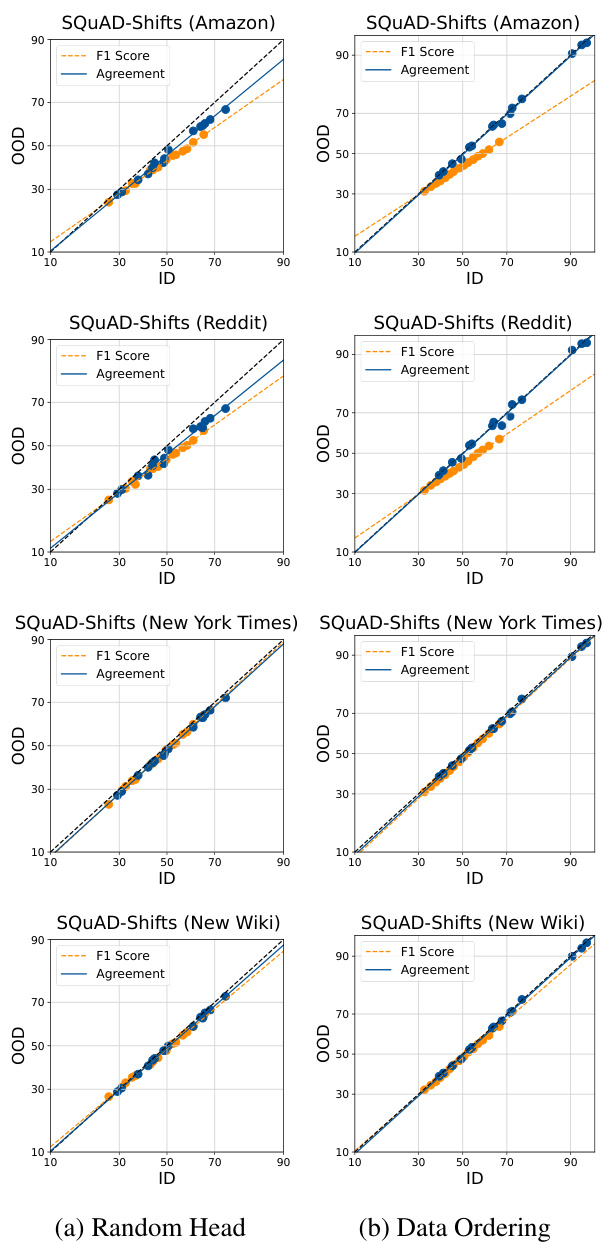
This figure shows the in-distribution (ID) vs. out-of-distribution (OOD) performance of different models in terms of accuracy and agreement. It evaluates three methods of introducing diversity into the finetuning process to observe agreement-on-the-line (AGL): random head, data ordering and data subsetting. Results show that ensembles generated using random head initialization show the closest agreement between ID and OOD performance.
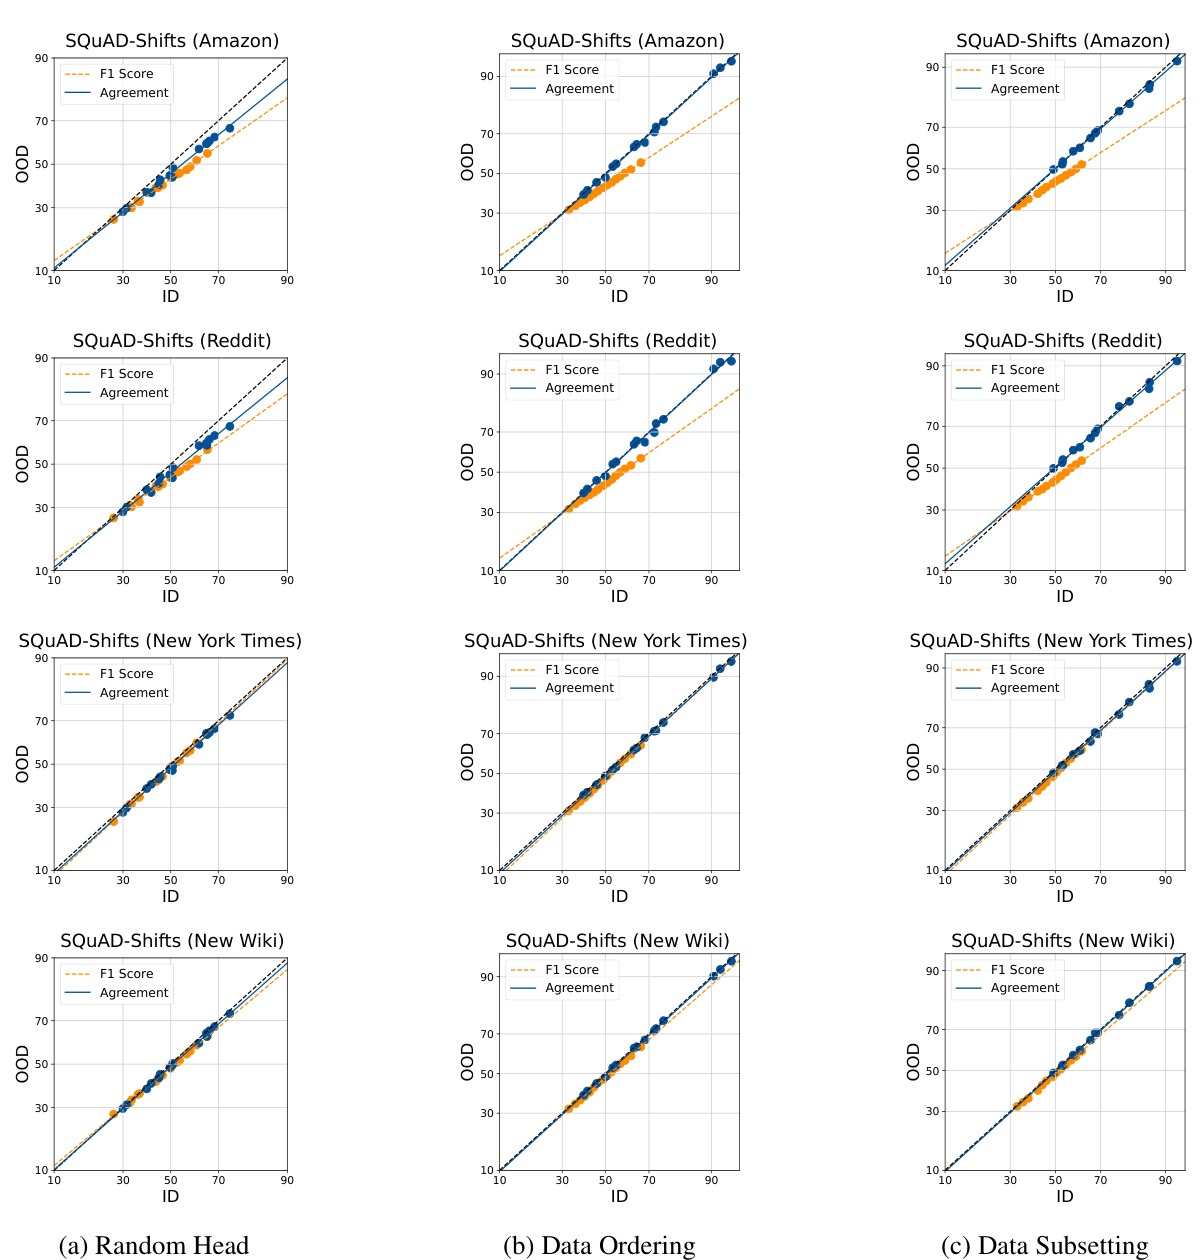
This figure displays the ID vs OOD accuracy and agreement for various datasets and fine-tuned ensembles, comparing three different ways of introducing randomness during training. Each point shows either a model’s performance (accuracy) or the agreement between pairs of models. The results show that randomly initializing the linear head provides the best agreement between in-distribution and out-of-distribution performance.

This figure visualizes the relationship between in-distribution (ID) and out-of-distribution (OOD) performance in terms of accuracy and agreement for several fine-tuned model ensembles. Each point represents either a single model’s accuracy (blue) or the agreement between two models (orange) across ID and OOD performance. Different columns show ensembles created through varying methods (random head initialization, data ordering, data subsetting) applied to models finetuned for different tasks and datasets. The results suggest that ensembles created using random head initialization have a linear correlation between ID and OOD performance that best matches the observed agreement.
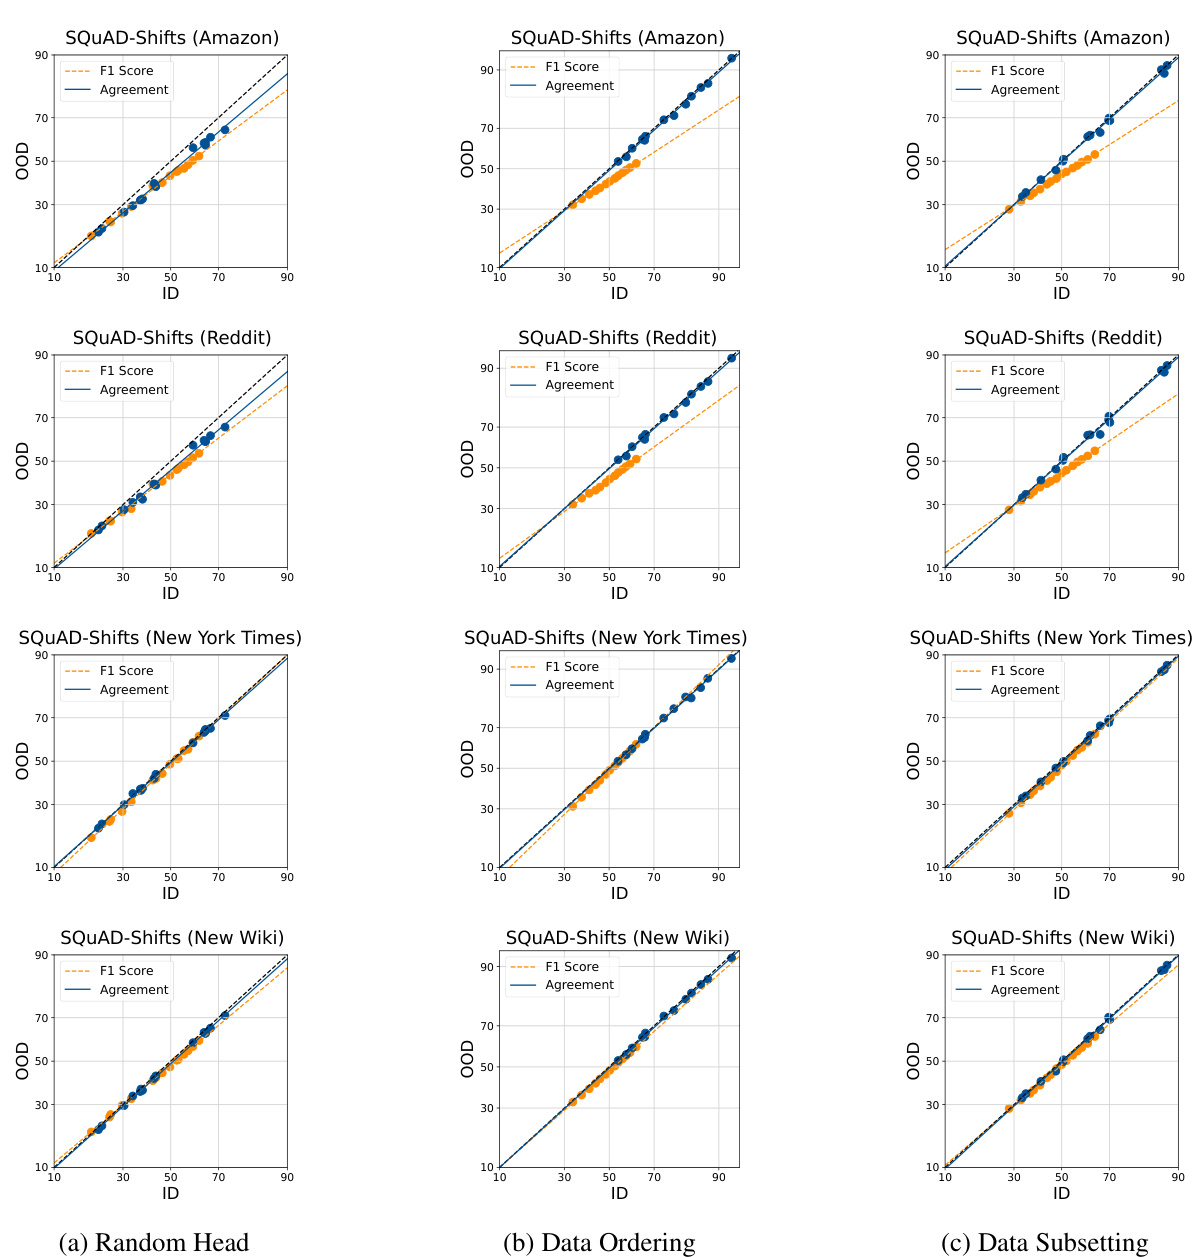
This figure shows the relationship between in-distribution (ID) and out-of-distribution (OOD) performance of various models. It visualizes ‘agreement-on-the-line’ (AGL) for different datasets and fine-tuning strategies. Each point represents a model’s ID and OOD performance (accuracy or agreement), and the linear fit assesses the strength of AGL. The results suggest that random head initialization produces the strongest agreement between ID and OOD performance.
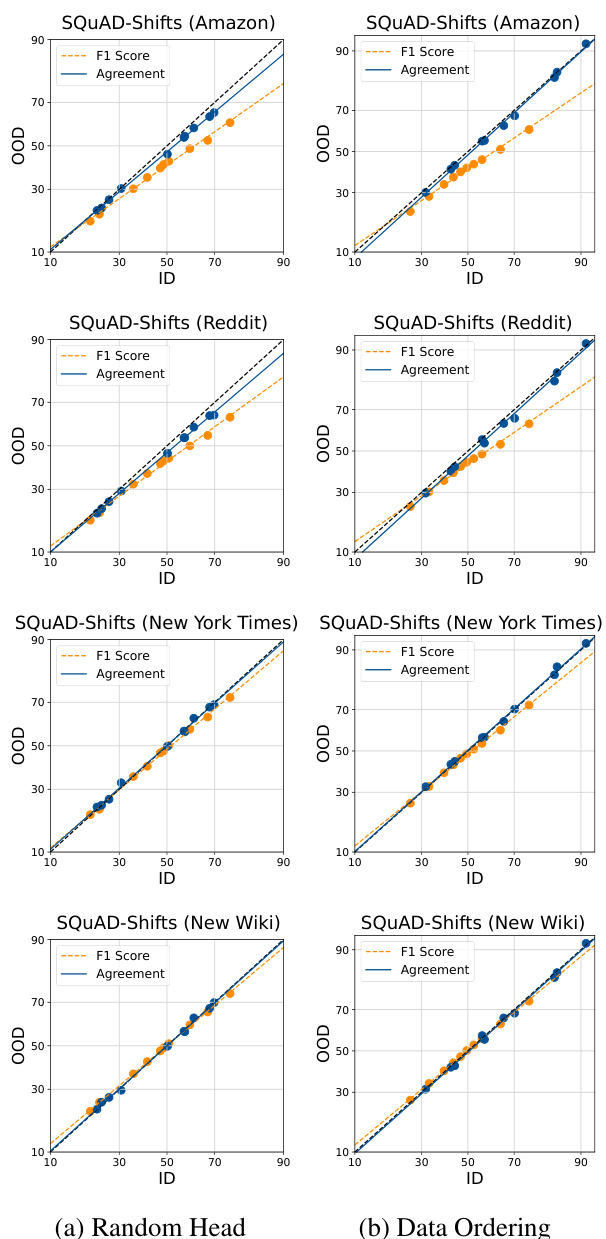
This figure shows the in-distribution (ID) vs out-of-distribution (OOD) performance of different models in terms of accuracy and agreement. It demonstrates the ‘agreement-on-the-line’ phenomenon for various datasets and fine-tuned ensembles, highlighting that randomly initializing the head helps to achieve a closer linear fit between agreement and accuracy. The figure shows the impact of different sources of diversity (random head, data ordering, and data subsetting) on the agreement-on-the-line phenomenon.
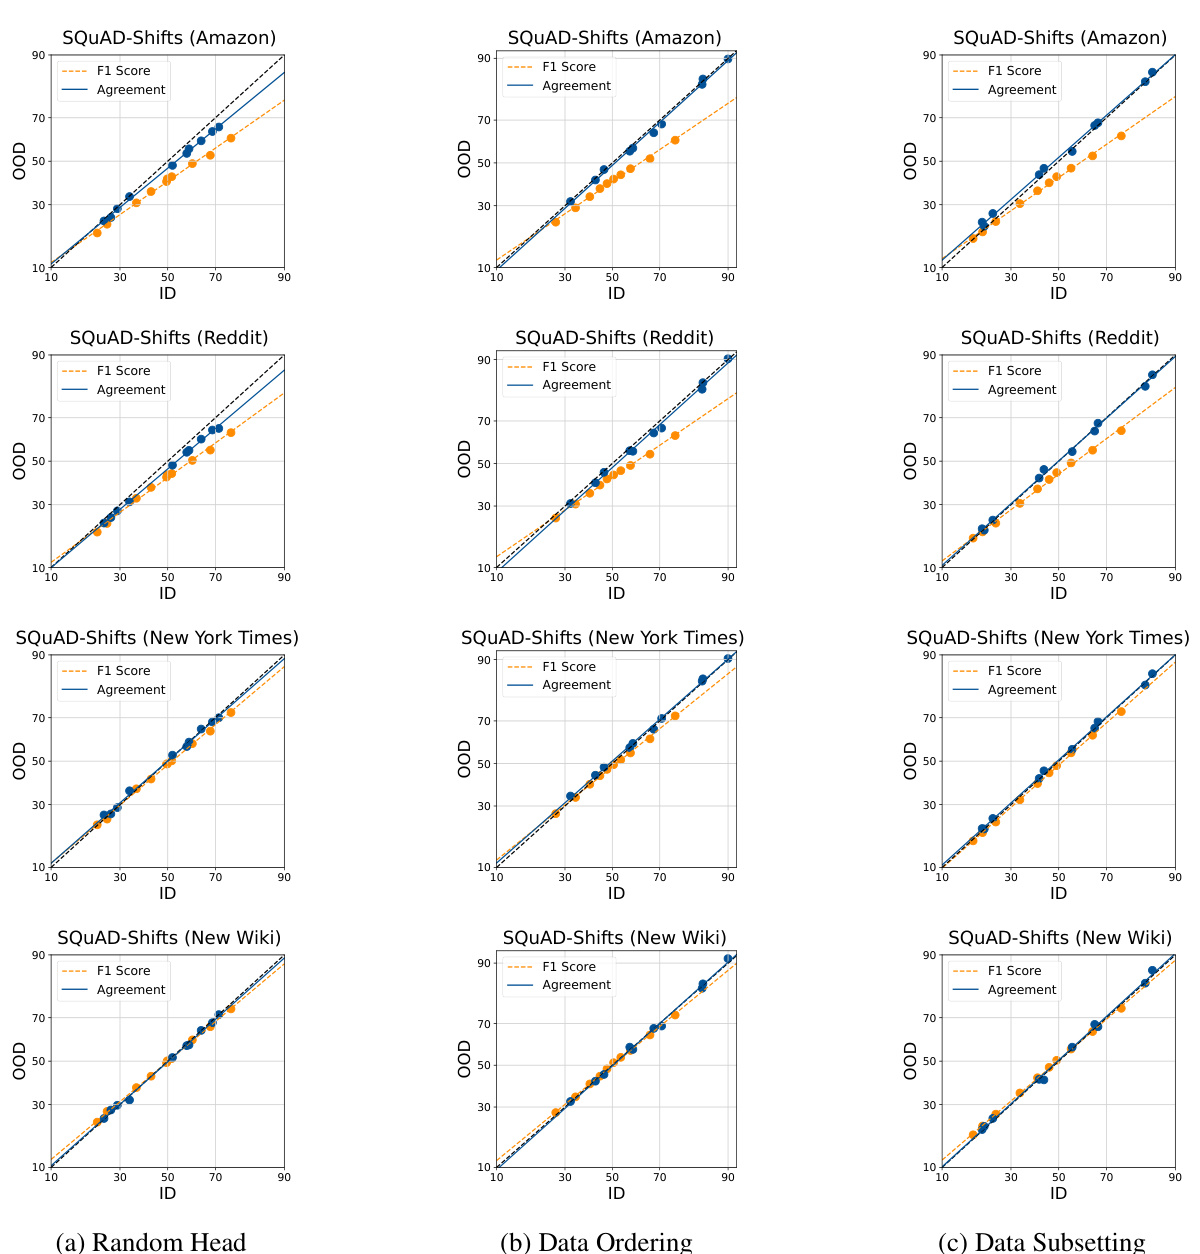
This figure visualizes the relationship between in-distribution (ID) and out-of-distribution (OOD) performance for accuracy and agreement in multiple fine-tuned model ensembles across three datasets: CIFAR10, MNLI, and SQUAD. Each point represents either a single model’s accuracy (blue) or the agreement between two models (orange), plotted against their respective ID and OOD performance. The figure demonstrates that randomly initializing the linear head during fine-tuning is the most effective approach to generating diverse ensembles exhibiting the strongest linear correlation between ID and OOD performance (agreement-on-the-line phenomenon).

This figure displays the in-distribution (ID) versus out-of-distribution (OOD) accuracy and agreement for three different fine-tuned model ensembles across three distinct datasets. Each point represents either a model’s accuracy (blue) or the agreement between two models (orange). The figure demonstrates how different methods of introducing diversity during the fine-tuning process affect the linear relationship between ID and OOD performance, highlighting the effectiveness of random head initialization in inducing agreement-on-the-line (AGL).
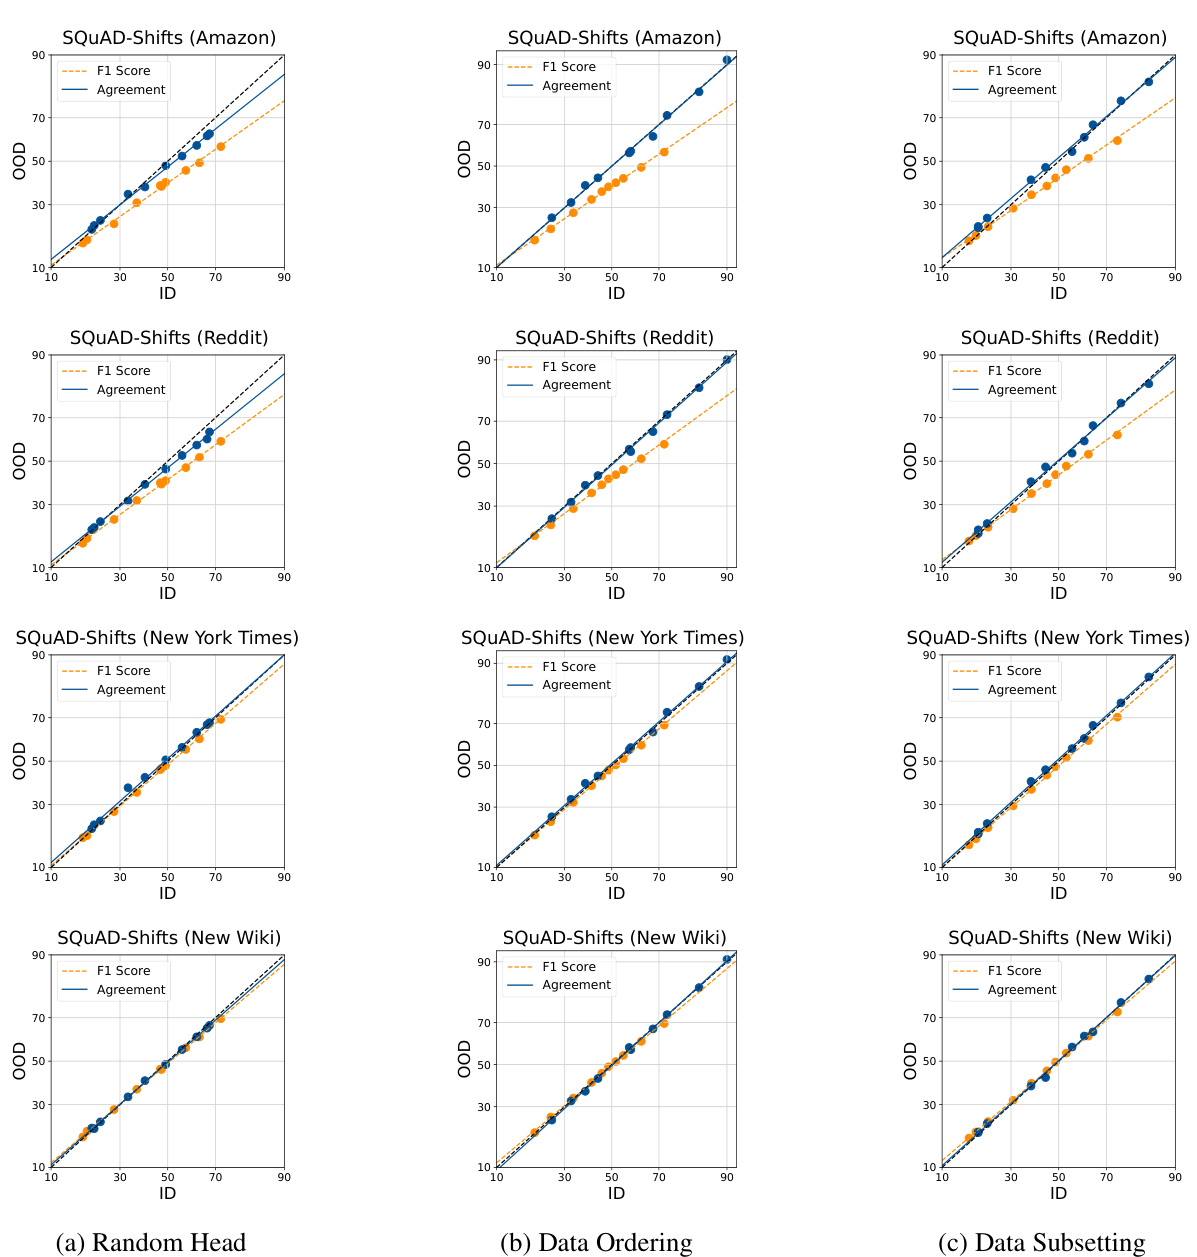
This figure visualizes the relationship between in-distribution (ID) and out-of-distribution (OOD) performance for accuracy and agreement in several different fine-tuned model ensembles. The plots show that there is a linear correlation between ID and OOD performance, and this correlation is strongest when the ensemble diversity is introduced by randomizing the linear head initialization during finetuning. Different datasets and model architectures are used to demonstrate the robustness of the findings across various tasks and domains.

This figure shows the in-distribution (ID) versus out-of-distribution (OOD) performance of different models. It compares accuracy (orange dots) and agreement (blue dots) across several datasets (CIFAR10C, SNLI, SQUAD-Shifts) and fine-tuning methods. The key finding illustrated is that randomly initializing the model’s head during finetuning leads to the strongest linear correlation between ID and OOD performance, which is closer to the ideal agreement.

This figure shows the in-distribution (ID) versus out-of-distribution (OOD) accuracy and agreement for different fine-tuned ensembles across multiple datasets and tasks. The plots show that there is a linear correlation between ID and OOD performance (both accuracy and agreement), and this correlation is strongest when the linear head is randomly initialized during the finetuning process.

This figure visualizes the relationship between in-distribution (ID) and out-of-distribution (OOD) performance for accuracy and agreement in various fine-tuned model ensembles. Each point represents either an individual model’s ID/OOD accuracy or the agreement between two models on ID/OOD data. The figure showcases that using different random initialization methods during finetuning impacts the diversity of the model ensembles and their respective agreement-on-the-line (AGL) properties. In particular, only random head initialization reliably induces AGL across different datasets and tasks.
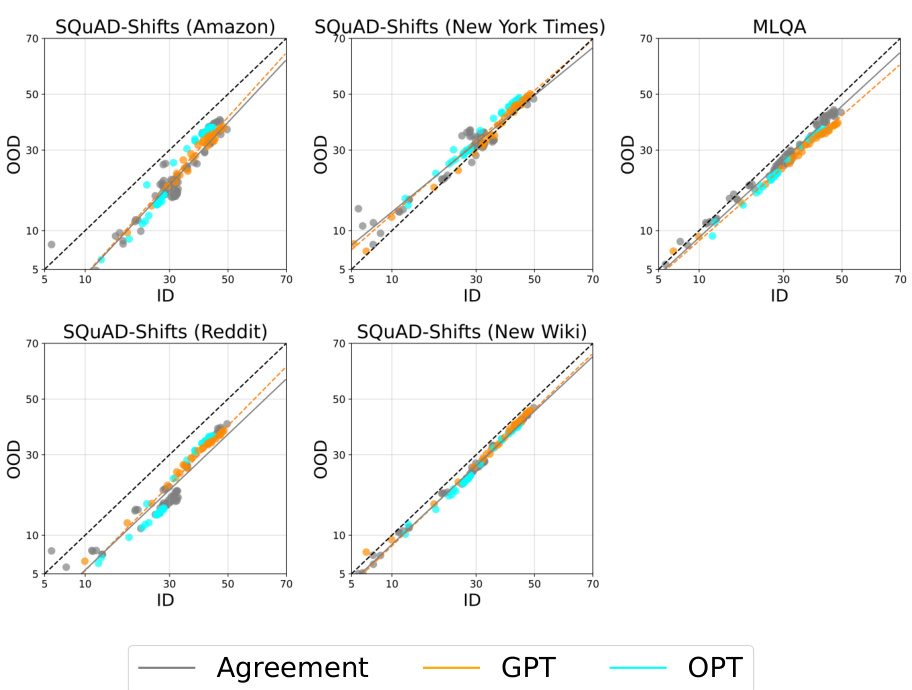
This figure shows that the agreement-on-the-line (AGL) phenomenon holds for ensembles of models finetuned from different base foundation models (Llama, GPT, OPT) on question answering and text classification tasks. Even when the out-of-distribution (OOD) performance drop is small because of a small distribution shift, AGL still holds. This suggests that AGL is robust to the magnitude of the distribution shift.
This figure displays the accuracy and agreement of in-distribution (ID) vs. out-of-distribution (OOD) data for various models and datasets. It shows how different methods of introducing diversity into an ensemble of finetuned foundation models impact the agreement-on-the-line (AGL) phenomenon. The plots demonstrate that randomly initializing the linear head during finetuning is most effective for achieving a strong linear correlation between ID and OOD agreement. The datasets used include image classification (CIFAR) and natural language processing (SNLI and SQUAD).

This figure shows the in-distribution (ID) versus out-of-distribution (OOD) accuracy and agreement for different fine-tuned ensembles. The plots demonstrate the ‘agreement-on-the-line’ (AGL) phenomenon, where a linear relationship exists between ID and OOD agreement, mirroring a similar relationship between ID and OOD accuracy. The figure highlights the impact of different methods for introducing diversity into the ensemble, showing that random head initialization is the most effective in inducing AGL across various datasets and models.
More on tables

This table presents the Mean Absolute Percentage Error (MAPE) of the ALine-D algorithm for predicting out-of-distribution (OOD) performance. The MAPE is calculated for three different sources of diversity in model ensembles: random linear heads, data ordering, and data subsetting. The results are shown for four different datasets: CIFAR10C, SQUAD-Shifts Amazon, SQUAD-Shifts Reddit, and SNLI. The table shows that random linear heads yield the lowest MAPE across all datasets, indicating that this diversity strategy is most effective for accurate OOD performance prediction.

This table presents the Mean Absolute Percentage Error (MAPE) in estimating out-of-distribution (OOD) performance using two AGL-based methods (ALine-D and ALine-S), and several other baseline methods. The diverse ensemble was constructed by using multiple base models and randomizing the linear initialization. The asterisk (*) indicates that datasets with low correlation in agreement were excluded.

This table compares the correlation coefficient between the predicted OOD accuracy from ALine-D and ProjNorm methods against the actual OOD accuracy for two different datasets: SQUAD-Shifts Amazon and SQUAD-Shifts Reddit. It demonstrates the stronger correlation of ALine-D’s predictions with the ground truth OOD accuracy compared to ProjNorm.

This table presents the Mean Absolute Percentage Error (MAPE) for various OOD performance estimation methods. It compares AGL-based methods (ALine-D, ALine-S) against other baselines (Naive Agr, ATC, AC, DOC-Feat). The diverse ensemble was created by using different random linear initializations and multiple base models. The asterisk (*) indicates that datasets with low correlation in agreement were excluded.

This table shows the hyperparameters used for CLIP linear probing experiments on various datasets. These hyperparameters include the learning rate and batch size. Different hyperparameters were used for different datasets to achieve an even distribution of in-distribution accuracies.
This table shows the mean absolute percentage error (MAPE) of the ALine algorithm in estimating out-of-distribution (OOD) performance for fully fine-tuned CLIP models across 19 different CIFAR10-C corruption types. The results are broken down by the source of diversity in the model ensemble (random linear heads, data ordering, data subsetting), highlighting that using random linear heads leads to the lowest MAPE, indicating better OOD performance prediction accuracy.

This table presents the Mean Absolute Percentage Error (MAPE) of different methods in predicting out-of-distribution (OOD) performance. It compares AGL-based methods (ALine-D, ALine-S) to other baselines (ATC, AC, DOC-Feat, Naive Agr). The diverse ensemble is created by combining models with randomized linear initializations and multiple base models. The table highlights which OOD datasets have been filtered due to a low correlation in agreement.
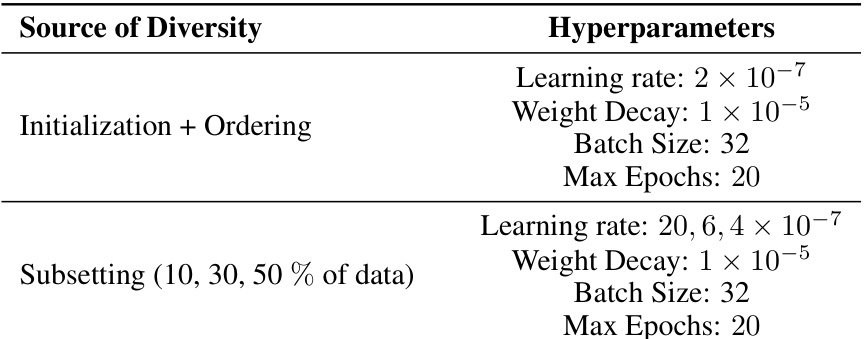
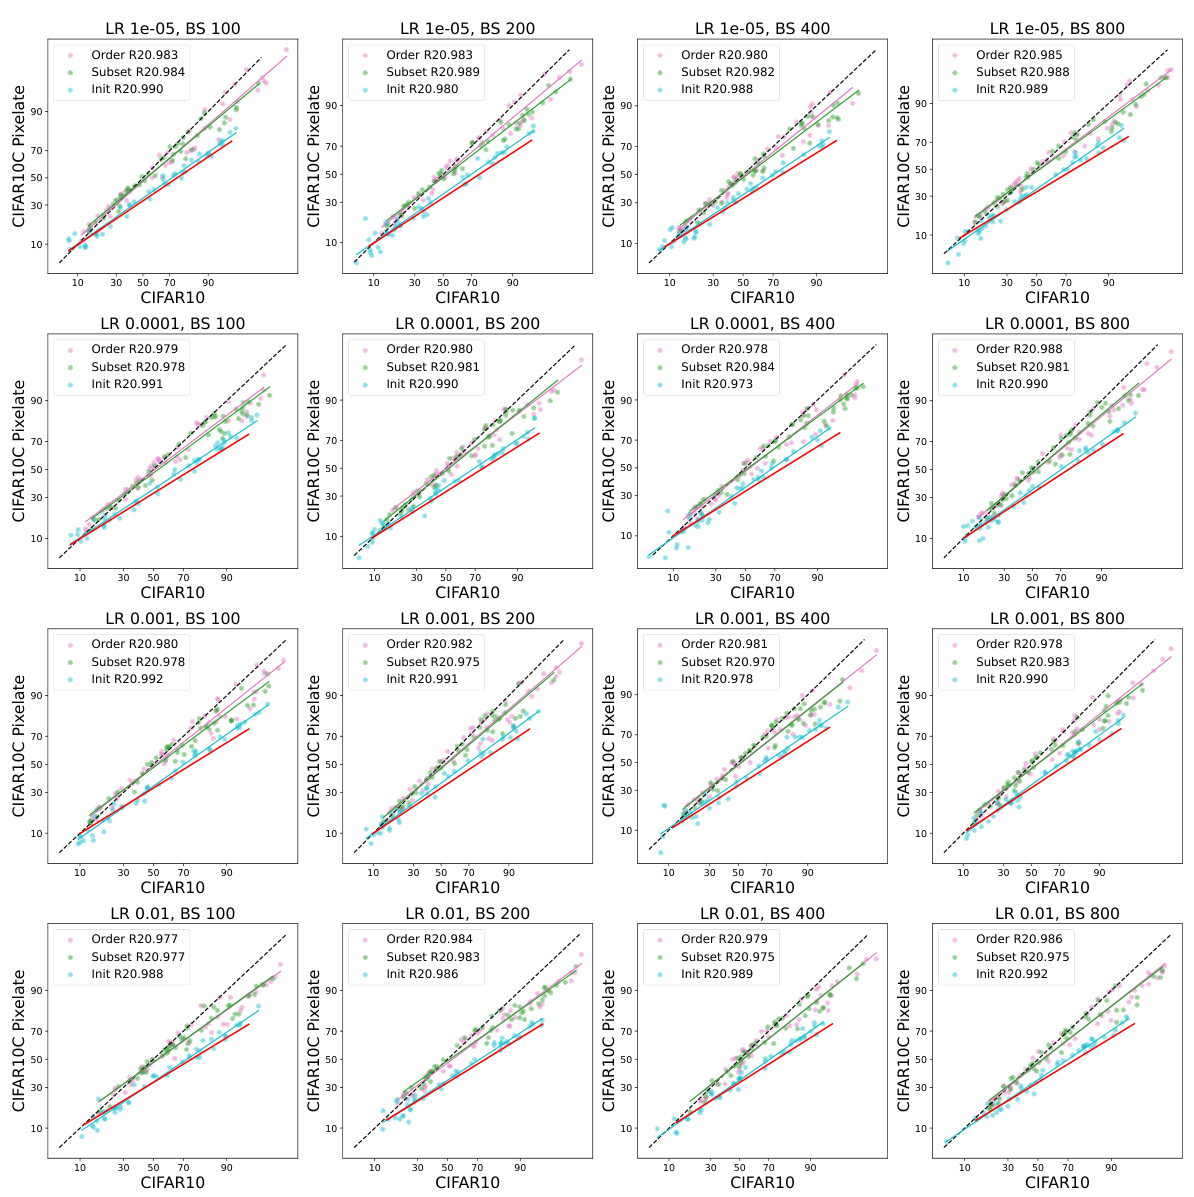
This table shows the average Mean Absolute Percentage Error (MAPE) of the ALine method for estimating out-of-distribution (OOD) performance of CLIP models finetuned on CIFAR10 and evaluated on CIFAR10C. It compares the performance using different sources of diversity: random linear heads, data ordering, and data subsetting. The results demonstrate that only the models with diverse random linear head initialization consistently achieve the smallest MAPE, highlighting the importance of this diversity source for accurate OOD performance prediction.
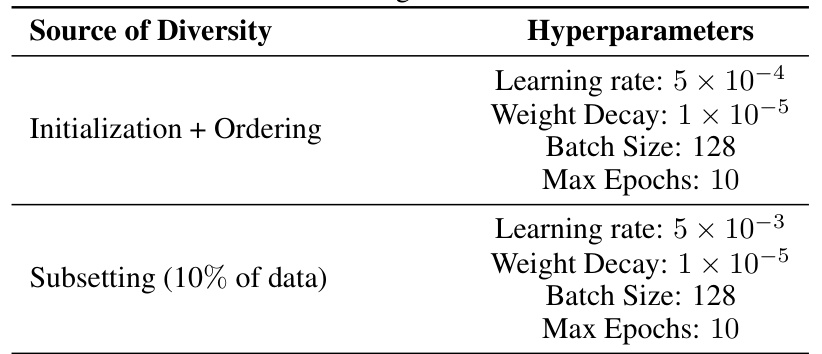
This table shows the mean average percentage error (MAPE) of the ALine algorithm for estimating out-of-distribution (OOD) performance for fully fine-tuned CLIP models on 19 CIFAR10-C corruption datasets. It compares the performance using three different sources of ensemble diversity: random linear heads, data ordering, and data subsetting. The results demonstrate that ensembles created using random linear head initialization are significantly more accurate at predicting OOD performance than ensembles created using the other two methods.
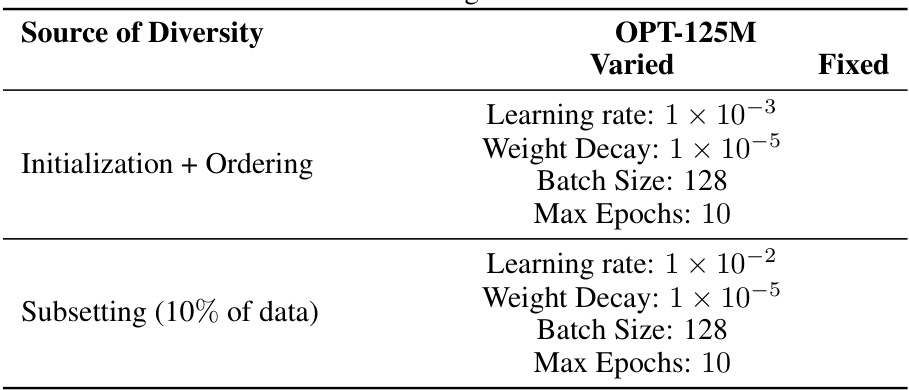
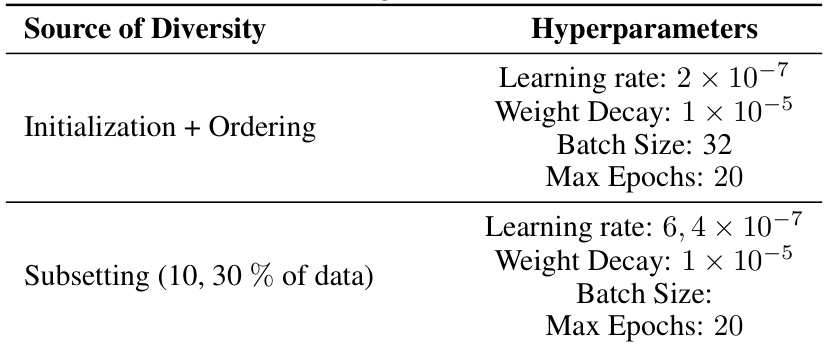
This table shows the hyperparameters used for full finetuning the OPT-125M language model on the MNLI dataset. It breaks down the hyperparameters used for two different diversity strategies: (1) Initialization + Ordering, where the model’s initialization and data ordering were varied; and (2) Subsetting (10% of data), where the model used a subset of 10% of the data, with the learning rate as the varied hyperparameter. For each strategy, the table lists the learning rate, weight decay, batch size, and maximum number of epochs.

This table presents the Mean Absolute Percentage Error (MAPE) of the ALine-S algorithm for estimating out-of-distribution (OOD) performance. The results are broken down by the OfficeHome domain used for training (Art, ClipArt, Product, Real) and the source of diversity in the ensemble (Random Linear Heads, Data Ordering, Data Subsetting). Lower MAPE values indicate better OOD performance estimation.

This table shows the mean absolute percentage error (MAPE) of the ALine algorithm for estimating out-of-distribution (OOD) performance of CLIP models. The models are fully finetuned on the CIFAR10 dataset and tested on the CIFAR10-C dataset (19 different corruption types). The table compares the performance of three different methods for creating model ensembles: random linear heads, data ordering, and data subsetting. Results show that the ensemble with randomly initialized linear heads performs significantly better (lower MAPE) in estimating OOD performance.

This table presents the mean average percentage error (MAPE) of the ALine-D algorithm for estimating out-of-distribution (OOD) performance. The ALine-D algorithm leverages the ‘agreement-on-the-line’ phenomenon for OOD estimation. The table shows the MAPE values for three different sources of ensemble diversity: random linear heads, data ordering, and data subsetting, on two different SQUAD-Shifts datasets: Amazon and Reddit.

This table shows the Mean Absolute Percentage Error (MAPE) of the ALine-D algorithm in estimating out-of-distribution (OOD) performance for BERT models that were fully fine-tuned on the SQUAD dataset. The MAPE is calculated for different methods of introducing diversity during training: random linear heads, data ordering, and data subsetting. The results are shown for two OOD datasets: SQUAD-Shifts Amazon and SQUAD-Shifts Reddit. Lower MAPE values indicate better performance of the ALine-D algorithm in predicting OOD performance.

This table presents the mean absolute percentage error (MAPE) of the ALine-D method for estimating out-of-distribution (OOD) accuracy on the Stanford Natural Language Inference (SNLI) dataset. The MAPE is calculated for three different methods of introducing diversity into the model ensembles: Random Linear Heads, Data Ordering, and Data Subsetting. Lower MAPE values indicate better accuracy of the OOD performance estimation.

This table presents the Mean Absolute Error (MAE) of the ALine-S algorithm for estimating out-of-distribution (OOD) performance in generative question-answering tasks. It compares the performance of three different methods for introducing diversity into the model ensemble: random linear heads, data ordering, and data subsetting. The MAE values are shown for four different SQuAD-Shifts datasets (Amazon, Reddit, New Wiki, and NYT). Lower MAE values indicate better OOD performance prediction.

This table presents the Mean Absolute Error (MAE) values obtained using the ALine-S method for estimating out-of-distribution (OOD) performance in generative question-answering tasks. Different sources of diversity in model training (random linear heads, data ordering, and data subsetting) are compared across four different SQUAD-Shifts datasets (Amazon, Reddit, New Wiki, and NYT). The MAE values reflect the average error in the OOD performance prediction for each dataset and diversity method.
Full paper#


