TL;DR#
Large language models (LLMs) are evaluated using public benchmarks, but data contamination inflates their performance, hindering reliable comparisons. Current detection methods are easily bypassed, failing to quantify contamination’s impact. This paper addresses these issues. The proposed approach, ConStat, uses a statistical method that effectively identifies and quantifies contamination by comparing performance across multiple benchmarks and reference models. It’s robust against evasion techniques, offering a reliable solution for evaluating and comparing LLMs.
ConStat’s key contribution lies in its novel definition of contamination as artificially inflated performance that doesn’t generalize to rephrased samples, synthetic data, or similar tasks. The method directly compares the model’s actual performance to its expected performance (based on reference models and a secondary benchmark) and uses bootstrapping to quantify the contamination’s magnitude with a p-value. This work was thoroughly evaluated on several model architectures, contamination scenarios, and benchmarks, showcasing its effectiveness in an extensive evaluation and highlighting significant levels of contamination in several prominent LLMs. This offers a valuable improvement over existing methods for evaluating LLMs.
Key Takeaways#
Why does it matter?#
This paper is crucial for researchers working with large language models (LLMs) because it introduces a novel method to reliably detect and quantify data contamination, a significant problem affecting model evaluation and comparison. It challenges the traditional definition of contamination, offering a more practical and robust approach that is less susceptible to evasion. The findings will improve benchmark reliability and help establish more trustworthy model comparisons, driving advancements in the field.
Visual Insights#

🔼 This figure illustrates the four main steps of the proposed CONSTAT method for detecting contamination in large language models. It starts with defining the problem by selecting target models (M1 and M2) and their performance on a benchmark (D). Step 2 involves selecting reference models (Mref,1, Mref,2, Mref,3) and a reference benchmark (Dref). The reference benchmark can be a rephrased, synthetic, or similar benchmark to the original benchmark D. Step 3 shows the computation of CONSTAT, comparing the performance of the target models on the original benchmark and the reference benchmark, considering the difficulty of the benchmarks using the reference model performances to predict the expected performance and calculate a difference (δ). Step 4 is the result extraction of CONSTAT which displays the contamination magnitude (δ) with its p-value, indicating the statistical significance of the contamination level. A high δ value with a low p-value signifies strong contamination, indicating a significant performance difference between the original and reference benchmarks. The emojis illustrate the idea of whether a model is contaminated or not (evil vs happy face).
read the caption
Figure 1: Overview of our method. We first select models to check for contamination, then select reference models and benchmarks, and finally compute CONSTAT to detect and quantify contamination.

🔼 This table compares the performance of CONSTAT against several baseline methods in detecting syntax- and sample-specific contamination. The results show that CONSTAT significantly outperforms all other methods without requiring prior knowledge of uncontaminated samples. The asterisk (*) indicates methods that need access to uncontaminated samples for hyperparameter selection, highlighting the practical advantage of CONSTAT.
read the caption
Table 1: Percentage of syntax- and sample-specific contaminated models detected by several methods.
In-depth insights#
Contamination Crisis#
A hypothetical “Contamination Crisis” in large language models (LLMs) would center on the unreliability of benchmark results due to pervasive data contamination. This contamination, where training data includes benchmark sets or semantically similar information, leads to artificially inflated performance scores. The crisis arises because such inflated scores hinder meaningful model comparisons and impede progress by obscuring genuine advancements. Identifying and quantifying this contamination is crucial, requiring sophisticated statistical methods beyond traditional detection techniques. Addressing the contamination crisis requires new benchmark design principles, emphasizing generalization and robustness to subtle variations in wording or task phrasing. Furthermore, the crisis highlights the need for greater transparency and data provenance in LLM training. Without these measures, evaluating the true capabilities of LLMs and ensuring their responsible development remains significantly challenged.
ConStat’s Design#
ConStat’s design is centered around a novel definition of contamination in LLMs, focusing on performance degradation rather than data leakage in the training data. This shift allows ConStat to identify models exhibiting artificially inflated, non-generalizing benchmark scores. The method cleverly compares a model’s performance on a primary benchmark against a carefully selected reference benchmark (rephrased, synthetic, or similar task benchmark) and a set of reference models, employing a statistical test to quantify the contamination magnitude. This approach shows robustness against evasion techniques that exploit traditional definitions of contamination. Statistical significance is estimated using bootstrapping, enhancing reliability and addressing potential sources of error. The design is scalable, efficient, and flexible enough to incorporate diverse model architectures and contamination scenarios. The use of reference models and a principled statistical test represents the core innovation, creating a powerful tool for evaluating the reliability of LLM performance claims.
Contamination Types#
The concept of “Contamination Types” in the context of large language models (LLMs) is crucial for understanding the nuances of performance evaluation. The paper likely explores different ways data contamination can manifest, impacting benchmark results. Syntax-specific contamination, where the model memorizes specific phrasing, is a significant concern as it doesn’t generalize. Sample-specific contamination focuses on the model’s inability to generalize to new examples from the same distribution, highlighting a lack of robust learning. Finally, benchmark-specific contamination reveals the model’s limited generalizability beyond the specific benchmark used for training or evaluation. This categorization highlights the varying degrees of contamination and suggests a need for multifaceted detection methods, as a model might exhibit one type of contamination without exhibiting others. The identification and classification of contamination types is, therefore, vital for developing reliable model evaluation and mitigation strategies. The severity and impact of each contamination type should be carefully assessed, as this will influence the choice of detection method and the overall trustworthiness of benchmark results.
Reputable Models?#
The notion of “Reputable Models?” prompts a critical examination of the trustworthiness and reliability of large language models (LLMs) used as benchmarks. The paper’s investigation highlights the surprising prevalence of contamination even in models from established and respected sources. This challenges the assumption that models from reputable institutions are inherently cleaner and more reliable. The study emphasizes the need for rigorous methods, like CONSTAT, to identify and quantify contamination, irrespective of the model’s origin. This underscores the importance of moving beyond traditional notions of contamination, which focus solely on training data inclusion, and instead considering performance generalization as a more reliable indicator. The absence of guaranteed clean benchmark models poses a significant limitation, potentially leading to relative contamination assessments. Ultimately, the section on “Reputable Models?” calls for a shift in perspective, urging a more robust and holistic evaluation of LLMs to ensure valid comparisons and reliable assessment of performance.
Future Directions#
Future research could explore extending ConStat’s capabilities to evaluate contamination across a wider range of tasks and model architectures, moving beyond the current set of benchmarks and model families. Investigating the impact of different data augmentation techniques on ConStat’s performance, particularly in reducing false positives and improving accuracy, warrants further study. It would also be valuable to develop methods for automatically identifying appropriate reference benchmarks for a given target benchmark, to enhance the usability and scalability of ConStat. Finally, exploring novel statistical methods for quantifying contamination that are more robust to evasion techniques and provide more granular insights into the nature of contamination is a crucial next step. Collaboration with model developers to integrate ConStat into model evaluation pipelines would significantly improve the reliability of LLM benchmarks.
More visual insights#
More on figures

🔼 This figure shows the results of evaluating CONSTAT’s ability to estimate the sample-specific contamination effect. It compares CONSTAT’s estimate of the contamination effect (δ) against the ground truth measurement obtained from uncontaminated samples. The plot shows a strong positive correlation (R²=0.94) between the estimated and actual contamination effects, indicating that CONSTAT accurately estimates the magnitude of sample-specific contamination.
read the caption
Figure 2: Estimated 8 as a function of the true 8 for the finetuned models. 2-sigma intervals are shown.

🔼 This figure shows the cumulative distribution function (CDF) of p-values obtained from various statistical tests applied to uncontaminated models under different conditions. The tests include CONSTAT (and several ablation variants of CONSTAT) as well as MEAN-TEST and NORMALIZED-TEST. Each scenario represents a different challenge: (a) a simple scenario for comparison where the test should return a CDF close to the identity line, (b) benchmarks with different distributions, (c) a non-linear relationship between original and reference benchmark performance, (d) noisy reference models and a linear relationship between the benchmarks, (e) noisy reference models and a non-linear relationship between benchmarks, and (f) a small number of reference models and a non-linear relationship. The figure demonstrates the robustness of CONSTAT compared to other tests in handling these different conditions. A well-performing test should closely follow the identity line (dashed black line).
read the caption
Figure 3: CDF of various statistical tests for uncontaminated models in different scenarios.

🔼 This figure shows the cumulative distribution function (CDF) of p-values obtained from various statistical tests for uncontaminated models under different simulation scenarios. The scenarios test the robustness of the tests to various factors such as differing difficulty of benchmarks, non-linear relationships between benchmarks, noise in reference models, the impact of bootstrapping on reference models, and the effect of including a random model in the reference set. The ‘Identity’ line represents a perfect test; a test should ideally match this line for an uncontaminated model. Deviations from this line illustrate the shortcomings of each statistical test under the given scenario. CONSTAT demonstrates its robustness by closely tracking the identity line across all scenarios.
read the caption
Figure 3: CDF of various statistical tests for uncontaminated models in different scenarios.
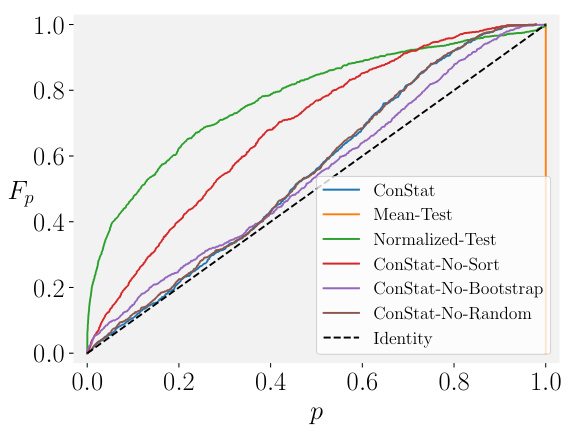
🔼 This figure shows the cumulative distribution functions (CDFs) of the p-values returned by various statistical tests for uncontaminated models under different scenarios. The scenarios manipulate factors like the difference in difficulty between benchmarks, non-linearity in the relationship between benchmark performances, noise in reference model evaluations, the use of model bootstrapping and the inclusion of a random model in the reference model set. The identity line represents a perfect test that would always accurately reflect the null hypothesis. Deviations from this line indicate a higher likelihood of false positives (above the line) or false negatives (below the line). The figure demonstrates that CONSTAT is consistently more robust to these varying conditions than other methods, producing p-value distributions that closely match the ideal identity line.
read the caption
Figure 3: CDF of various statistical tests for uncontaminated models in different scenarios.
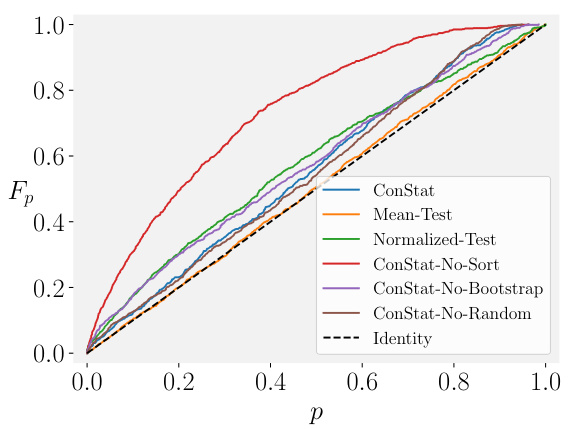
🔼 This figure presents the cumulative distribution function (CDF) of p-values obtained from several statistical tests for contamination detection on uncontaminated models under various simulation scenarios. Each test’s performance is shown as a curve on the graph, with the identity line (dashed black line) representing perfect accuracy. Deviations from the identity line indicate false positive rates. The scenarios considered include: simple cases, cases with differing benchmark difficulties, cases with non-linear relationships between benchmark performances, cases with noisy reference models, cases without bootstrapping or random models. The figure illustrates how CONSTAT outperforms alternative tests by being robust to various scenarios.
read the caption
Figure 3: CDF of various statistical tests for uncontaminated models in different scenarios.
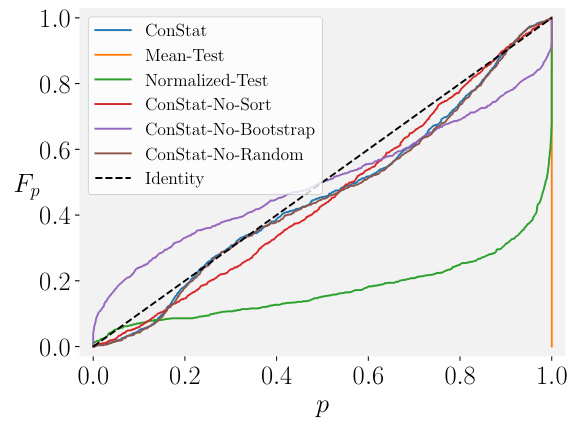
🔼 This figure compares the performance of CONSTAT against several other statistical tests in various scenarios using simulations. The x-axis represents the p-value, and the y-axis represents the cumulative distribution function (CDF) of the p-values. The scenarios include cases with different distributions, non-linear relationships between benchmarks, noisy reference models, and the impact of specific design choices in CONSTAT. The results demonstrate CONSTAT’s robustness and reliability compared to other methods.
read the caption
Figure 3: CDF of various statistical tests for uncontaminated models in different scenarios.
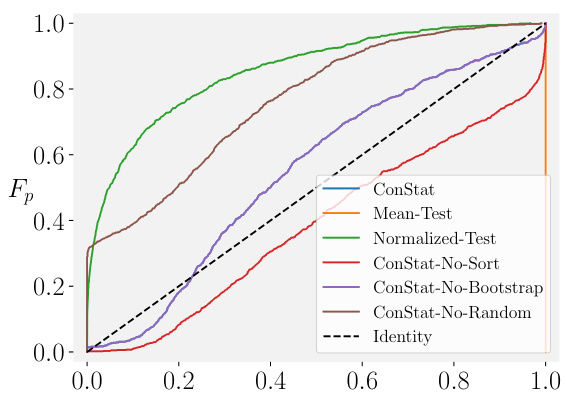
🔼 This figure shows the cumulative distribution functions (CDFs) of p-values obtained from various statistical tests for uncontaminated models under different scenarios. The scenarios simulate various conditions to evaluate the robustness and accuracy of these tests in detecting contamination. Each line represents a different statistical test (ConStat, Mean-Test, Normalized-Test, variants of ConStat), with the identity line representing a perfect test (uncontaminated model always gives p-value above 0.5). The tests are compared based on how closely their CDFs match the identity line, indicating the accuracy and reliability of each test in identifying uncontaminated models. Deviations from the identity line indicate issues like false positives (CDF above identity line) and false negatives (CDF below identity line).
read the caption
Figure 3: CDF of various statistical tests for uncontaminated models in different scenarios.
More on tables

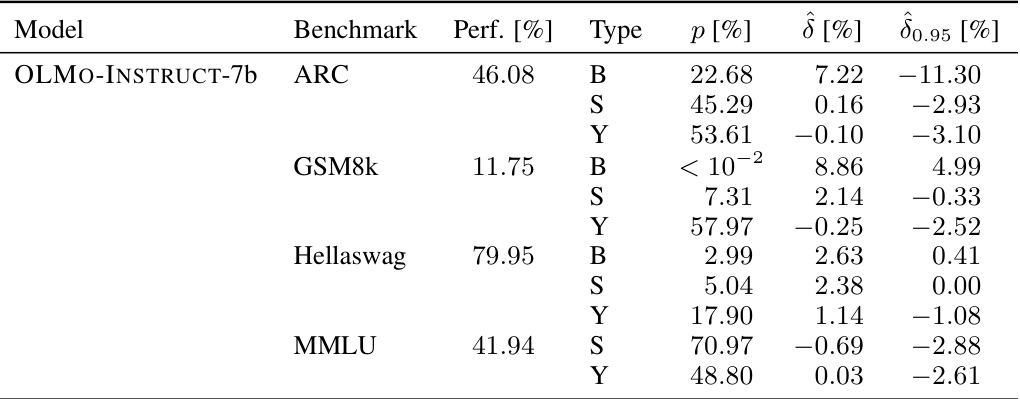
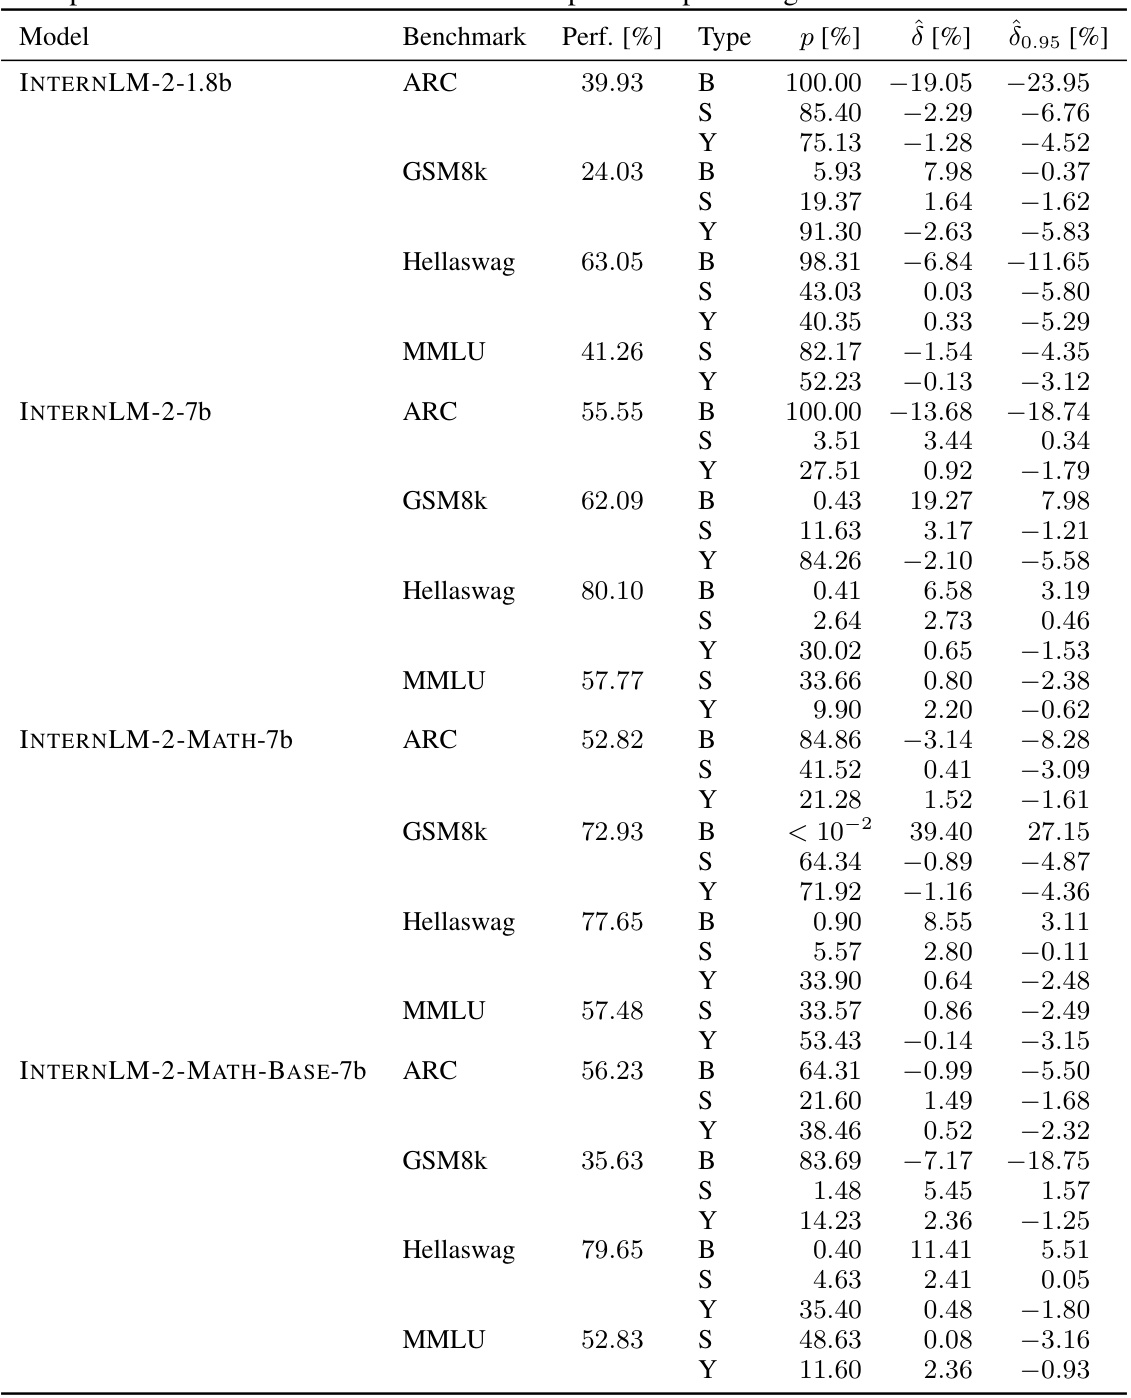
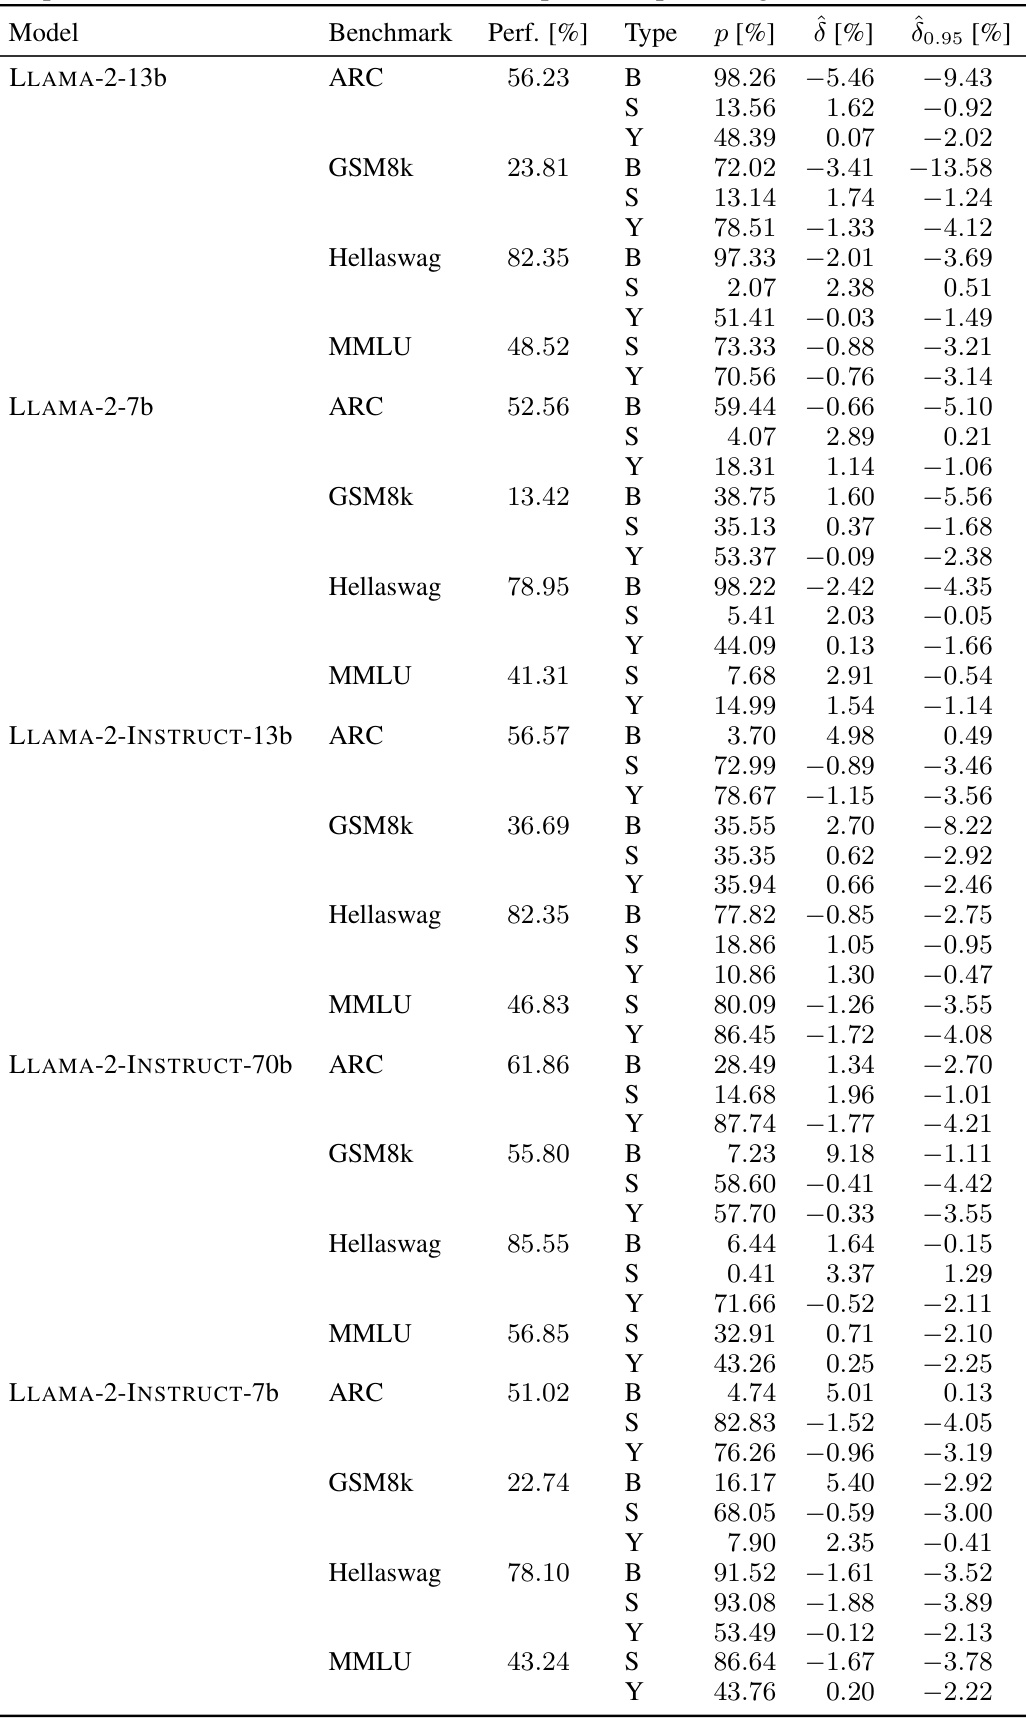
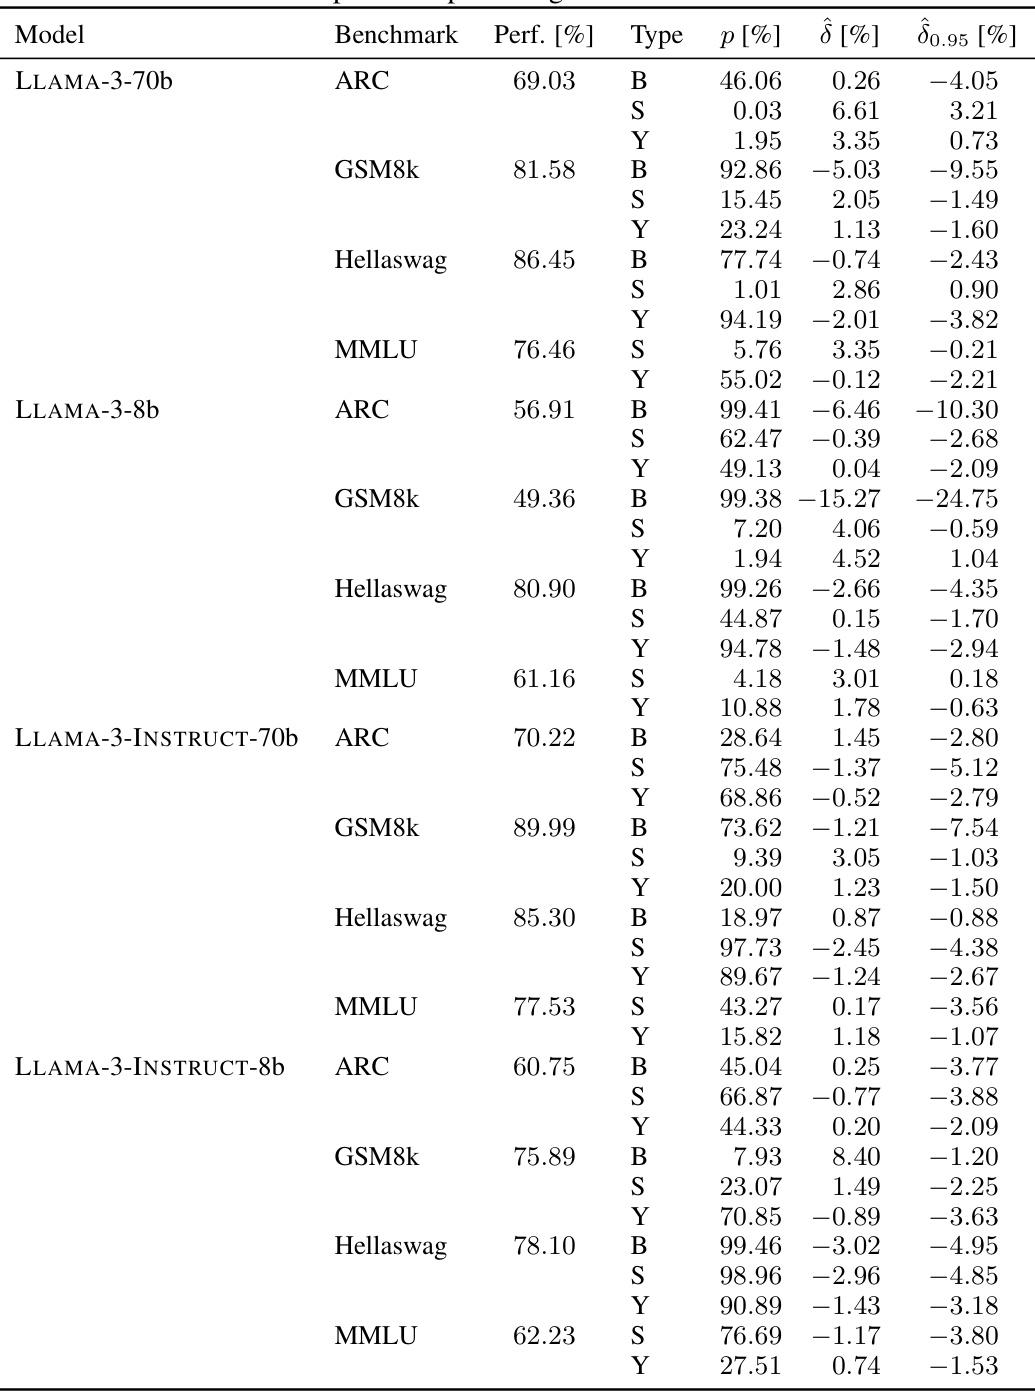
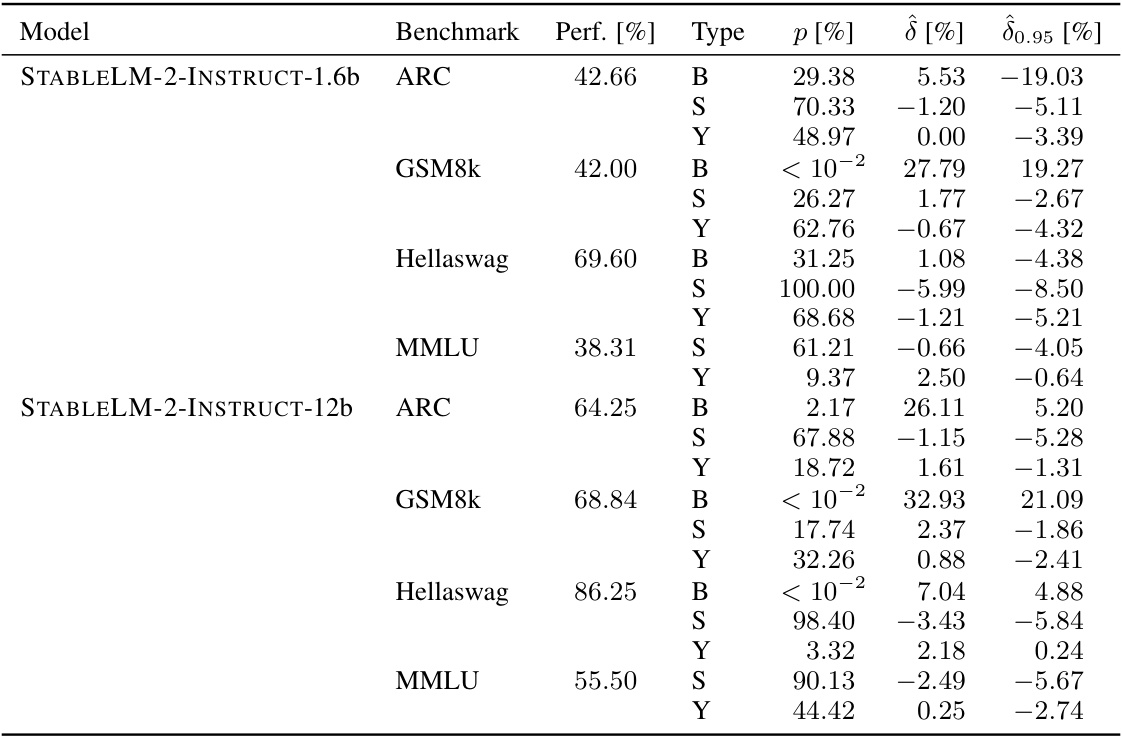
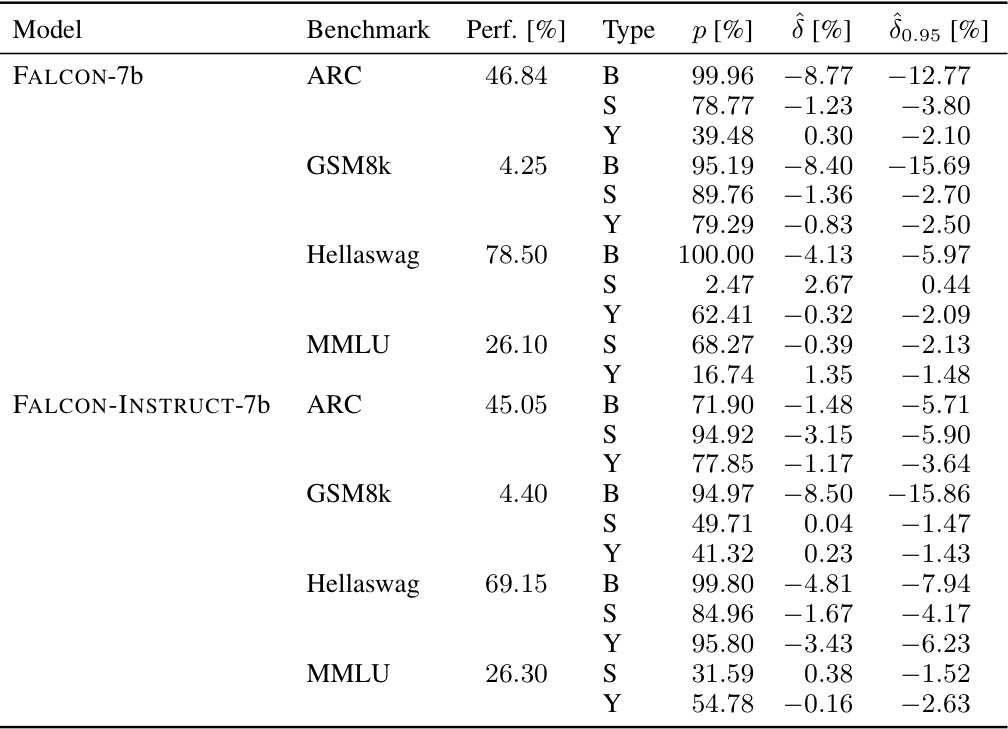
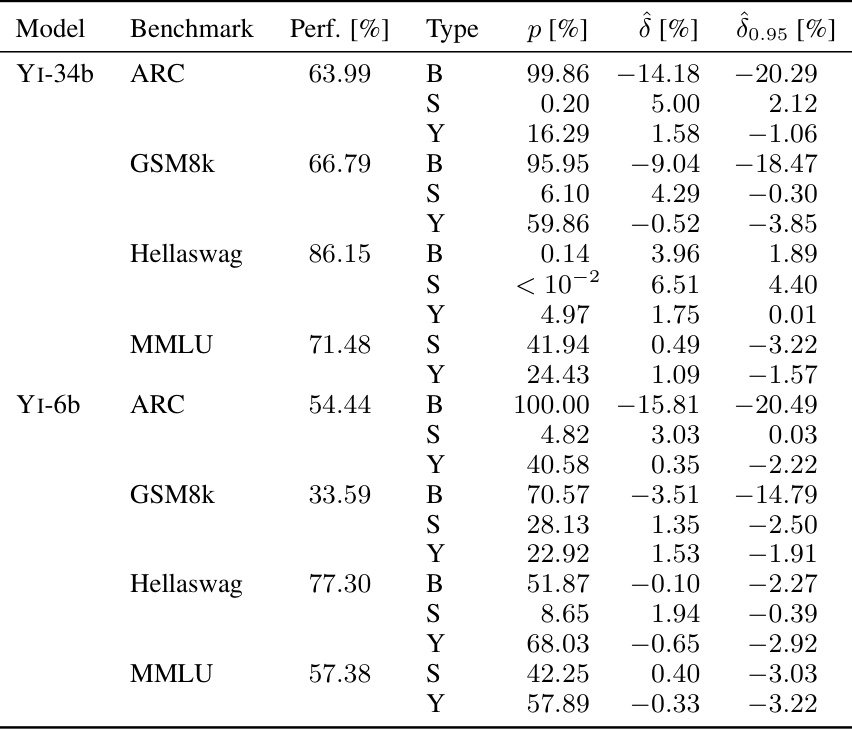
🔼 This table presents the contamination results for 20 different language models. The contamination is analyzed in three aspects: syntax-specific, sample-specific, and benchmark-specific. For each model and contamination type, the table shows the model’s performance on the benchmark, the estimated contamination effect (δ), a 95% lower bound for the effect (δ0.95), and the statistical significance (p-value). Only results with a corrected p-value below 5% are shown.
read the caption
Table 2: Contamination results for the reference models on syntax-specific, sample-specific, and benchmark-specific contamination. We only report tests for which the multiple testing corrected p-value is lower than 5% and include the non-corrected p-value, the estimated effect δ, the 95% lower bound of the effect δ0.95 and the model performance on the benchmark. S stands for sample-specific and B for benchmark-specific contamination. All numbers are reported in percentages.

🔼 This table shows the results of the sample-specific contamination test for three popular large language models: MISTRAL-7b-v0.1, LLAMA-2-INSTRUCT-70b, and LLAMA-3-70b. For each model, it provides the benchmark performance (Perf.), the p-value indicating the statistical significance of the contamination (p), the estimated contamination magnitude (δ), and a 95% lower bound of the estimated contamination (δ0.95). All values are expressed as percentages. This gives a comprehensive view of the contamination levels for each model across four different benchmarks.
read the caption
Table 3: Full overview of sample-specific contamination in MISTRAL-7b-v0.1, LLAMA-2-INSTRUCT-70b and LLAMA-3-70b. All numbers are reported in percentages.

🔼 This table presents the results of the sample-specific contamination analysis for three popular large language models: MISTRAL-7b-v0.1, LLAMA-2-INSTRUCT-70b, and LLAMA-3-70b. For each model, the table shows the performance on four different benchmarks (ARC, GSM8k, Hellaswag, and MMLU), the p-value indicating statistical significance, the estimated contamination effect (δ), and a 95% lower bound of the effect (δ0.95). All values are expressed as percentages, providing a quantitative assessment of the level of sample-specific contamination present in each model on each benchmark.
read the caption
Table 3: Full overview of sample-specific contamination in MISTRAL-7b-v0.1, LLAMA-2-INSTRUCT-70b and LLAMA-3-70b. All numbers are reported in percentages.

🔼 This table presents a detailed breakdown of the results from an experiment involving models finetuned on the GSM8k benchmark. It shows the performance (percentage) of each model under various contamination scenarios, along with the estimated contamination effect (δ), and p-values indicating statistical significance for both syntax-specific and sample-specific contamination. The ‘Default’ row indicates the baseline performance, while other rows represent various modifications to the training process, simulating real-world contamination.
read the caption
Table 5: Complete results for the contaminated models finetuned on GSM8k. LLAMA-2 is the LLAMA-2-INSTRUCT-7b model. δ is the actual effect measured on the uncontaminated samples. The other values are the estimates, p-values and effects for syntax- and sample-specific contamination. All numbers in the table are reported in percentages.

🔼 This table presents the contamination analysis results for 20 different language models used as references in the study. The analysis focuses on three types of contamination: syntax-specific, sample-specific, and benchmark-specific. Only statistically significant results (corrected p-value < 5%) are included. For each model and benchmark, the table shows the model’s performance, the type of contamination, the p-value, the estimated contamination effect (δ), and the 95% lower bound of the effect (δ0.95).
read the caption
Table 2: Contamination results for the reference models on syntax-specific, sample-specific, and benchmark-specific contamination. We only report tests for which the multiple testing corrected p-value is lower than 5% and include the non-corrected p-value, the estimated effect δ, the 95% lower bound of the effect δ0.95 and the model performance on the benchmark. S stands for sample-specific and B for benchmark-specific contamination. All numbers are reported in percentages.

🔼 This table presents the results of contamination detection on a set of reference models. It shows, for each model and benchmark, whether syntax-specific, sample-specific, or benchmark-specific contamination was detected. The table includes the model’s performance on the benchmark, the estimated contamination effect (δ), a 95% lower bound of the contamination effect (δ0.95), and the p-value indicating statistical significance. Only tests with a corrected p-value below 5% are shown.
read the caption
Table 2: Contamination results for the reference models on syntax-specific, sample-specific, and benchmark-specific contamination. We only report tests for which the multiple testing corrected p-value is lower than 5% and include the non-corrected p-value, the estimated effect δ, the 95% lower bound of the effect δ0.95 and the model performance on the benchmark. S stands for sample-specific and B for benchmark-specific contamination. All numbers are reported in percentages.

🔼 This table presents the results of the sample-specific contamination analysis for three popular large language models: MISTRAL-7b-v0.1, LLAMA-2-INSTRUCT-70b, and LLAMA-3-70b. For each model, it shows the performance on four benchmarks (ARC, GSM8k, Hellaswag, and MMLU), the p-value indicating the statistical significance of the contamination, the estimated contamination effect (δ), and a 95% lower bound of the effect (δ0.95). All values are expressed as percentages. This allows for a comparison of the degree of contamination across different models and benchmarks.
read the caption
Table 3: Full overview of sample-specific contamination in MISTRAL-7b-v0.1, LLAMA-2-INSTRUCT-70b and LLAMA-3-70b. All numbers are reported in percentages.

🔼 This table presents the results of the sample-specific contamination analysis for three prominent large language models: MISTRAL-7b-v0.1, LLAMA-2-INSTRUCT-70b, and LLAMA-3-70b. For each model, it shows the performance on various benchmarks (ARC, GSM8k, Hellaswag, MMLU), the p-value indicating the significance of the contamination, the estimated contamination effect (δ), and the 95% lower bound of the effect (δ0.95). The values are expressed as percentages, enabling a comparison of the degree of contamination across different models and benchmarks.
read the caption
Table 3: Full overview of sample-specific contamination in MISTRAL-7b-v0.1, LLAMA-2-INSTRUCT-70b and LLAMA-3-70b. All numbers are reported in percentages.

🔼 This table shows the results of the sample-specific contamination test for three popular large language models: MISTRAL-7b-v0.1, LLAMA-2-INSTRUCT-70b, and LLAMA-3-70b, across four different benchmarks. For each model and benchmark, it indicates the model’s performance, the p-value (indicating the statistical significance of contamination), the estimated contamination effect (δ), and a 95% lower bound of the contamination effect (δ0.95). All values are reported as percentages.
read the caption
Table 3: Full overview of sample-specific contamination in MISTRAL-7b-v0.1, LLAMA-2-INSTRUCT-70b and LLAMA-3-70b. All numbers are reported in percentages.
🔼 This table presents the results of the sample-specific contamination analysis for three popular large language models: MISTRAL-7b-v0.1, LLAMA-2-INSTRUCT-70b, and LLAMA-3-70b. It shows the model’s performance on various benchmarks (ARC, GSM8k, Hellaswag, and MMLU), the p-value indicating the statistical significance of contamination, the estimated contamination effect (δ), and the 95% lower bound of the effect (δ0.95). All values are expressed as percentages, offering a comprehensive view of the extent and statistical significance of sample-specific contamination in these models.
read the caption
Table 3: Full overview of sample-specific contamination in MISTRAL-7b-v0.1, LLAMA-2-INSTRUCT-70b and LLAMA-3-70b. All numbers are reported in percentages.

🔼 This table presents the results of the sample-specific contamination analysis for three popular large language models: MISTRAL-7b-v0.1, LLAMA-2-INSTRUCT-70b, and LLAMA-3-70b. For each model, it shows the performance on four benchmarks (ARC, GSM8k, Hellaswag, MMLU), the p-value indicating the statistical significance of the contamination, the estimated contamination effect (δ), and the 95% lower bound of the contamination effect (δ0.95). All values are expressed as percentages.
read the caption
Table 3: Full overview of sample-specific contamination in MISTRAL-7b-v0.1, LLAMA-2-INSTRUCT-70b and LLAMA-3-70b. All numbers are reported in percentages.
🔼 This table presents a detailed breakdown of the results from the GSM8k benchmark for various models with different contamination scenarios. It shows the model’s performance, the actual contamination effect (δ) calculated using uncontaminated data, estimated effects (δ) and p-values for both syntax-specific and sample-specific contamination. Each row represents a different model and configuration (e.g., default settings, rephrased data, different learning rates, etc.). The purpose is to illustrate the effectiveness of CONSTAT in detecting and quantifying contamination in various scenarios.
read the caption
Table 5: Complete results for the contaminated models finetuned on GSM8k. LLAMA-2 is the LLAMA-2-INSTRUCT-7b model. δ is the actual effect measured on the uncontaminated samples. The other values are the estimates, p-values and effects for syntax- and sample-specific contamination. All numbers in the table are reported in percentages.
🔼 This table shows the results of the sample-specific contamination test for three large language models across four benchmarks. Each row represents a model and benchmark pairing, indicating the model’s performance, the p-value indicating the statistical significance of contamination, the estimated contamination effect (δ), and a 95% lower bound on the effect (δ0.95). All values are expressed as percentages. The results indicate whether each model exhibits significant sample-specific contamination in each of the benchmarks.
read the caption
Table 3: Full overview of sample-specific contamination in MISTRAL-7b-v0.1, LLAMA-2-INSTRUCT-70b and LLAMA-3-70b. All numbers are reported in percentages.
🔼 This table presents the results of the sample-specific contamination analysis for three popular large language models: MISTRAL-7b-v0.1, LLAMA-2-INSTRUCT-70b, and LLAMA-3-70b. For each model and benchmark (ARC, GSM8k, Hellaswag, MMLU), the table shows the model’s performance, the estimated contamination effect (δ), the 95% lower bound of the effect (δ0.95), and the p-value. The p-value indicates the statistical significance of the contamination.
read the caption
Table 3: Full overview of sample-specific contamination in MISTRAL-7b-v0.1, LLAMA-2-INSTRUCT-70b and LLAMA-3-70b. All numbers are reported in percentages.
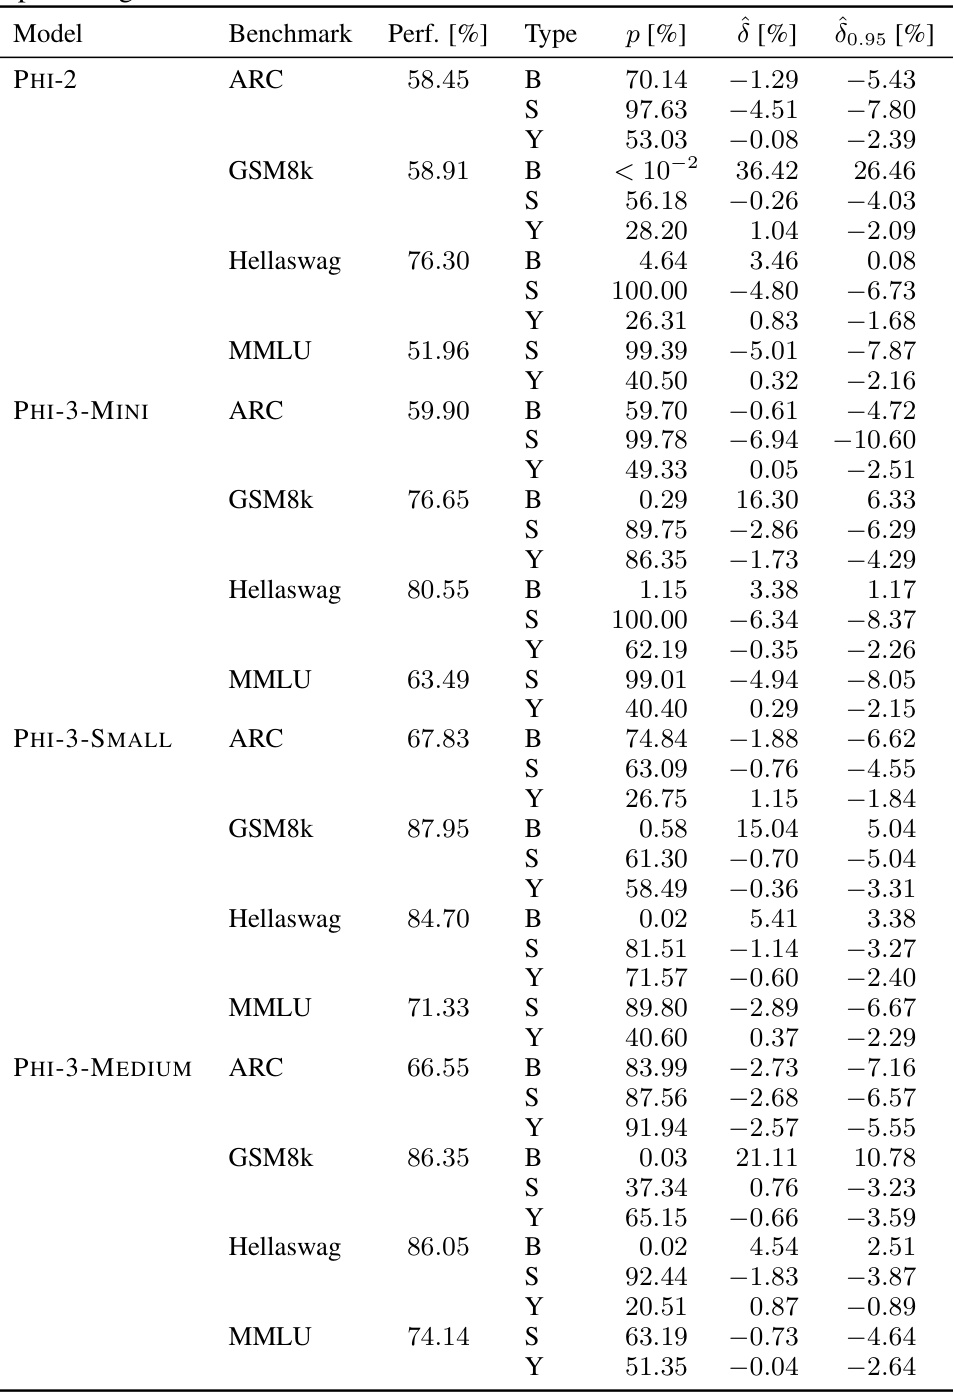
🔼 This table presents the contamination results for various reference models, focusing on three types of contamination: syntax-specific, sample-specific, and benchmark-specific. Only statistically significant results (p-value < 0.05 after multiple testing correction) are included. For each significant result, the table shows the model’s performance on the benchmark, the estimated contamination effect (δ), a 95% lower bound for δ, and the uncorrected p-value. The contamination type (S for sample-specific or B for benchmark-specific) is also indicated.
read the caption
Table 2: Contamination results for the reference models on syntax-specific, sample-specific, and benchmark-specific contamination. We only report tests for which the multiple testing corrected p-value is lower than 5% and include the non-corrected p-value, the estimated effect δ, the 95% lower bound of the effect δ0.95 and the model performance on the benchmark. S stands for sample-specific and B for benchmark-specific contamination. All numbers are reported in percentages.
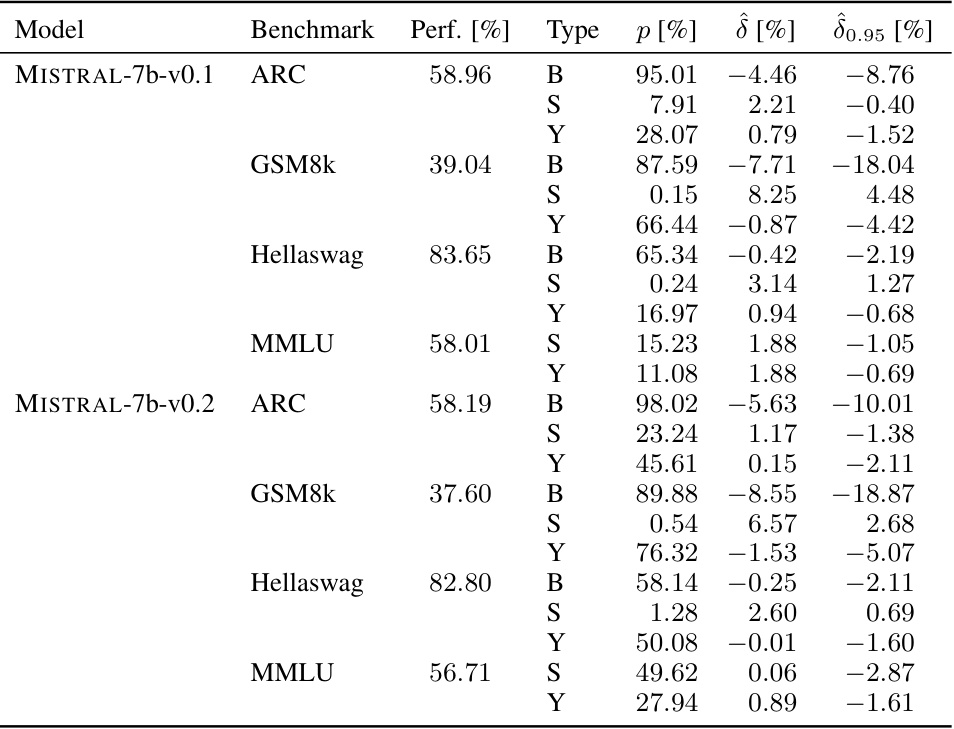
🔼 This table presents the results of sample-specific contamination analysis for three popular large language models: MISTRAL-7b-v0.1, LLAMA-2-INSTRUCT-70b, and LLAMA-3-70b. For each model, the table shows the benchmark used (ARC, GSM8k, Hellaswag, MMLU), the model’s performance on that benchmark, the p-value indicating the statistical significance of the contamination, the estimated contamination effect (δ), and a 95% lower bound of the effect (δ0.95). All values are expressed as percentages. This provides a comprehensive overview of the degree and significance of sample-specific contamination in these prominent models.
read the caption
Table 3: Full overview of sample-specific contamination in MISTRAL-7b-v0.1, LLAMA-2-INSTRUCT-70b and LLAMA-3-70b. All numbers are reported in percentages.

🔼 This table presents the results of sample-specific contamination analysis for three popular large language models: MISTRAL-7b-v0.1, LLAMA-2-INSTRUCT-70b, and LLAMA-3-70b. For each model, it shows the performance on four benchmarks (ARC, GSM8k, Hellaswag, MMLU), the p-value indicating the statistical significance of the contamination, the estimated contamination effect (δ), and a 95% lower bound of the effect (δ0.95). All values are expressed as percentages.
read the caption
Table 3: Full overview of sample-specific contamination in MISTRAL-7b-v0.1, LLAMA-2-INSTRUCT-70b and LLAMA-3-70b. All numbers are reported in percentages.
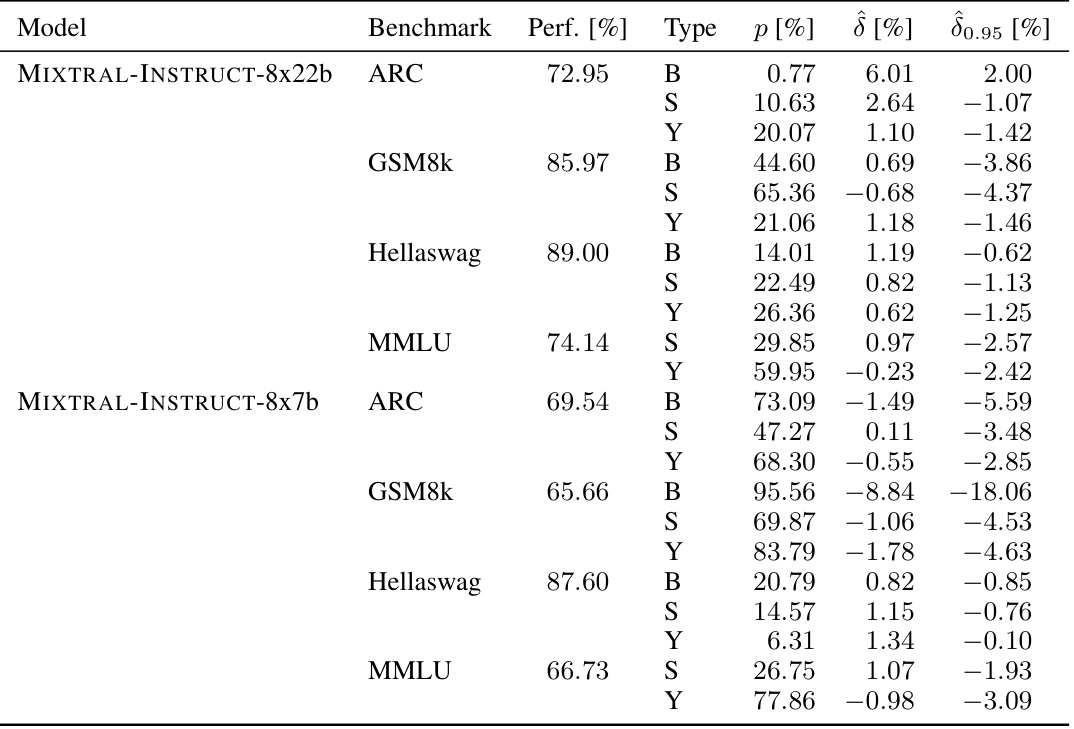
🔼 This table presents the results of the sample-specific contamination analysis for three popular large language models: MISTRAL-7b-v0.1, LLAMA-2-INSTRUCT-70b, and LLAMA-3-70b. It shows the performance of each model on four different benchmarks (ARC, GSM8k, Hellaswag, MMLU), along with the estimated contamination effect (δ) and its 95% lower bound (δ0.95). All values are expressed as percentages. The p-value indicates the statistical significance of the contamination.
read the caption
Table 3: Full overview of sample-specific contamination in MISTRAL-7b-v0.1, LLAMA-2-INSTRUCT-70b and LLAMA-3-70b. All numbers are reported in percentages.
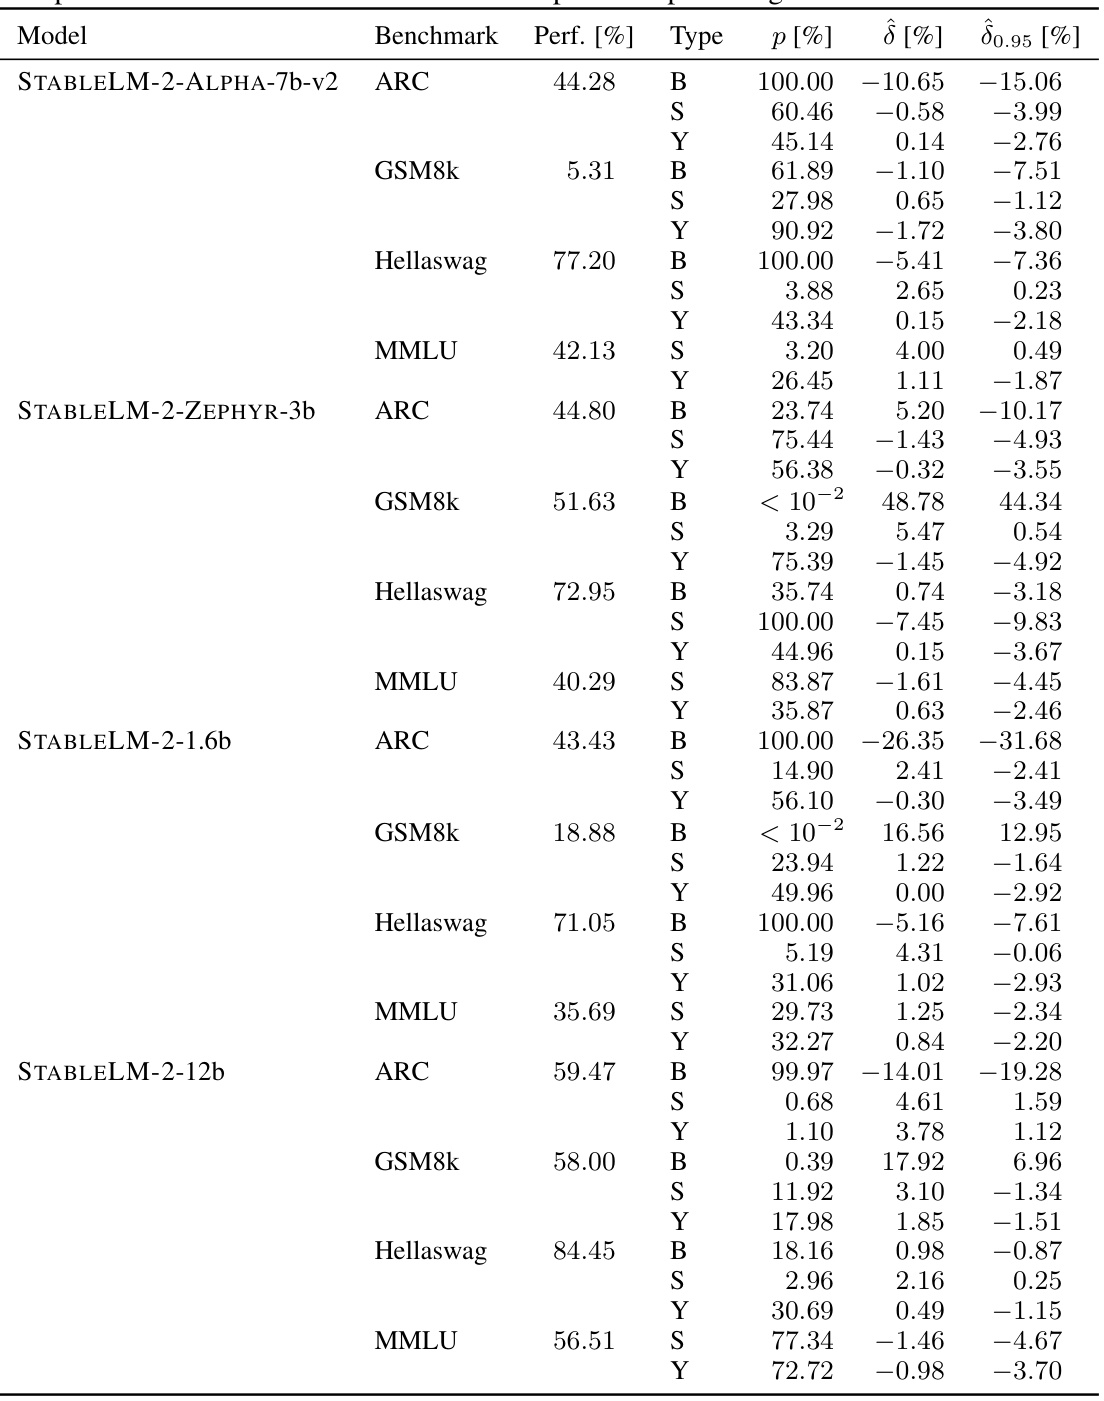
🔼 This table presents the results of the sample-specific contamination analysis for three large language models: MISTRAL-7b-v0.1, LLAMA-2-INSTRUCT-70b, and LLAMA-3-70b, across four different benchmarks. For each model and benchmark, the table shows the model’s performance, the p-value indicating the statistical significance of the contamination, the estimated contamination effect (δ), and the 95% lower bound of the contamination effect. All values are expressed as percentages.
read the caption
Table 3: Full overview of sample-specific contamination in MISTRAL-7b-v0.1, LLAMA-2-INSTRUCT-70b and LLAMA-3-70b. All numbers are reported in percentages.
🔼 This table presents a detailed breakdown of the results from experiments involving models fine-tuned on the GSM8k benchmark with varying levels of contamination. It shows the performance, contamination effects (δ), and p-values for syntax and sample-specific contamination, enabling a comparison of different contamination scenarios.
read the caption
Table 5: Complete results for the contaminated models finetuned on GSM8k. LLAMA-2 is the LLAMA-2-INSTRUCT-7b model. δ is the actual effect measured on the uncontaminated samples. The other values are the estimates p-values and effects for syntax- and sample-specific contamination. All numbers in the table are reported in percentages.
🔼 This table presents the results of the sample-specific contamination analysis for three popular large language models: MISTRAL-7b-v0.1, LLAMA-2-INSTRUCT-70b, and LLAMA-3-70b. It shows the model’s performance on four benchmarks (ARC, GSM8k, Hellaswag, MMLU), the estimated contamination effect (δ), the lower bound of the effect at a 95% confidence level (δ0.95), and the p-value indicating the statistical significance of the contamination. All values are expressed as percentages.
read the caption
Table 3: Full overview of sample-specific contamination in MISTRAL-7b-v0.1, LLAMA-2-INSTRUCT-70b and LLAMA-3-70b. All numbers are reported in percentages.
🔼 This table presents the results of the sample-specific contamination analysis for three popular large language models: MISTRAL-7b-v0.1, LLAMA-2-INSTRUCT-70b, and LLAMA-3-70b. For each model, it shows the performance on four different benchmarks (ARC, GSM8k, Hellaswag, MMLU), the p-value indicating statistical significance of the contamination, the estimated contamination effect (δ), and a 95% lower bound of this effect. All values are expressed as percentages.
read the caption
Table 3: Full overview of sample-specific contamination in MISTRAL-7b-v0.1, LLAMA-2-INSTRUCT-70b and LLAMA-3-70b. All numbers are reported in percentages.
Full paper#


