↗ OpenReview ↗ NeurIPS Homepage ↗ Chat
TL;DR#
Disaggregated evaluation, crucial for assessing AI system fairness, faces challenges from limited data and the need for evaluating performance across various sub-populations. Existing methods often struggle with accuracy, especially when dealing with small and overlapping groups. This is further complicated in multi-task settings, where multiple clients might need to conduct individual evaluations.
SureMap addresses these limitations by cleverly framing the problem as a structured simultaneous Gaussian mean estimation. It uses a well-chosen prior to combine data across tasks, incorporating external data for improved accuracy. The method also uses Stein’s unbiased risk estimate for tuning, eliminating the need for cross-validation, leading to significant efficiency gains. Evaluations across several domains demonstrate SureMap’s superior accuracy compared to existing baselines, particularly when data is scarce.
Key Takeaways#
Why does it matter?#
This paper is crucial for researchers working on fairness and AI system evaluation. It directly addresses the critical challenge of limited data in disaggregated evaluation by proposing a novel multi-task approach. This significantly improves accuracy and efficiency, especially important in intersectional fairness assessment where data is often scarce. The methodology offers new avenues for research, such as the integration of external data and the development of more flexible, efficient estimators. This has the potential to enhance AI systems fairness and reliability.
Visual Insights#

This figure compares the performance of SureMap against other methods for single-task disaggregated evaluation. The results are shown across three different datasets: Diabetes, Adult, and Common Voice. Each dataset is evaluated using different metrics (Mean Absolute Error (MAE)) and group sizes (all, large, and small). The x-axis represents the subsampling rate (related to the median group size), while the y-axis shows the MAE.
In-depth insights#
SureMap’s MAP Estimator#
SureMap employs a maximum a posteriori (MAP) estimator for efficient disaggregated evaluation. The core of SureMap’s approach is to model the disaggregated evaluation problem as a structured Gaussian mean estimation. This allows the incorporation of prior knowledge, particularly useful given the scarcity of data in specific subpopulations. The prior is designed to capture relationships between subpopulations defined by intersections of demographic attributes, leveraging a concise, yet expressive, additive structure with only a linear number of hyperparameters. This additive structure is crucial in balancing efficiency with expressiveness, avoiding the computational burden of high-dimensional covariance matrices. The hyperparameters of the prior are not arbitrarily chosen but rather optimized using Stein’s Unbiased Risk Estimate (SURE), a method for cross-validation-free parameter tuning that enhances the estimator’s accuracy. The SURE-optimized MAP estimator, therefore, effectively leverages limited data while incorporating multi-task information when available for improved accuracy and robustness.
SURE Hyperparameter Tuning#
The SURE (Stein’s Unbiased Risk Estimator) hyperparameter tuning method is a crucial part of the SureMap algorithm. It addresses the challenge of efficiently optimizing the many hyperparameters of the algorithm’s prior covariance structure, which is designed to capture relationships between subpopulations in disaggregated evaluation. Instead of relying on computationally expensive cross-validation, SURE directly estimates the expected risk, allowing for a more efficient tuning process. This is particularly important for disaggregated evaluation tasks, where data scarcity is often a major concern. The use of SURE is a key innovation, enabling SureMap to achieve high accuracy with limited data, even in the challenging multi-task setting where data from multiple clients is combined. The selection of SURE is motivated by its theoretical properties and its effectiveness in handling heteroskedastic data, making it well-suited for the diverse and often imbalanced datasets encountered in disaggregated evaluations. The optimization process itself, while non-convex, is effectively handled through the use of an L-BFGS-B algorithm. This efficient tuning of hyperparameters contributes significantly to SureMap’s superior performance over existing baselines in both single-task and multi-task settings.
Multi-task Disagg. Eval.#
The heading ‘Multi-task Disagg. Eval.’ suggests a research focus on improving the accuracy and efficiency of evaluating machine learning models’ performance across multiple tasks and diverse subpopulations. The “disaggregated” aspect highlights the importance of evaluating performance not just overall, but also broken down by relevant demographic or other subgroupings to ensure fairness and identify biases. The “multi-task” component indicates the study considers scenarios where the same model is used across various applications (tasks) by different clients, potentially each with their own unique datasets and subpopulations. This approach likely involves developing methods to leverage data across tasks while preserving the integrity of individual task evaluations. The key insight is the potential for significant efficiency gains and enhanced accuracy by sharing information between tasks while carefully accounting for the differences in data distributions and subpopulations between tasks. The work probably explores how to effectively combine data and transfer knowledge across these distinct settings while mitigating risks such as overfitting and the introduction of biases from one task to another. Statistical methods may play a crucial role in achieving this, incorporating techniques that can robustly estimate mean performance across varied datasets and subpopulations despite potentially limited data per task or subgroup. The results likely demonstrate substantial performance improvements over traditional single-task approaches. Finally, the research almost certainly addresses practical challenges, considering computational feasibility and data availability.
Gaussian Mean Modeling#
Gaussian mean modeling, in the context of disaggregated evaluation, offers a powerful framework for estimating performance metrics across multiple subpopulations. By modeling the observed group-level performance statistics as draws from a multivariate Gaussian distribution, this approach leverages the well-established statistical theory of Gaussian mean estimation. This is particularly advantageous when dealing with limited data per subpopulation, a common challenge in assessing fairness. The Gaussian assumption, while simplifying, allows for the incorporation of prior knowledge and information from related tasks or external sources, leading to improved estimation accuracy, especially when subpopulation sample sizes are small. Methods like James-Stein estimation and Empirical Bayes approaches can then be applied to shrink estimates towards a common mean, thereby reducing variance and improving overall accuracy. The choice of prior distribution is critical, influencing the balance between bias and variance, and methods for tuning the prior parameters are important considerations. The strength of this framework lies in its capacity to borrow strength across multiple tasks or subpopulations, thus effectively mitigating data sparsity and improving the reliability of disaggregated evaluation results.
Intersectionality in AI#
Intersectionality in AI examines how various social categories, such as race, gender, and socioeconomic status, intersect and overlap to create unique experiences of bias and discrimination. AI systems trained on biased data will often perpetuate and amplify these existing inequalities, impacting different groups disproportionately. For example, facial recognition systems might perform poorly on individuals with darker skin tones, while loan applications might unfairly disadvantage women or minority ethnic groups. Therefore, it’s crucial to move beyond analyzing single demographic attributes and consider the complex interactions between them. This requires developing evaluation methods that identify and mitigate bias across multiple social categories simultaneously and design AI systems that account for these intersections during development and deployment. Furthermore, interdisciplinary collaboration between AI researchers, social scientists, and ethicists is critical to understanding and addressing the multifaceted challenges of intersectionality in AI.
More visual insights#
More on figures

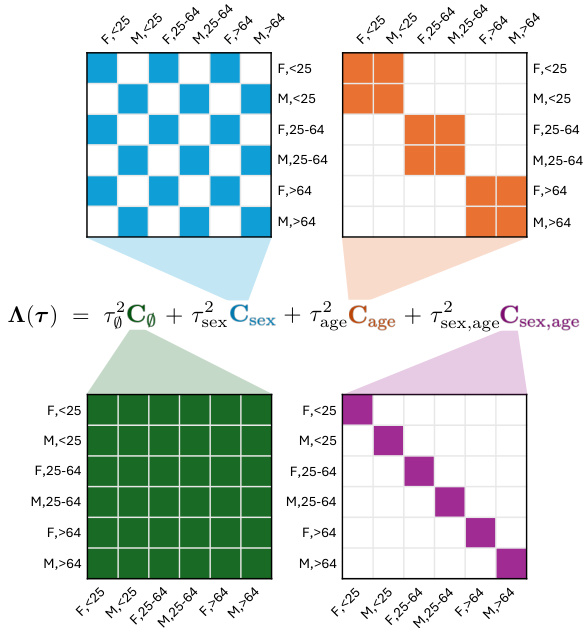
This figure shows the structure of the covariance matrix Λ(τ) used in the SureMap method. The matrix is built from a linear combination of several matrices, CA, each representing a different set of intersecting demographic attributes (in this case, sex and age). Each CA is a dxd matrix (where d is the number of groups defined by the intersection of attributes), with a 1 in the (i,j)th entry if groups i and j share the same values for the attributes in A, and 0 otherwise. The weights (hyperparameters) τ for this combination determine how strongly each attribute contributes to the overall covariance structure. The figure helps visualize how the additive prior combines effects of different attributes to model complex relationships between subgroups.

This figure presents the results of single-task evaluations on three different datasets: Diabetes, Adult, and Common Voice. Each dataset is disaggregated by multiple demographic attributes (race, sex, and age). The figure shows the mean absolute error (MAE) for different subsampling rates. The MAE is calculated across all groups, large groups (above the median group size), and small groups (below the median group size) separately to illustrate the performance of SureMap in different group sizes.

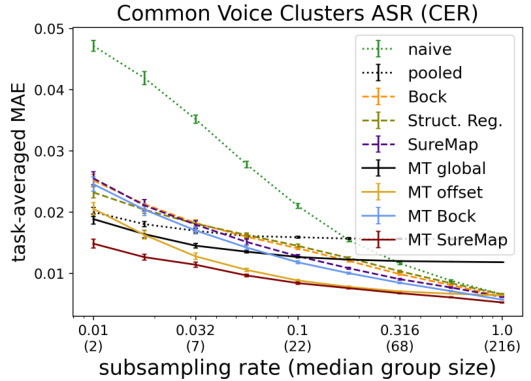
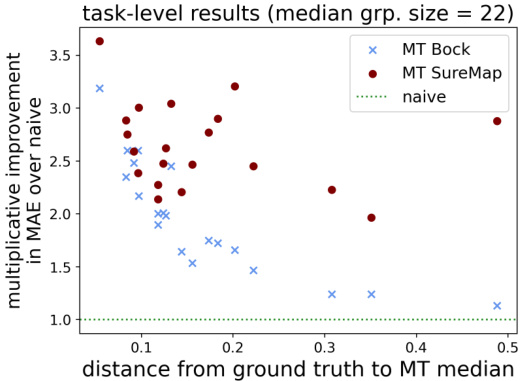
This figure presents the results of multi-task evaluations performed on two datasets: SLACS (State-Level ACS) and CVC (Common Voice Clusters). The left side shows the average performance (measured by Mean Absolute Error, MAE) across various subsampling rates which represents different median group sizes. The right side zooms in on the subsampling rate of 0.1, visualizing the multiplicative improvement of multi-task SureMap against the naive approach for each individual task. The x-axis of the right plots shows the distance between each individual task’s true performance and the median multi-task performance. These plots highlight how effective multi-task learning is in boosting performance, particularly when data is scarce.

This figure presents the results of multi-task evaluations using two different datasets: SLACS and CVC. The left panels show how the mean absolute error (MAE) changes across different subsampling rates. The right panels focus on a subsampling rate of 0.1 and illustrate the multiplicative improvement in MAE achieved by the proposed multi-task method compared to the naive method for each individual task.

This figure presents the results of multi-task evaluations performed on two datasets: SLACS and CVC. The left panels show the task-averaged mean absolute error (MAE) across different subsampling rates (which influence the median group size). The right panels illustrate the multiplicative improvement in MAE that the multi-task SureMap model achieves compared to the naive estimator for each task individually at a specific subsampling rate (0.1). This highlights the performance gain obtained by leveraging multi-task information.

This figure displays the performance of various disaggregated evaluation methods across different numbers of tasks for the SLACS (State-Level ACS) and CVC (Common Voice Clusters) datasets. The x-axis represents the number of tasks, and the y-axis shows the task-averaged MAE (Mean Absolute Error). The plot helps to understand how the performance of different methods, including the proposed SureMap and various baselines (naive, pooled, Bock, structured regression, MT global, MT offset, MT Bock), changes as more tasks are incorporated into the evaluation. It shows the comparative effectiveness of single-task and multi-task approaches under varying data conditions and is key in understanding the scalability and robustness of the SureMap method.

This figure compares the computational cost of different methods (naive, pooled, Bock, structured regression, SureMap, and multi-task SureMap) for disaggregated evaluation as a function of the number of tasks. It shows that SureMap and its multi-task variant are significantly more computationally expensive than the simpler baselines, but still substantially faster than structured regression. The cost of inference is typically far greater than model training, so the runtime differences shown here are less important in the overall cost of disaggregated evaluation.

This figure displays the performance of different methods for disaggregated evaluation on the Diabetes regression task using MAE. The results are broken down by group size (all, large, and small), showing how the methods perform across different scales and in scenarios with varying amounts of data. This helps to visualize the efficacy of each method under various conditions.

This figure presents single-task evaluation results on the Diabetes regression dataset. Three plots display MAE values for different group sizes (all, large, small) at various subsampling rates. The plots compare SureMap against several baselines (naive, pooled, Bock, structured regression), illustrating the impact of data scarcity on accuracy. The figure helps assess SureMap’s performance against others, specifically highlighting its effectiveness when dealing with limited data within specific subgroups.

This figure presents the results of single-task evaluations on the Diabetes dataset using AUC as the performance metric. The results are disaggregated by race, sex, and age. The figure shows the mean absolute error (MAE) across all groups, large groups (above median group size), and small groups (below median group size) for various subsampling rates. This allows for an analysis of the performance across different group sizes and data scarcity levels.

This figure shows the results of single-task evaluations on the Common Voice ASR dataset using CER (character error rate) as the metric. The dataset is disaggregated by sex and age. Three plots are presented, each showing the mean absolute error (MAE) for various group sizes (all groups, large groups, and small groups) at different subsampling rates. This visualization helps understand the performance of different methods in estimating errors for diverse group sizes and data availabilities.

This figure displays the results of multi-task evaluations on the State-Level ACS dataset. The left panel shows how the task-averaged mean absolute error (MAE) changes as the median group size varies (due to subsampling). The right panel shows the multiplicative improvement in MAE over the naive estimator for individual tasks when the median group size is 33, highlighting the benefit of the multi-task approach.

This figure presents the results of multi-task evaluations performed on two datasets: SLACS and CVC. The left panels show how the mean absolute error (MAE) changes across different subsampling rates for various methods. The right panels illustrate the multiplicative improvement in MAE achieved by the multi-task SureMap method compared to the naive method at a specific subsampling rate (0.1). This highlights the performance gains of the multi-task approach in various settings.

This figure presents the results of multi-task evaluations performed on two datasets: SLACS (State-Level ACS) and CVC (Common Voice Clusters). The left panels show how the performance (measured by Mean Absolute Error or MAE) changes across various subsampling rates. The right panels highlight the multiplicative improvement in MAE achieved by the multi-task SureMap method compared to the naive approach for each individual task at a subsampling rate of 0.1. This visualization helps to understand the effectiveness of the multi-task learning in improving the accuracy of disaggregated evaluation.

This figure shows single-task evaluations on three different datasets using RMSE as the performance metric. It compares the performance of SureMap against baselines for three different group sizes (all, large, and small). The x-axis represents the subsampling rate (median group size), and the y-axis represents RMSE.

This figure presents the results of multi-task evaluations on two datasets: SLACS and CVC. The left-hand plots show how the performance of different methods (including the proposed SureMap method) varies across different subsampling rates of the data. The right-hand plots illustrate the multiplicative improvement in Mean Absolute Error (MAE) that SureMap achieves compared to a simple ’naive’ baseline method at a subsampling rate of 0.1. These improvements are shown individually for each task (client) in the multi-task setting.
Full paper#


