↗ OpenReview ↗ NeurIPS Homepage ↗ Chat
TL;DR#
Machine learning models often struggle to provide both accurate point predictions and reliable uncertainty estimates (prediction intervals). Current conformal prediction methods offer valid prediction intervals but only marginally (across all contexts), not conditionally within specific contexts. This limits the usefulness in real-world applications where decisions are context-dependent. Furthermore, miscalibration in point predictions can affect the reliability and interpretability of prediction intervals.
This paper introduces Self-Calibrating Conformal Prediction (SC-CP), a novel method that addresses these issues. SC-CP combines Venn-Abers calibration for calibrated point predictions and conformal prediction to create prediction intervals with valid coverage conditional on the calibrated point predictions (prediction-conditional validity). Experiments demonstrate that SC-CP improves interval efficiency and offers a practical alternative to context-conditional validity.
Key Takeaways#
Why does it matter?#
This paper is crucial for researchers working on predictive inference and model calibration. It offers a novel approach that simultaneously improves both point prediction accuracy and the validity of prediction intervals, addressing a key challenge in machine learning. The theoretical framework and experimental results provide valuable insights for enhancing the reliability and interpretability of machine learning models, particularly in safety-critical domains. This work opens avenues for further research on improving the efficiency of conformal prediction and developing more robust methods for uncertainty quantification in various machine learning applications.
Visual Insights#

This figure shows an example of the Self-Calibrating Conformal Prediction (SC-CP) method’s output with a small calibration dataset (n=200). It illustrates the relationship between the original (uncalibrated) predictions, the calibrated predictions obtained using Venn-Abers calibration, the Venn-Abers multi-prediction (a set of calibrated predictions), and the resulting prediction interval. The plot visually demonstrates how SC-CP produces calibrated point predictions alongside prediction intervals that adapt to the model’s predictions, effectively quantifying uncertainty conditional on the calibrated point predictions.
In-depth insights#
Self-Calibration CP#
Self-Calibrating Conformal Prediction (SC-CP) presents a novel approach to enhance the reliability and efficiency of conformal prediction. By integrating Venn-Abers calibration, SC-CP addresses limitations of traditional methods by generating calibrated point predictions alongside prediction intervals. This dual calibration objective ensures prediction-conditional validity, which is more practical than the unattainable context-conditional validity. The method’s strength lies in its ability to adapt to model miscalibration, improving interval efficiency and interpretability. Finite sample validity is a key theoretical contribution, and empirical evidence supports improved performance. Although the reliance on oracle prediction intervals introduces some limitations, SC-CP represents a significant advancement in conformal prediction, offering a more robust and informative approach to predictive inference.
Venn-Abers Extension#
The Venn-Abers extension in this research paper is a significant contribution to the field of conformal prediction. It elegantly generalizes the original Venn-Abers calibration procedure, which was initially designed for binary classification, to address regression tasks. This extension is crucial because it allows the framework to handle a broader range of machine learning applications. The method’s strength lies in its ability to simultaneously provide both well-calibrated point predictions and prediction intervals with finite sample validity, conditional on those point predictions. This dual calibration objective is a significant advance, particularly for contexts where decisions are context-dependent, offering an improved approach over traditional methods that rely on marginal validity alone. The theoretical underpinnings of the extension are rigorous, demonstrating the method’s ability to provide self-calibrated predictions and associated prediction intervals that satisfy the desired coverage criteria. The method successfully addresses the challenge of maintaining efficiency while still ensuring prediction-conditional validity, overcoming limitations associated with conventional context-conditional approaches. Overall, this extension enhances both the practical applicability and theoretical soundness of conformal prediction, making it a more versatile tool for predictive inference in various fields.
Dual Calibration#
The concept of “Dual Calibration” in the context of a machine learning model suggests a simultaneous calibration of both point predictions and prediction intervals. This approach directly addresses the limitations of traditional methods which often treat point prediction and uncertainty quantification as separate processes. A dual calibration framework aims for improved prediction reliability and interpretability by ensuring that the point predictions accurately reflect the true outcomes (calibration), while also guaranteeing that the generated prediction intervals possess valid coverage probabilities, conditioned on the calibrated point predictions themselves. This conditional validity is crucial for decision-making in high-stakes applications, moving beyond the limitations of marginal validity. The paper likely explores the theoretical foundations and practical implications of this approach. This likely includes addressing challenges like the curse of dimensionality associated with conditional coverage and the computational efficiency of achieving dual calibration, while emphasizing the value of self-calibration—a simultaneous optimization of point prediction and interval accuracy—to improve reliability and interpretability.
Conditional Validity#
Conditional validity in predictive modeling focuses on ensuring prediction intervals accurately reflect uncertainty not just marginally across all data points, but also within specific contexts or subgroups. A prediction interval achieving 95% marginal coverage might exhibit poor performance in certain contexts. Context-conditional validity, the gold standard, aims to guarantee this 95% coverage within each context, but is generally unachievable without strong distributional assumptions. Prediction-conditional validity offers a more practical alternative, focusing on reliable coverage given the model’s predictions. This approach is valuable because it adapts interval width to the model’s output, improving efficiency and interpretability, especially when heteroscedasticity (unequal variance) is linked to predicted values. The curse of dimensionality makes achieving true context-conditional validity difficult for high-dimensional data, thus prediction-conditional validity emerges as a robust and useful approach.
Efficiency Gains#
The concept of “Efficiency Gains” in the context of a research paper likely refers to improvements in resource utilization or performance. In machine learning, this could manifest as reduced computational cost (faster training or inference), smaller model size, or improved prediction accuracy with the same or fewer resources. Analyzing efficiency gains requires a nuanced understanding of the specific context. For instance, an algorithm achieving higher accuracy with a larger model size may not represent a true efficiency gain if the increased accuracy doesn’t justify the added computational burden. Similarly, a faster algorithm might be less efficient if it sacrifices accuracy. Therefore, evaluating efficiency gains necessitates a holistic assessment weighing computational cost, model size, and accuracy improvements against the problem’s specific demands and resource constraints. Benchmarking against existing state-of-the-art methods is crucial to quantify the magnitude of any purported efficiency gains and establish their practical significance.
More visual insights#
More on figures

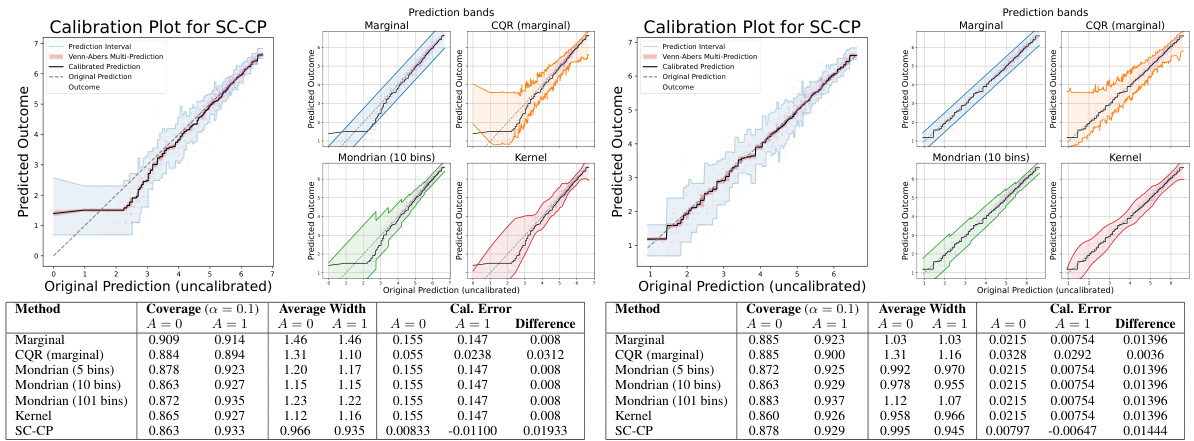
This figure shows the results of applying Self-Calibrating Conformal Prediction (SC-CP) and several baseline methods to the MEPS-21 dataset. The left plots are calibration plots for SC-CP in Setting A (poorly calibrated model) and Setting B (well-calibrated model), showing the relationship between original and calibrated predictions, as well as the prediction intervals. The right plots display prediction bands from SC-CP and baselines, illustrating the relationship between original predictions and interval widths. The table below summarizes the performance of different methods in terms of coverage, average width, and calibration error, showing SC-CP’s superior performance.

This figure presents the results of the MEPS-21 dataset experiment, comparing SC-CP with various baseline methods. The left side shows calibration plots for SC-CP in Settings A and B (poorly and well-calibrated models respectively). The right side shows prediction bands for SC-CP and baselines (Marginal CP, Mondrian CP, CQR, Kernel) and the tables below summarize the performance metrics including empirical coverage, average prediction interval width and calibration error within the sensitive attribute (race). This illustrates the performance of SC-CP in providing self-calibrated point predictions and associated prediction intervals.

This figure presents the results of experiments on the MEPS-21 dataset. The left plots show the calibration plot for Self-Calibrating Conformal Prediction (SC-CP), comparing the original predictions, calibrated predictions, Venn-Abers multi-predictions, and prediction intervals. The right plots display the prediction bands for SC-CP and several baseline methods (Marginal CP, CQR, Mondrian CP, and Kernel-smoothed CP). These plots are shown as functions of the original predictions and are separated into two settings based on the calibration of the initial model. The tables below summarize the empirical coverage, average width, and calibration error for each method, further broken down by sensitive subgroups (A=0 and A=1).

The figure presents a comparison of the proposed Self-Calibrating Conformal Prediction (SC-CP) method and several baseline methods in terms of calibration, prediction interval width, and empirical coverage for the MEPS-21 dataset. The calibration plots show the relationship between original model predictions and observed outcomes, illustrating the effect of SC-CP’s calibration step. The prediction bands, displayed against the original model predictions, show how SC-CP and the baselines adapt to the outcome variability across different prediction contexts. The tables summarize the empirical coverage and average interval widths for each method, highlighting SC-CP’s improved efficiency and self-calibration properties.

This figure shows the performance of Self-Calibrating Conformal Prediction (SC-CP) and several baseline methods on the MEPS-21 dataset. The left side of each panel displays a calibration plot for SC-CP, showing the relationship between original and calibrated predictions, alongside prediction intervals. The right side shows prediction bands for SC-CP and baselines as a function of original predictions. The tables below summarize the empirical coverage, average interval width, and calibration error (bias) within sensitive subgroups (A=0 and A=1). The figure is divided into two parts, (a) and (b), representing two different settings of the initial model training. In Setting A, the initial model is trained on the untransformed outcomes, whereas in Setting B, the initial model is trained on the transformed outcomes, resulting in a difference in the model calibration.

This figure presents results from applying the Self-Calibrating Conformal Prediction (SC-CP) method and several baseline methods (Marginal CP, Mondrian CP, CQR, and Kernel) to the MEPS-21 dataset for predicting medical service utilization. The leftmost plot is a calibration plot for SC-CP, showing the relationship between original predictions, calibrated predictions, and prediction intervals. The other plots display prediction bands for all methods against original (uncalibrated) predictions. Each plot is accompanied by a table showing empirical coverage, average interval width, and calibration error for each method within subgroups defined by a sensitive attribute (race). This visualization helps compare the performance of SC-CP to the baselines in terms of accuracy, calibration, and interval efficiency, particularly regarding their ability to adapt to outcome heteroscedasticity.

This figure shows the results of Experiment 1 in Section C.2 of the paper. The left panel (Figure 8a) illustrates the relationship between the average interval width and calibration error. The right panel (Figure 8b) demonstrates the relative efficiency gain achieved by using Venn-Abers calibrated versus uncalibrated scores.

This figure shows an example of the Self-Calibrating Conformal Prediction (SC-CP) method’s output with a small calibration dataset (n=200). It compares the original (uncalibrated) prediction, the calibrated prediction obtained using Venn-Abers calibration, the Venn-Abers multi-prediction (a set of predictions), and the resulting prediction interval. The plot highlights how SC-CP produces a calibrated prediction while providing a prediction interval that is calibrated conditionally on the point prediction.

This figure shows the results of applying Self-Calibrating Conformal Prediction (SC-CP) and several baseline methods to the MEPS-21 dataset. The left side of each panel presents a calibration plot that visually compares original, calibrated, and Venn-Abers predictions, as well as prediction intervals generated using SC-CP. The right side shows prediction intervals generated by SC-CP and baseline methods plotted against original predictions. The bottom tables quantify the performance of each method in terms of empirical coverage, average interval width, and calibration error, separately for different sensitive subgroups (A=0 and A=1) and experimental settings (Setting A and Setting B).

This figure presents the results of applying self-calibrating conformal prediction and several baseline methods to the MEPS-21 dataset. The leftmost column displays calibration plots for SC-CP, showcasing the original and calibrated predictions alongside prediction bands. The remaining columns show prediction bands for various methods (SC-CP, Marginal CP, Mondrian CP, CQR, Kernel) as functions of the original model predictions. The table in the figure provides empirical coverage, average interval width, and calibration error (bias) in the prediction for each method, broken down by sensitive attribute group (A=0, A=1).

This figure shows the results of Experiment 1 in Section C.2, which evaluates the efficiency of prediction intervals using SC-CP and other methods under varying calibration errors and calibration set sizes. The left panel (Figure 8a) illustrates how interval width changes with different levels of calibration error, showing that SC-CP generally produces narrower intervals with increasing calibration error. The right panel (Figure 8b) compares the relative efficiency of using calibrated versus uncalibrated prediction intervals, demonstrating that calibration leads to significant efficiency gains, particularly with larger calibration set sizes.
Full paper#


