↗ OpenReview ↗ NeurIPS Homepage ↗ Chat
TL;DR#
Key Takeaways#
Why does it matter?#
This paper is crucial for researchers in histopathology and domain generalization. It directly addresses the challenge of building robust cancer detection models that generalize well across different hospitals and imaging conditions. The proposed method offers a novel and effective approach to improve out-of-domain generalization, leading to more reliable and robust diagnostic tools. The code is publicly available, encouraging reproducibility and further advancements in this vital field. This is highly relevant given the current focus on improving the robustness and generalizability of AI models in medical imaging.
Visual Insights#

The figure illustrates the proposed method’s architecture. An input image is passed through a ResNet-50 model (without GAP and classification layers), along with its corresponding nuclear segmentation mask. The model calculates the BCE loss for both the image and mask. Additionally, it calculates the Euclidean distance between the image’s embedding vector and mask’s embedding vector. The total loss is the sum of these two losses.

This table presents the out-of-domain accuracy results for the CAMELYON17 dataset. The accuracy of models trained on each of the five centers is tested on the other four centers (out-of-domain). The table compares the performance of the proposed method against several baseline methods, with and without data augmentation, highlighting the improvement in out-of-domain generalisation achieved by the proposed method.
In-depth insights#
Nuclear Morphology Focus#
Focusing on nuclear morphology in histopathology images offers a powerful approach to improve out-of-domain generalization in cancer classification. Nuclei, being relatively invariant to staining and imaging variations, provide consistent features for model training. This strategy mitigates the impact of domain shifts arising from differences in hospitals or equipment. By prioritizing nuclear characteristics, models become less reliant on domain-specific artifacts, thereby enhancing their ability to generalize to unseen data. This approach also demonstrates increased robustness to image corruptions and adversarial attacks, showcasing its potential for reliable and generalizable cancer diagnostics.
S-DG Method#
The proposed S-DG method cleverly leverages nuclear segmentation masks to improve out-of-domain generalization in cancer classification within histopathology. Instead of relying on potentially domain-specific texture information, it focuses the model’s attention on domain-invariant nuclear morphology and spatial arrangement. This is achieved by incorporating a novel regularization technique that aligns the representations of the original images and their corresponding masks during training, encouraging the model to learn shape-based features. Importantly, the method doesn’t require segmentation masks at inference time, making it computationally efficient for real-world applications. The effectiveness is demonstrated through experiments across multiple datasets, showcasing increased robustness to image corruptions and adversarial attacks. This approach offers a promising alternative to traditional stain normalization and data augmentation methods, which have shown limited success in histopathology’s challenging domain shift problem.
Multi-dataset Results#
A multi-dataset analysis would rigorously evaluate the model’s generalizability. Ideally, it would include datasets representing diverse tissue types, staining protocols, and imaging equipment. Consistent strong performance across diverse datasets would be strong evidence of the model’s robustness and generalizability. Conversely, significant performance variations across datasets might pinpoint specific areas where the model’s assumptions break down, like sensitivity to staining artifacts or specific tissue morphologies. The study should analyze the results using statistical methods to assess the significance of any observed performance differences, clearly reporting metrics such as accuracy, precision, and recall for each dataset and overall. A detailed error analysis could identify any systematic biases present in the model’s predictions, providing valuable insights for further improvement.
Robustness Analysis#
A Robustness Analysis section in a research paper would systematically evaluate the model’s resilience against various perturbations and attacks. Key aspects would include assessing performance under different noise levels (Gaussian, salt-and-pepper, etc.), evaluating effects of image corruptions (blur, compression), and measuring resistance to adversarial examples. The analysis should be thorough, utilizing multiple datasets to ensure generalizability and including quantitative metrics (accuracy, precision, recall, F1-score) to precisely measure the impact of the perturbations. Visualizations, like graphs showing performance degradation as noise increases, would enhance clarity. The inclusion of ablation studies, removing specific components to isolate influence, is crucial for a detailed understanding. Comparisons to baseline methods, using the same datasets and perturbations, would further solidify the robustness claims. Finally, a discussion of the vulnerabilities revealed during the analysis and potential future work directions for enhancing robustness is essential.
Future Directions#
Future research could explore the impact of different segmentation methods on the overall performance, investigating whether more sophisticated techniques lead to further improvements in out-of-domain generalization. The exploration of alternative network architectures, like Vision Transformers, beyond CNNs, warrants attention to understand their unique capabilities in handling domain shifts. Investigating larger, more diverse datasets is also crucial for validating the generalizability of the proposed methods across broader clinical settings. Finally, applying the method to different cancer types and other histopathological tasks, and evaluating its effectiveness in multi-organ studies, would expand its potential impact considerably.
More visual insights#
More on figures

This figure illustrates the proposed method’s architecture. The input is either an H&E stained image or that same image multiplied by its nuclear segmentation mask (with 50% probability). Both the image and the mask are passed through a ResNet-50 network (without GAP and classification layers). The network produces embedding vectors for both the image and the mask. The method minimizes the Binary Cross-Entropy (BCE) loss for both inputs and the Euclidean distance between their embedding vectors. This encourages the network to learn features that are shared by the original image and the mask, prioritizing the nuclei.

The figure illustrates the proposed method’s architecture. An input image (with a 50% chance of being multiplied by its corresponding nuclear segmentation mask) and the mask itself are fed into a ResNet-50 network. The network outputs embedding vectors for both the image and the mask. The method minimizes both the Binary Cross-Entropy (BCE) loss for image and mask classification and the L2 distance between the embedding vectors, encouraging alignment between image and mask representations.

This figure illustrates the proposed method’s architecture. The input is either the original image or the original image multiplied by its nuclear segmentation mask (with 50% probability for each). Both the image and the mask are passed through a ResNet-50 network. The network outputs embedding vectors for both. The loss function minimizes both the binary cross-entropy between the network’s predictions and ground truth for both the image and the mask, and also the Euclidean distance between the two embedding vectors. This approach encourages the network to learn features that align between the original image and its mask, prioritizing nuclear morphology.

The figure illustrates the proposed method’s architecture. An input image (or the image multiplied by its nuclear segmentation mask with 50% probability) and its corresponding mask are fed into a ResNet-50 network. The network generates embedding vectors for both the image and mask. The method minimizes the Binary Cross-Entropy (BCE) loss for both the image and the mask, and also minimizes the L2 distance between the embedding vectors. This encourages the network to learn features from both the image and mask that are related to the nuclei and helps to improve out-of-domain generalization.

The figure illustrates the proposed method’s architecture. The input image (or, with 50% probability, the image multiplied by its nuclear segmentation mask) and its corresponding mask are fed into a ResNet-50 network. The network outputs embedding vectors for both the image and the mask, and the method minimizes the Binary Cross-Entropy loss for both, as well as the L2 distance between the two embedding vectors. This encourages the network to focus on the features present in the nuclear masks, improving out-of-domain generalization.

The figure illustrates the proposed method’s architecture. An input image, optionally multiplied by its nuclear segmentation mask, and the corresponding mask are fed into a ResNet-50 network. The network generates embeddings for both the image and mask. The model minimizes the Binary Cross-Entropy loss for both inputs and also minimizes the L2 distance between the image and mask embeddings. This encourages the network to focus on nuclear morphology and organization.
More on tables

This table presents the out-of-domain accuracy results for the CAMELYON17 dataset. The models were trained on one of five centers and tested on the remaining four. The table compares the performance of the proposed method against several baselines, including different data augmentation and stain normalization techniques. The results show the average accuracy and standard deviation across ten trials for each method and center. Statistical significance is noted for the comparison of the proposed method against one specific baseline.

This table presents the out-of-domain accuracy results on the CAMELYON17 dataset. The dataset is split into five centers, each serving as a separate training domain. The table compares the performance of several methods (ERM, Macenko, HoVerNet, RandSNA, RSC, L2D, Ours, and their augmentations) across these five centers. The ‘Ours’ method represents the proposed method from the paper, with variants showing effects of regularization and data augmentation. The average accuracy across all five centers is shown for each method, allowing for a comparison of generalization performance.

This table presents the out-of-domain accuracy results for the CAMELYON17 dataset. The models were trained on one of five medical centers (each considered a different domain) and tested on the remaining four. The table compares the performance of the proposed method against several baselines, including stain normalization and data augmentation techniques. The results show the average accuracy across the four test domains for each training domain, indicating the generalizability of each model.
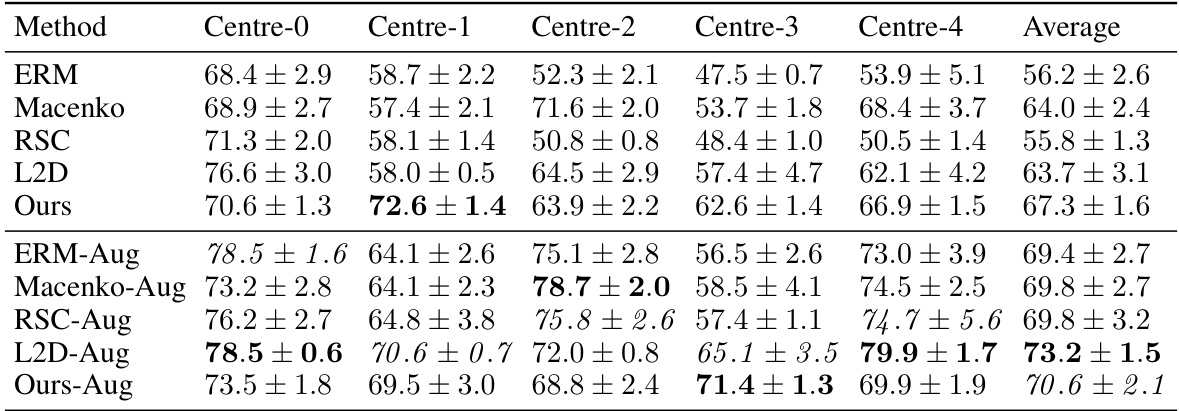
This table presents the out-of-domain accuracy results on the CAMELYON17 dataset. The dataset is split into five centers, each serving as a separate training domain. The table shows the performance of various methods (including the proposed method) on each of the test centers (out-of-domain). The best and second-best performing methods are highlighted for each center. Statistical significance is noted between the proposed method and a key baseline (L2D-Aug). Variations of the proposed method are included for ablation study.
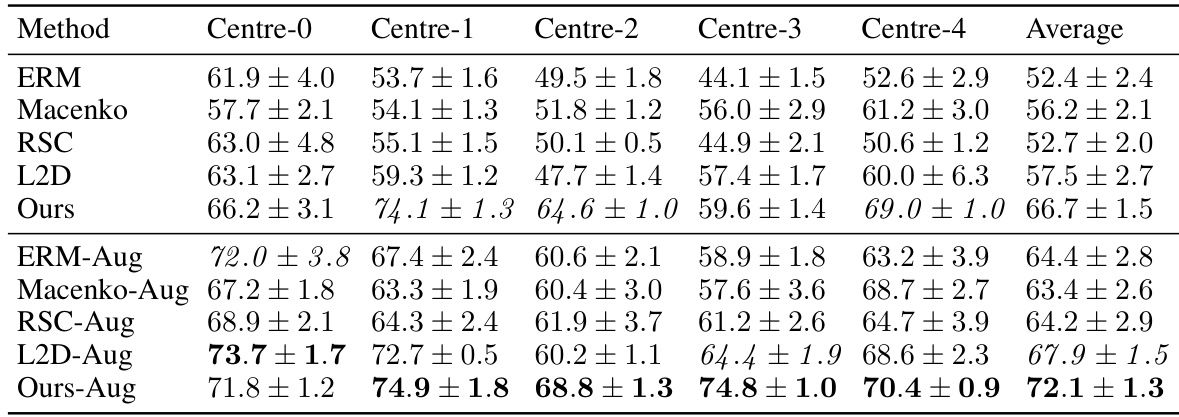
This table presents the out-of-domain accuracy results on the CAMELYON17 dataset. The dataset is split into five centers, each serving as a separate training domain. The table shows the performance of different methods, including the proposed method, on each test domain. The best performing method is highlighted in bold for each center. The average accuracy across all centers is also shown. A statistical significance test is mentioned, indicating a high significance between the proposed method and one of the baselines.

This table presents the out-of-domain accuracy results on the CAMELYON17 dataset. The models were trained on data from one of five different medical centers (Centre 0-4) and tested on data from the remaining four centers. The table compares the performance of several methods, including the proposed method, across these different centers. The best and second-best accuracies are highlighted for each centre. A statistical significance test is also reported comparing the proposed method with a baseline method.
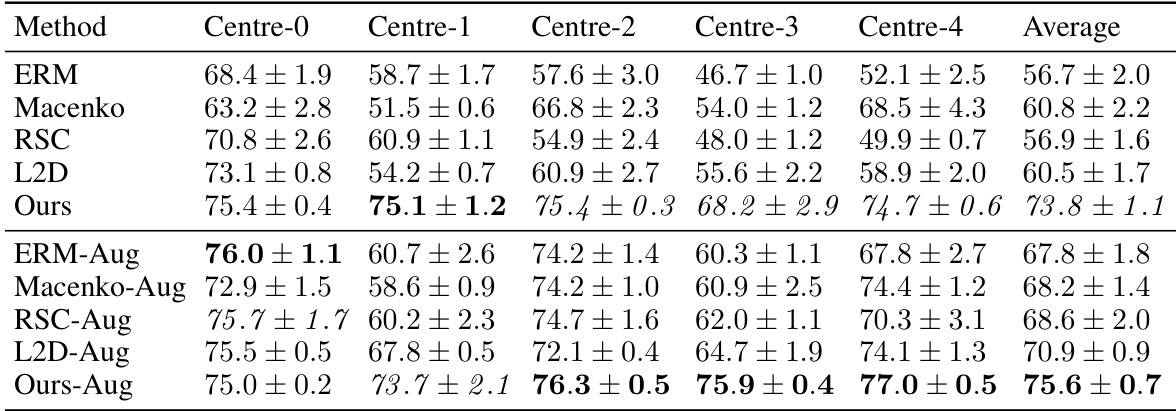
This table presents the out-of-domain accuracy results on the CAMELYON17 dataset. The dataset is split into five centers (domains), and the table shows the performance of several methods trained on each center when tested on the other four centers. The methods include several baselines (ERM, Macenko, HoVerNet, RandSNA, RSC, L2D) and the proposed method. The results are shown with and without data augmentation. The table highlights the best performing method for each center and provides a statistical comparison between the proposed method and L2D with augmentation.

This table shows the out-of-domain accuracy results on the CAMELYON17 dataset. The models were trained on one of five centers and tested on the remaining four. The table compares the performance of the proposed method against several baseline methods, including ERM (Empirical Risk Minimization), Macenko stain normalization, HoVerNet, RandSNA, RSC, and L2D. The results are presented with and without data augmentation, highlighting the impact of the proposed method on improving out-of-domain generalization.

This table presents the out-of-domain accuracy results for the CAMELYON17 dataset. The results are broken down by the training center (Centre-0 through Centre-4) for various methods, including baselines (ERM, Macenko, HoverNet, RandSNA, RSC, L2D) and the proposed method (Ours). Augmented versions of the methods are also included. The table highlights the superior performance of the proposed method, particularly when augmented data is used, and showcases its statistical significance (p-value).
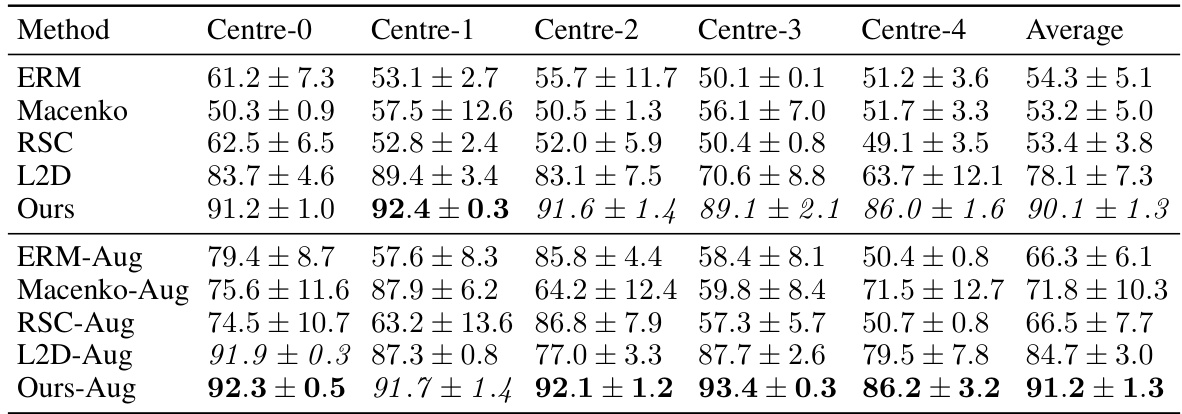
This table presents the out-of-domain accuracy results for the CAMELYON17 dataset. The models were trained on one of five centers (Centre 0-4) and then tested on the remaining four centers. The table compares the proposed method (‘Ours’) against several baselines (ERM, Macenko, HoverNet, RandSNA, RSC, L2D), both with and without data augmentation. The results show the average accuracy across the four test centers and highlight the superior performance of the proposed method, particularly when data augmentation is used.
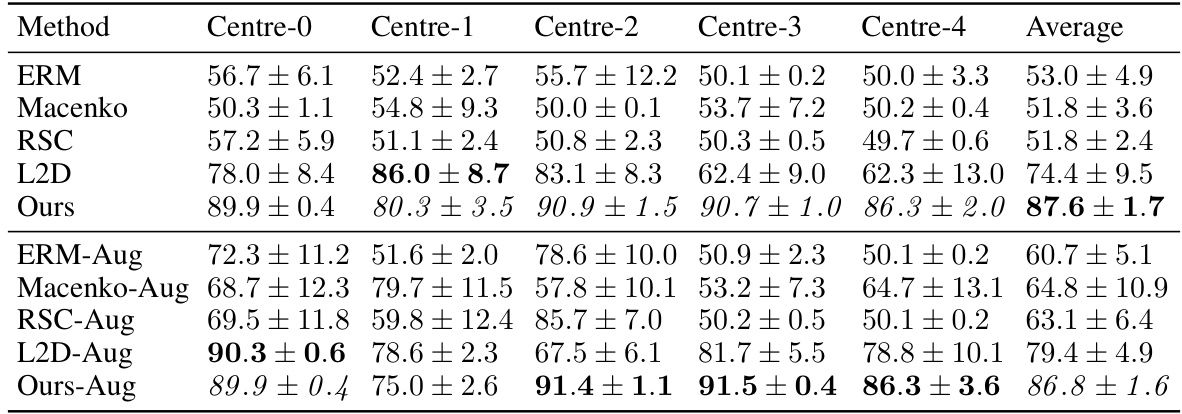
This table presents the out-of-domain accuracy results for the CAMELYON17 dataset. The dataset is split into five centers, each used to train a model, and then tested on the remaining four centers. The table compares the performance of different methods, including the proposed method, various baselines, and augmented versions, demonstrating the superior out-of-domain generalization capability of the proposed method. The statistical significance of the difference between the proposed method and a key baseline (L2D-Aug) is also noted.

This table presents the out-of-domain accuracy results on the CAMELYON17 dataset. It compares the performance of the proposed method against several baseline methods across five different centers (considered as separate domains). The table shows the average accuracy and standard deviation for each method in each center, highlighting the best and second-best performing methods. The statistical significance of the difference between the proposed method and L2D-Aug is noted, indicating a strong improvement in out-of-domain generalization by the proposed method.

This table presents the out-of-domain accuracy results on the CAMELYON17 dataset. The dataset is split into five centers, each treated as a separate domain. The table shows the performance of various methods (ERM, Macenko, HoVerNet, RandSNA, RSC, L2D, and the proposed ‘Ours’ method) for each center when trained on a single center and tested on the others (out-of-domain). The best and second-best results for each center are highlighted. Several variations of the proposed method are included, illustrating the impact of different components and data augmentation strategies. Statistical significance between L2D-Aug and Ours-Aug is noted.
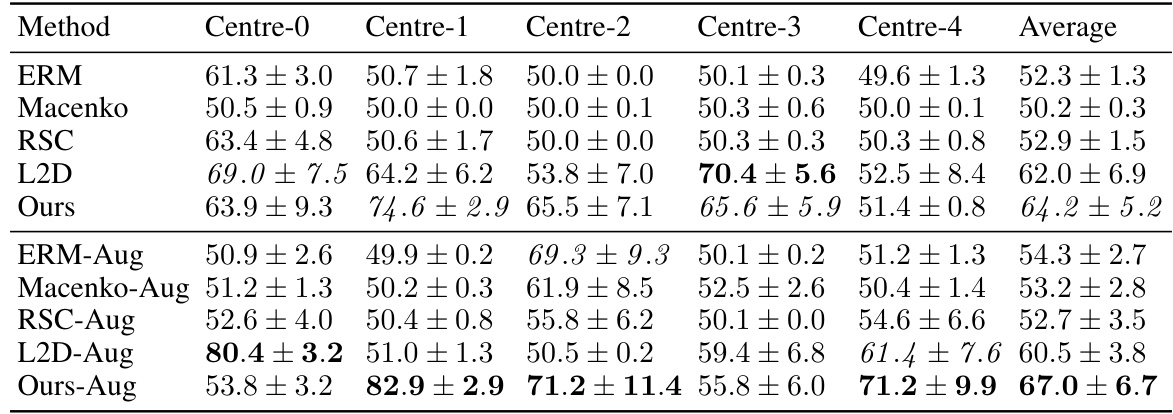
This table shows the out-of-domain accuracy results on the CAMELYON17 dataset. The dataset is split into five centers, each treated as a separate domain. The table presents the classification accuracy of different models trained on each center and tested on the other four centers (out-of-domain). It compares several methods including ERM (Empirical Risk Minimization), Macenko stain normalization, HoVerNet, RandStainNA, RSC, L2D, and the proposed method (‘Ours’). Different variations of the proposed method are also included. The average accuracy across all centers is reported, along with statistical significance (p-value) of the difference between L2D-Aug and Ours-Aug.

This table presents the out-of-domain accuracy results on the CAMELYON17 dataset. The models were trained on one of five centers (Centre 0-4) and tested on the remaining four centers. The table shows the average accuracy and standard deviation across ten models trained per center and method. Different domain generalization methods (ERM, Macenko, HoVerNet, RandSNA, RSC, L2D, Ours) are compared, both with and without data augmentation. The ‘Ours’ method refers to the proposed approach in the paper, which uses nuclear segmentation masks during training. The table highlights the significantly better performance of the proposed method, especially when combined with augmentation, demonstrating its enhanced out-of-domain generalization capabilities.

This table presents the out-of-domain accuracy results on the CAMELYON17 dataset. Each column represents a different training center (domain), and each row shows the performance of a different method. The best and second-best accuracies are highlighted in bold and italics, respectively. The table also includes results for variations of the proposed method (‘Ours’) to analyze the impact of specific components. Statistical significance testing (paired t-test) is reported for the comparison between ‘L2D-Aug’ and ‘Ours-Aug’.

This table presents the out-of-domain accuracy results for the CAMELYON17 dataset. The model is trained on one of the five centers and tested on the other four. The best performing method is compared with several baselines. Note that the table highlights the impact of using augmentation and the proposed regularization technique.

This table presents the out-of-domain accuracy results for the CAMELYON17 dataset. The dataset is split into five centers, each acting as a different domain. Models are trained on a single center and tested on the remaining four. The table compares the performance of several methods, including the proposed method (‘Ours’), highlighting the improvement in out-of-domain generalization achieved using different data augmentation techniques and regularization strategies. Statistical significance (p-value) between the proposed method and a key comparison method (L2D-Aug) is also reported.
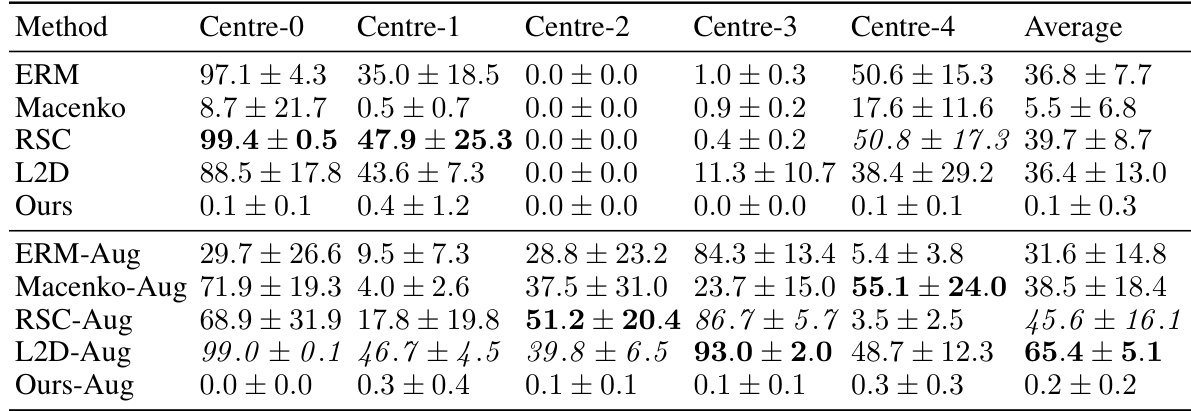
This table presents the out-of-domain accuracy results for the CAMELYON17 dataset. The dataset is split into five centres, each serving as a separate training domain. The table shows the accuracy of models trained on one centre when tested on the other four centres (out-of-domain). Multiple methods are compared, including a baseline (ERM), stain normalization methods, and existing single-domain generalization methods. The proposed method (‘Ours’) and its variations (with and without regularization, and with different data augmentation strategies) are also evaluated, demonstrating improved out-of-domain generalization performance compared to other approaches. The statistical significance of the difference between the proposed method and L2D-Aug is also highlighted.

This table presents the out-of-domain accuracy results on the CAMELYON17 dataset. The dataset is split into five centers, each treated as a separate domain. The table shows the accuracy of models trained on each center when tested on the other four centers. The results are compared across different methods: ERM (Empirical Risk Minimization), Macenko stain normalization, HoVerNet, RandSNA (Random Stain Normalization and Augmentation), RSC (Representation Self-Challenging), L2D (Learning to Diversify), and the proposed ‘Ours’ method. Variations of the proposed method are also included (e.g., without l2-regularization or mask-only). The table highlights the best and second-best performing methods for each center, and statistically significant differences (p<0.00002) between L2D-Aug and Ours-Aug are reported.

This table shows the out-of-domain accuracy results on the CAMELYON17 dataset. The dataset is split into five centers, and each center’s data is used to train a model, which is then tested on the data from the other four centers (out-of-domain). The table compares several methods, including the proposed method, stain normalization, and data augmentation techniques, showing the average accuracy across all five test centers. The best performing method for each center is highlighted in bold, indicating the superior generalisation capabilities of the proposed method.

This table presents the out-of-domain accuracy results on the CAMELYON17 dataset. The dataset is split into five centers, each treated as a separate domain. Models are trained on a single center and tested on the other four centers. The table compares the performance of several methods, including the proposed method, across the different centers. The ‘Ours’ method shows consistently high accuracy compared to baselines and other techniques. The augmented versions of methods are marked with ‘-Aug’.

This table presents the out-of-domain accuracy results on the CAMELYON17 dataset. The dataset is split into five centers (columns), each serving as a training domain. The model trained on one center is then evaluated on the remaining four centers. The best and second-best accuracies are highlighted for comparison. Different methods, including baselines and the proposed method (Ours), are compared with and without data augmentation.

This table presents the out-of-domain accuracy results for the CAMELYON17 dataset. The models were trained on one of five different medical centers (each considered a separate domain), and then tested on the remaining four centers. The table shows the average accuracy and standard deviation across ten models for each training center and method. It compares the proposed method’s performance against several established single-domain generalization methods.

This table presents the out-of-domain accuracy results on the CAMELYON17 dataset. The dataset is split into five centers, each treated as a separate domain. Models trained on one center are tested on the other four. The table shows the performance of several methods including the proposed method. The best and second-best accuracies for each center are highlighted, and the average accuracy across centers is also shown. The table also compares results with and without data augmentation and with and without the use of l2-regularization. Statistical significance is noted.

This table presents the out-of-domain accuracy results on the CAMELYON17 dataset. The dataset is split into five centers, each serving as a training domain. Models trained on one center are then tested on the remaining four centers to evaluate out-of-domain generalization performance. The table compares various methods, including the proposed method and several baselines, showing the mean accuracy and standard deviation across ten trials. The best-performing method for each center is highlighted.

This table shows the results of combining two single-domain generalization methods (L2D and RSC) with the proposed method on the CAMELYON17 dataset. The best performing method for each center is highlighted. The table demonstrates the impact of combining different methods on the overall accuracy. The use of photometric augmentations is consistent across all experiments.

This table presents the out-of-domain accuracy results for the CAMELYON17 dataset. The dataset is split into five centers, each serving as a training domain. For each center, multiple models are trained using different methods (ERM, Macenko, HoVerNet, RandSNA, RSC, L2D, and the proposed ‘Ours’ method), and their performance is evaluated on the remaining four centers as out-of-domain datasets. The table highlights the best and second-best performing methods for each center and provides the average accuracy across all centers. The effect of data augmentation on the performance is also shown by comparing methods with and without augmentation (’-Aug’). Statistical significance between the proposed ‘Ours’ and L2D methods is noted.

This table compares the performance of different methods for out-of-domain generalization on the CAMELYON17 dataset using a ViT-Tiny model. It includes results for ERM, RandStainNA (RSNA), DDCA, L2D, and the proposed method. The table shows the accuracy for each of the five centers in CAMELYON17, the average accuracy across all centers, and the average accuracy excluding Center 4. Photometric augmentations were used for all methods.

This table presents the results of an experiment comparing different methods for out-of-domain generalization using a ViT-Tiny model on the Ocelot dataset. The methods compared include ERM, RSNA, DDCA, L2D and the proposed method. The table shows the accuracy for each method on five different centers (Centre-0 to Centre-4), the average accuracy across all centers, and the average accuracy excluding Centre-4.
Full paper#


