↗ OpenReview ↗ NeurIPS Homepage ↗ Chat
TL;DR#
Traditional reinforcement learning struggles with high-frequency decision-making, leading to inconsistent and poor performance. Distributional Reinforcement Learning (DRL), while offering a more nuanced approach to value estimation, also suffers from similar issues at high frequencies. The challenge lies in the collapse of action-conditioned return distributions as decision frequency increases, impacting value estimation and policy optimization.
This research introduces the concept of ‘superiority’, a probabilistic generalization of the advantage function, to address these high-frequency challenges in DRL. It presents theoretical analysis showcasing how superiority distributions better preserve essential information at high frequencies. Furthermore, the paper proposes a novel superiority-based DRL algorithm, validated through simulations, that shows significant performance improvements over conventional methods. This significantly advances the field of high-frequency RL applications.
Key Takeaways#
Why does it matter?#
This paper is crucial for high-frequency reinforcement learning researchers. It reveals the sensitivity of distributional RL to decision frequency, offering novel algorithms that address the limitations of existing methods, opening avenues for improved control in real-time applications. It also contributes to the theoretical understanding of continuous-time distributional RL, providing new concepts and a framework for further exploration.
Visual Insights#
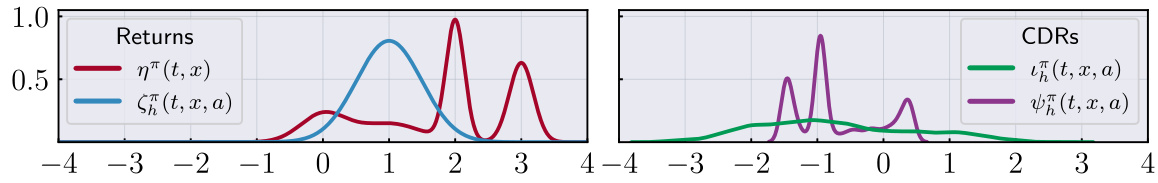
This figure compares the probability density functions (PDFs) of return distributions and two candidate coupled difference representations (CDRs). The left panel shows the PDFs of the policy’s return distribution (ηπ(t,x)) and the h-dependent action-conditioned return distribution (ζ(t,x,a)). The right panel shows two candidate CDRs of ηπ(t,x) and ζ(t,x,a). One CDR is the superiority distribution (ψ(t,x,a)) and the other CDR is from Example 4.2. The figure illustrates that the superiority distribution captures more of the individual features of both return distributions than other such CDRs.
This table lists the hyperparameters used in the simulations for the tested algorithms. It includes parameters common to all algorithms (replay buffer sampling, capacity, batch size, optimizer, learning rate, discount factor, target network update period) and algorithm-specific parameters (e-greedy exploration parameter, value network architecture, advantage network architecture, number of atoms, quantile Huber parameter K) for DAU, QR-DQN, DSUP and DAU+DSUP. Note that although the original DAU implementation scaled the learning rate with h, the authors use an alternative approach by updating every h⁻¹ environment steps.
In-depth insights#
High-Freq DRL Gaps#
High-frequency distributional reinforcement learning (DRL) presents unique challenges. Traditional DRL methods, while effective in many scenarios, struggle when actions are taken at extremely high frequencies. This is because the increased frequency leads to diminished action gaps, making it difficult to distinguish between actions’ effects on value distributions. The core issue lies in the collapse of action-conditioned return distributions towards the overall policy distribution as the frequency increases; this reduces the information available to learn effective policies. Addressing this requires novel approaches to action gap quantification, possibly by focusing on higher-order statistics of return distributions, or by developing frequency-invariant representations of value. This may entail modeling the distributions of differences between action-conditioned returns rather than directly modeling the return distributions themselves.
Superiority Dist#
The concept of “Superiority Dist,” likely referring to a distributional representation of the advantage function in reinforcement learning, presents a novel approach to address the challenges of high-frequency decision-making. By modeling the distribution of superiorities, rather than just their expected value, this method aims to capture crucial information lost in traditional advantage-based techniques. This distributional perspective offers a more robust and informative signal for policy learning, especially in scenarios with noisy or uncertain dynamics. The key insight is in capturing not just the mean difference in expected returns between actions, but also the variability around that mean. This nuanced view of action values likely results in better-performing controllers because it allows the algorithm to differentiate between high-variance and low-variance actions, making for more reliable decision-making under uncertainty. Furthermore, the introduction of a rescaled superiority distribution is crucial for ensuring the effectiveness of the method across different decision frequencies. The choice of rescaling factor directly impacts the balance between robustness to noise and maintaining sufficient sensitivity to action gaps. Ultimately, the success of this “Superiority Dist” approach highlights the potential of distributional methods for tackling complex, real-world reinforcement learning problems.
DSUP Algorithm#
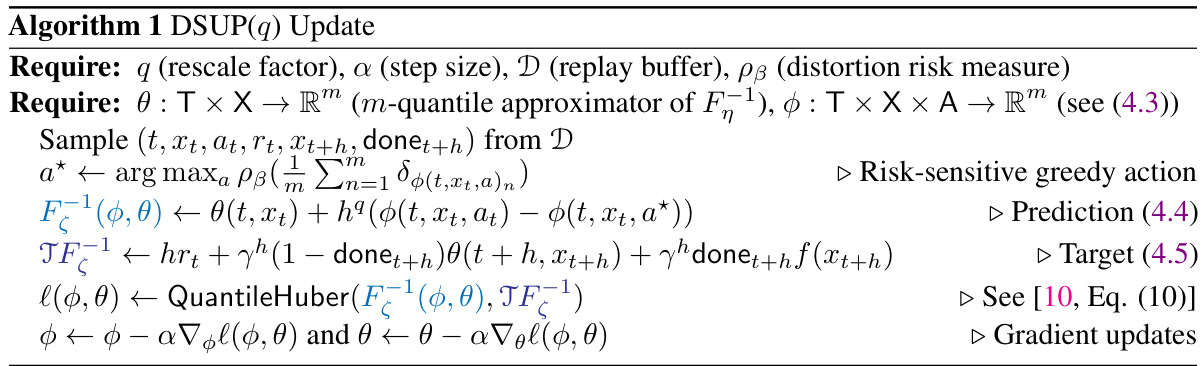
The DSUP algorithm, a core contribution of the research paper, presents a novel approach to distributional reinforcement learning (DRL) designed to address the challenges posed by high-frequency decision-making. DSUP tackles the problem of collapsing action-conditioned return distributions that plague traditional DRL methods in such scenarios. This is achieved by introducing the concept of “superiority”, a probabilistic generalization of the advantage function. DSUP leverages the superiority distribution to learn a more robust policy by using a novel quantile function representation and a rescaling factor that effectively preserves the distributional action gap in high-frequency settings. The algorithm builds upon quantile regression techniques and incorporates a risk-sensitive greedy action selection strategy. Empirical evaluations in an option trading domain demonstrate the algorithm’s superior performance, outperforming established methods like QR-DQN and DAU, particularly in high-frequency scenarios. The algorithm demonstrates a strong ability to maintain reliable performance at high decision frequencies, a significant advancement for real-time applications of DRL. The theoretical foundation of DSUP includes a rigorous analysis of the action gap and the rate of collapse of return distributions, providing a strong mathematical backing for the proposed approach.
Option Trading#
The application of reinforcement learning to option trading presents a compelling case study, particularly within high-frequency settings. The continuous-time framework used here is well-suited to modeling this domain. Distributional RL methods offer a sophisticated approach to handling the uncertainties and risks inherent in option trading, especially when dealing with high-frequency decision-making. The paper’s analysis of action gaps and the introduction of the superiority distribution provide a valuable framework for understanding the challenges faced by RL agents in this domain. The superior performance of DSUP(1/2) in risk-neutral and risk-sensitive settings highlights the efficacy of the proposed algorithm. However, further research into the robustness and generalizability of the proposed methods in real-world market conditions is needed. A limitation of the current work is the reliance on simulated market data; real-world validation would further strengthen the claims of the study. The computational requirements for high-frequency trading remain significant, posing a practical challenge that should be carefully considered in future work.
Future Research#
Future research directions stemming from this work on continuous-time distributional reinforcement learning (DRL) could explore several key areas. Extending the theoretical framework to handle action-dependent rewards is crucial for broader applicability. Developing more sophisticated algorithms that combine the strengths of the proposed superiority distribution with existing methods like DAU, possibly through a multi-timescale approach, warrants investigation. The impact of different distortion risk measures on the performance and stability of superiority-based agents should be further analyzed. Empirical evaluations across diverse continuous-time environments are needed to solidify the approach’s generalizability. Finally, exploring the potential of the superiority distribution in other areas of DRL, such as model-based methods or offline RL, could yield significant advancements.
More visual insights#
More on figures
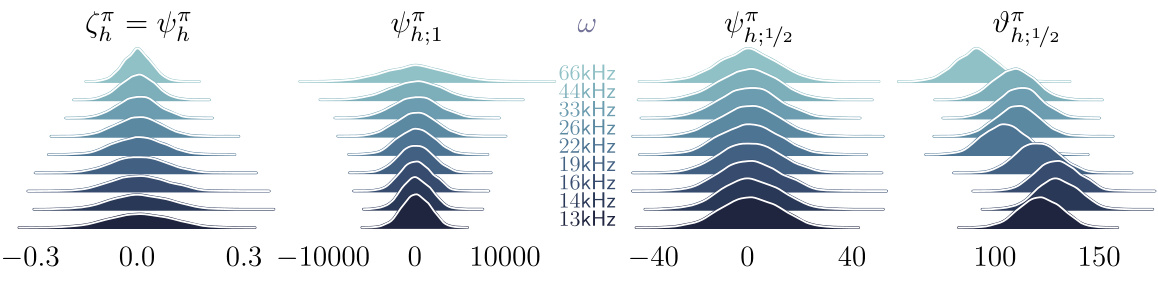
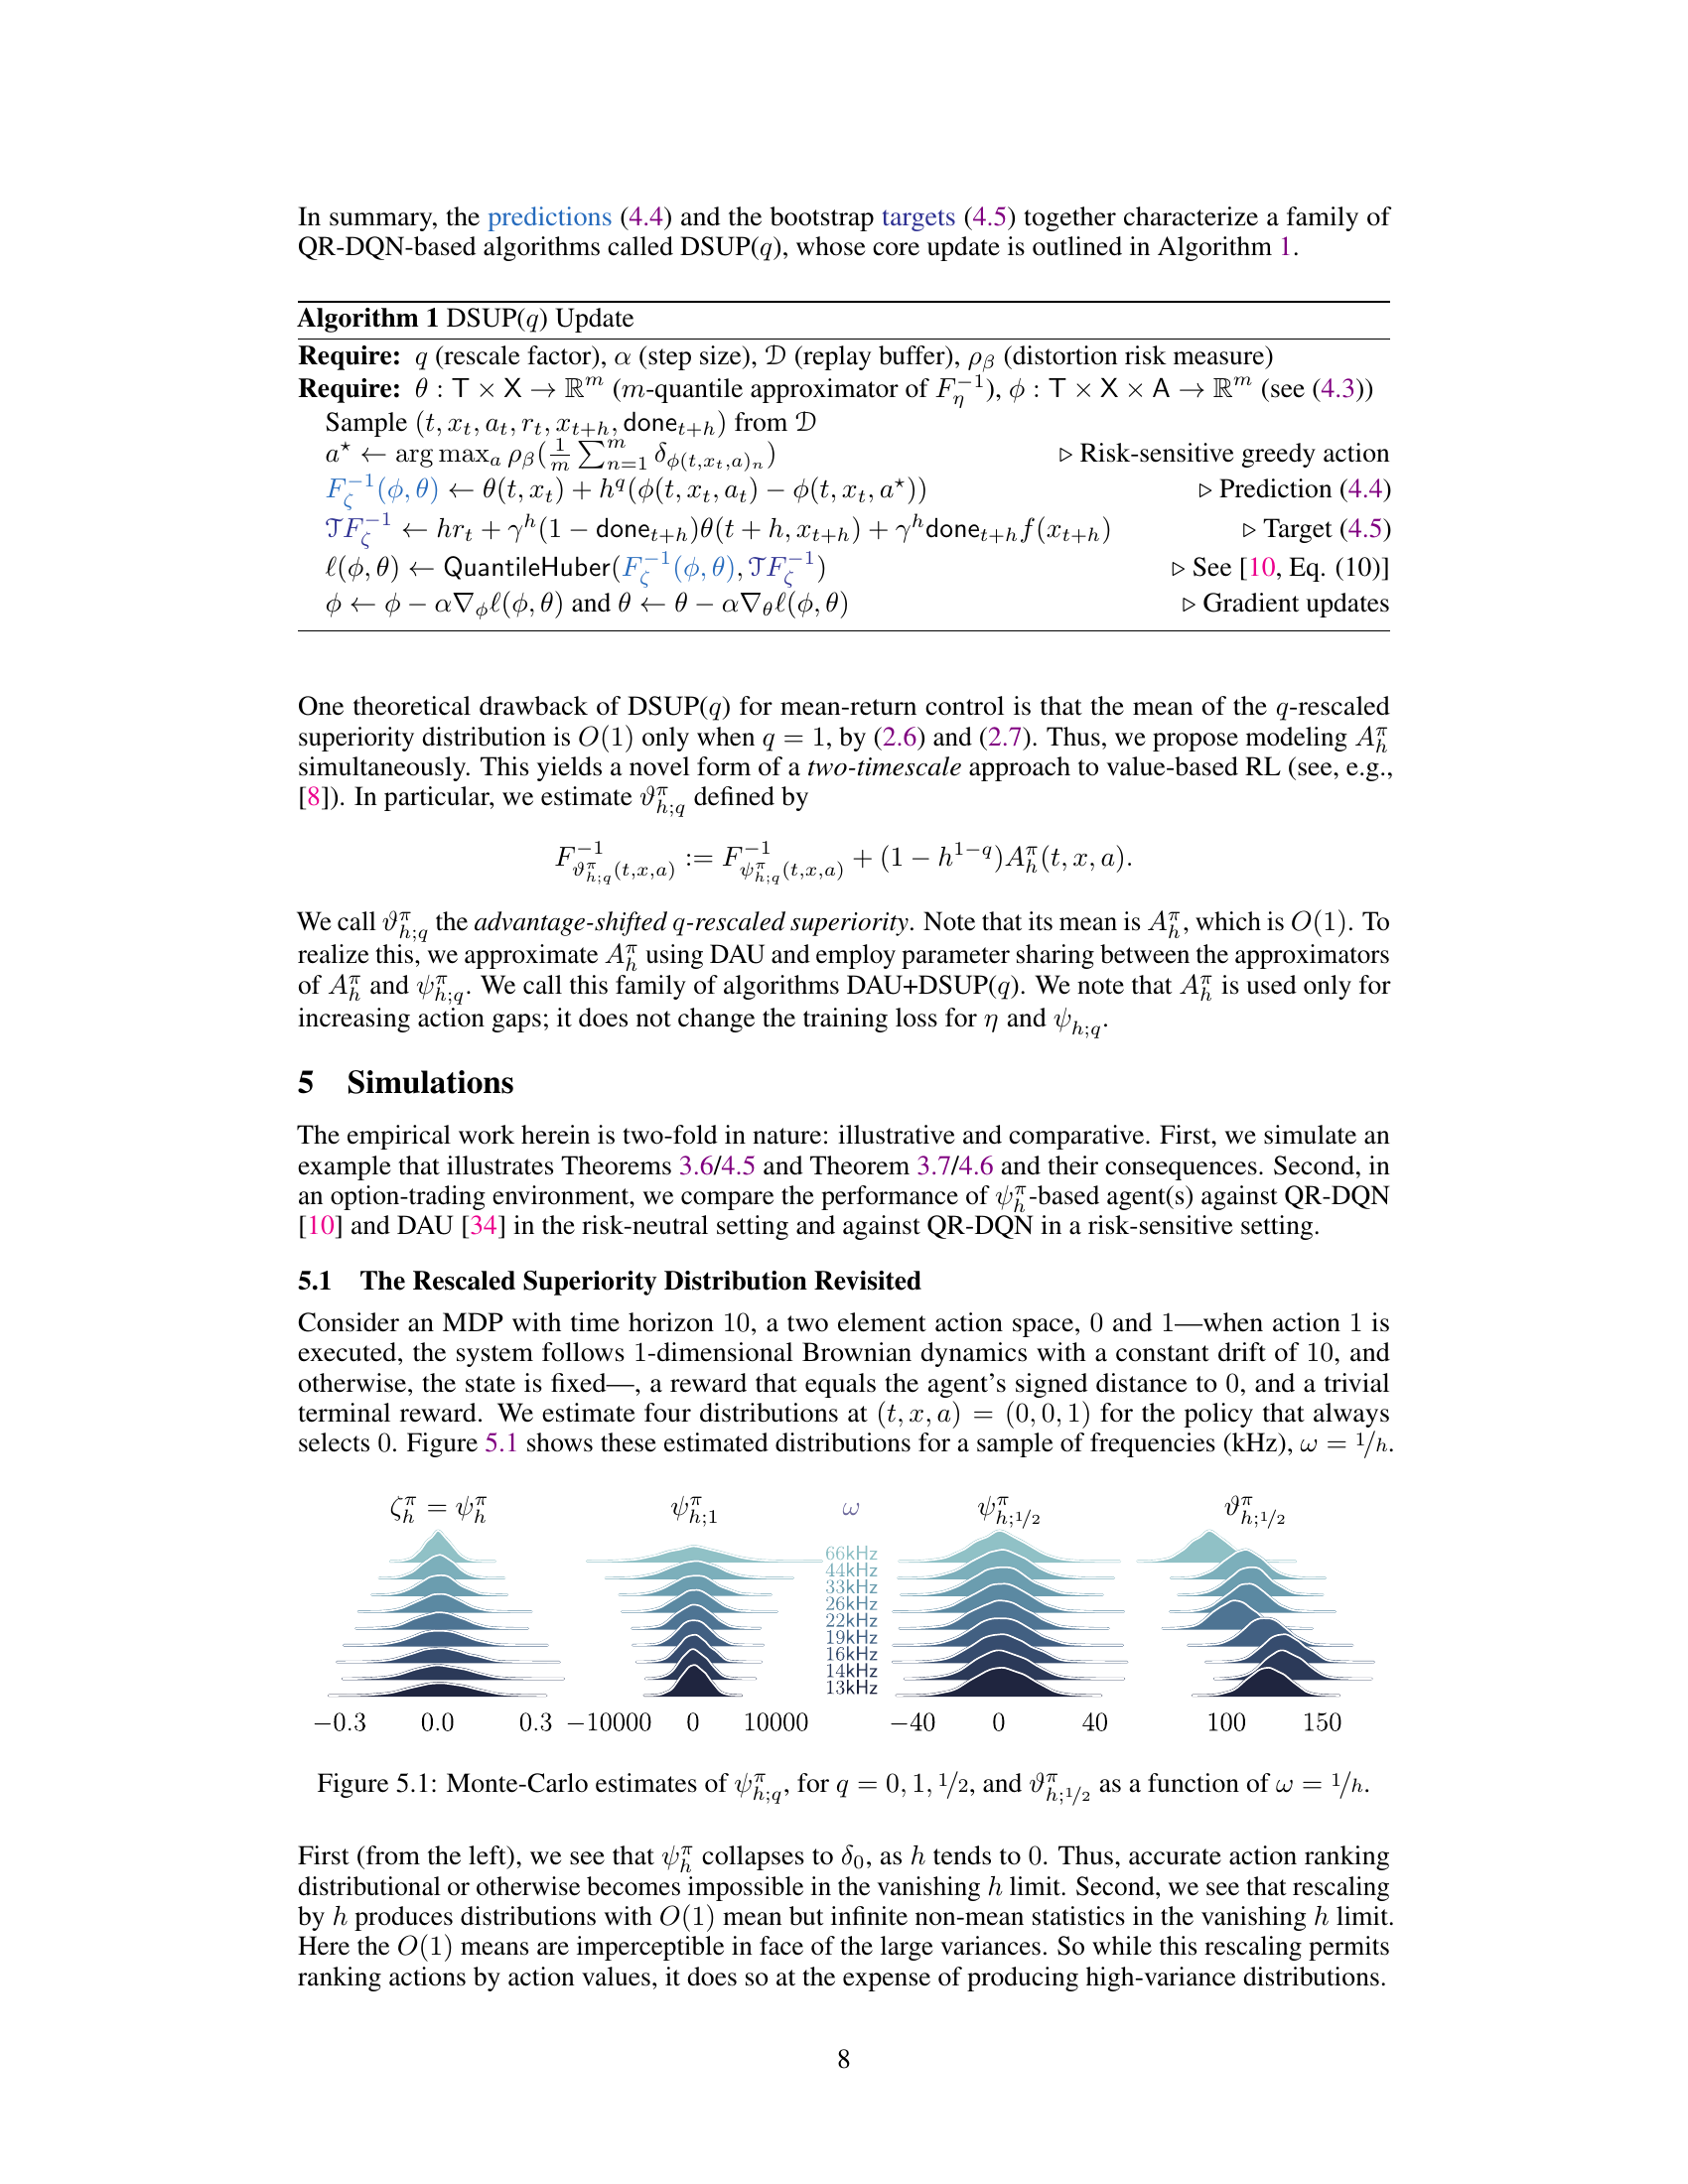
This figure shows Monte-Carlo estimates of four different rescaled superiority distributions (ψ;q) with q = 0, 1, 1/2 and the advantage-shifted 1/2-rescaled superiority distribution (υπ;1/2) as a function of the decision frequency (ω = 1/h). The plots illustrate how the distributions change as the decision frequency increases (h decreases). The x-axis represents the value of the distributions, and the y-axis is the probability density. This figure supports Theorems 3.6/4.5 and 3.7/4.6 from the paper by demonstrating the collapse of the superiority distribution when no rescaling is applied, and its behavior under different rescaling approaches (q=1, q=1/2) at high frequencies. The advantage-shifted version (υπ;1/2) is also presented to show its effectiveness in high frequency setting.
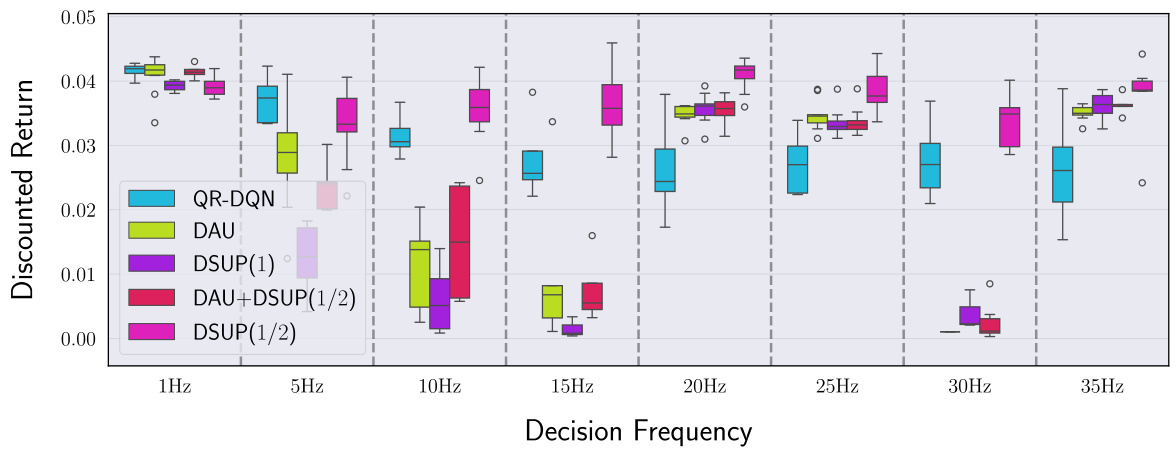
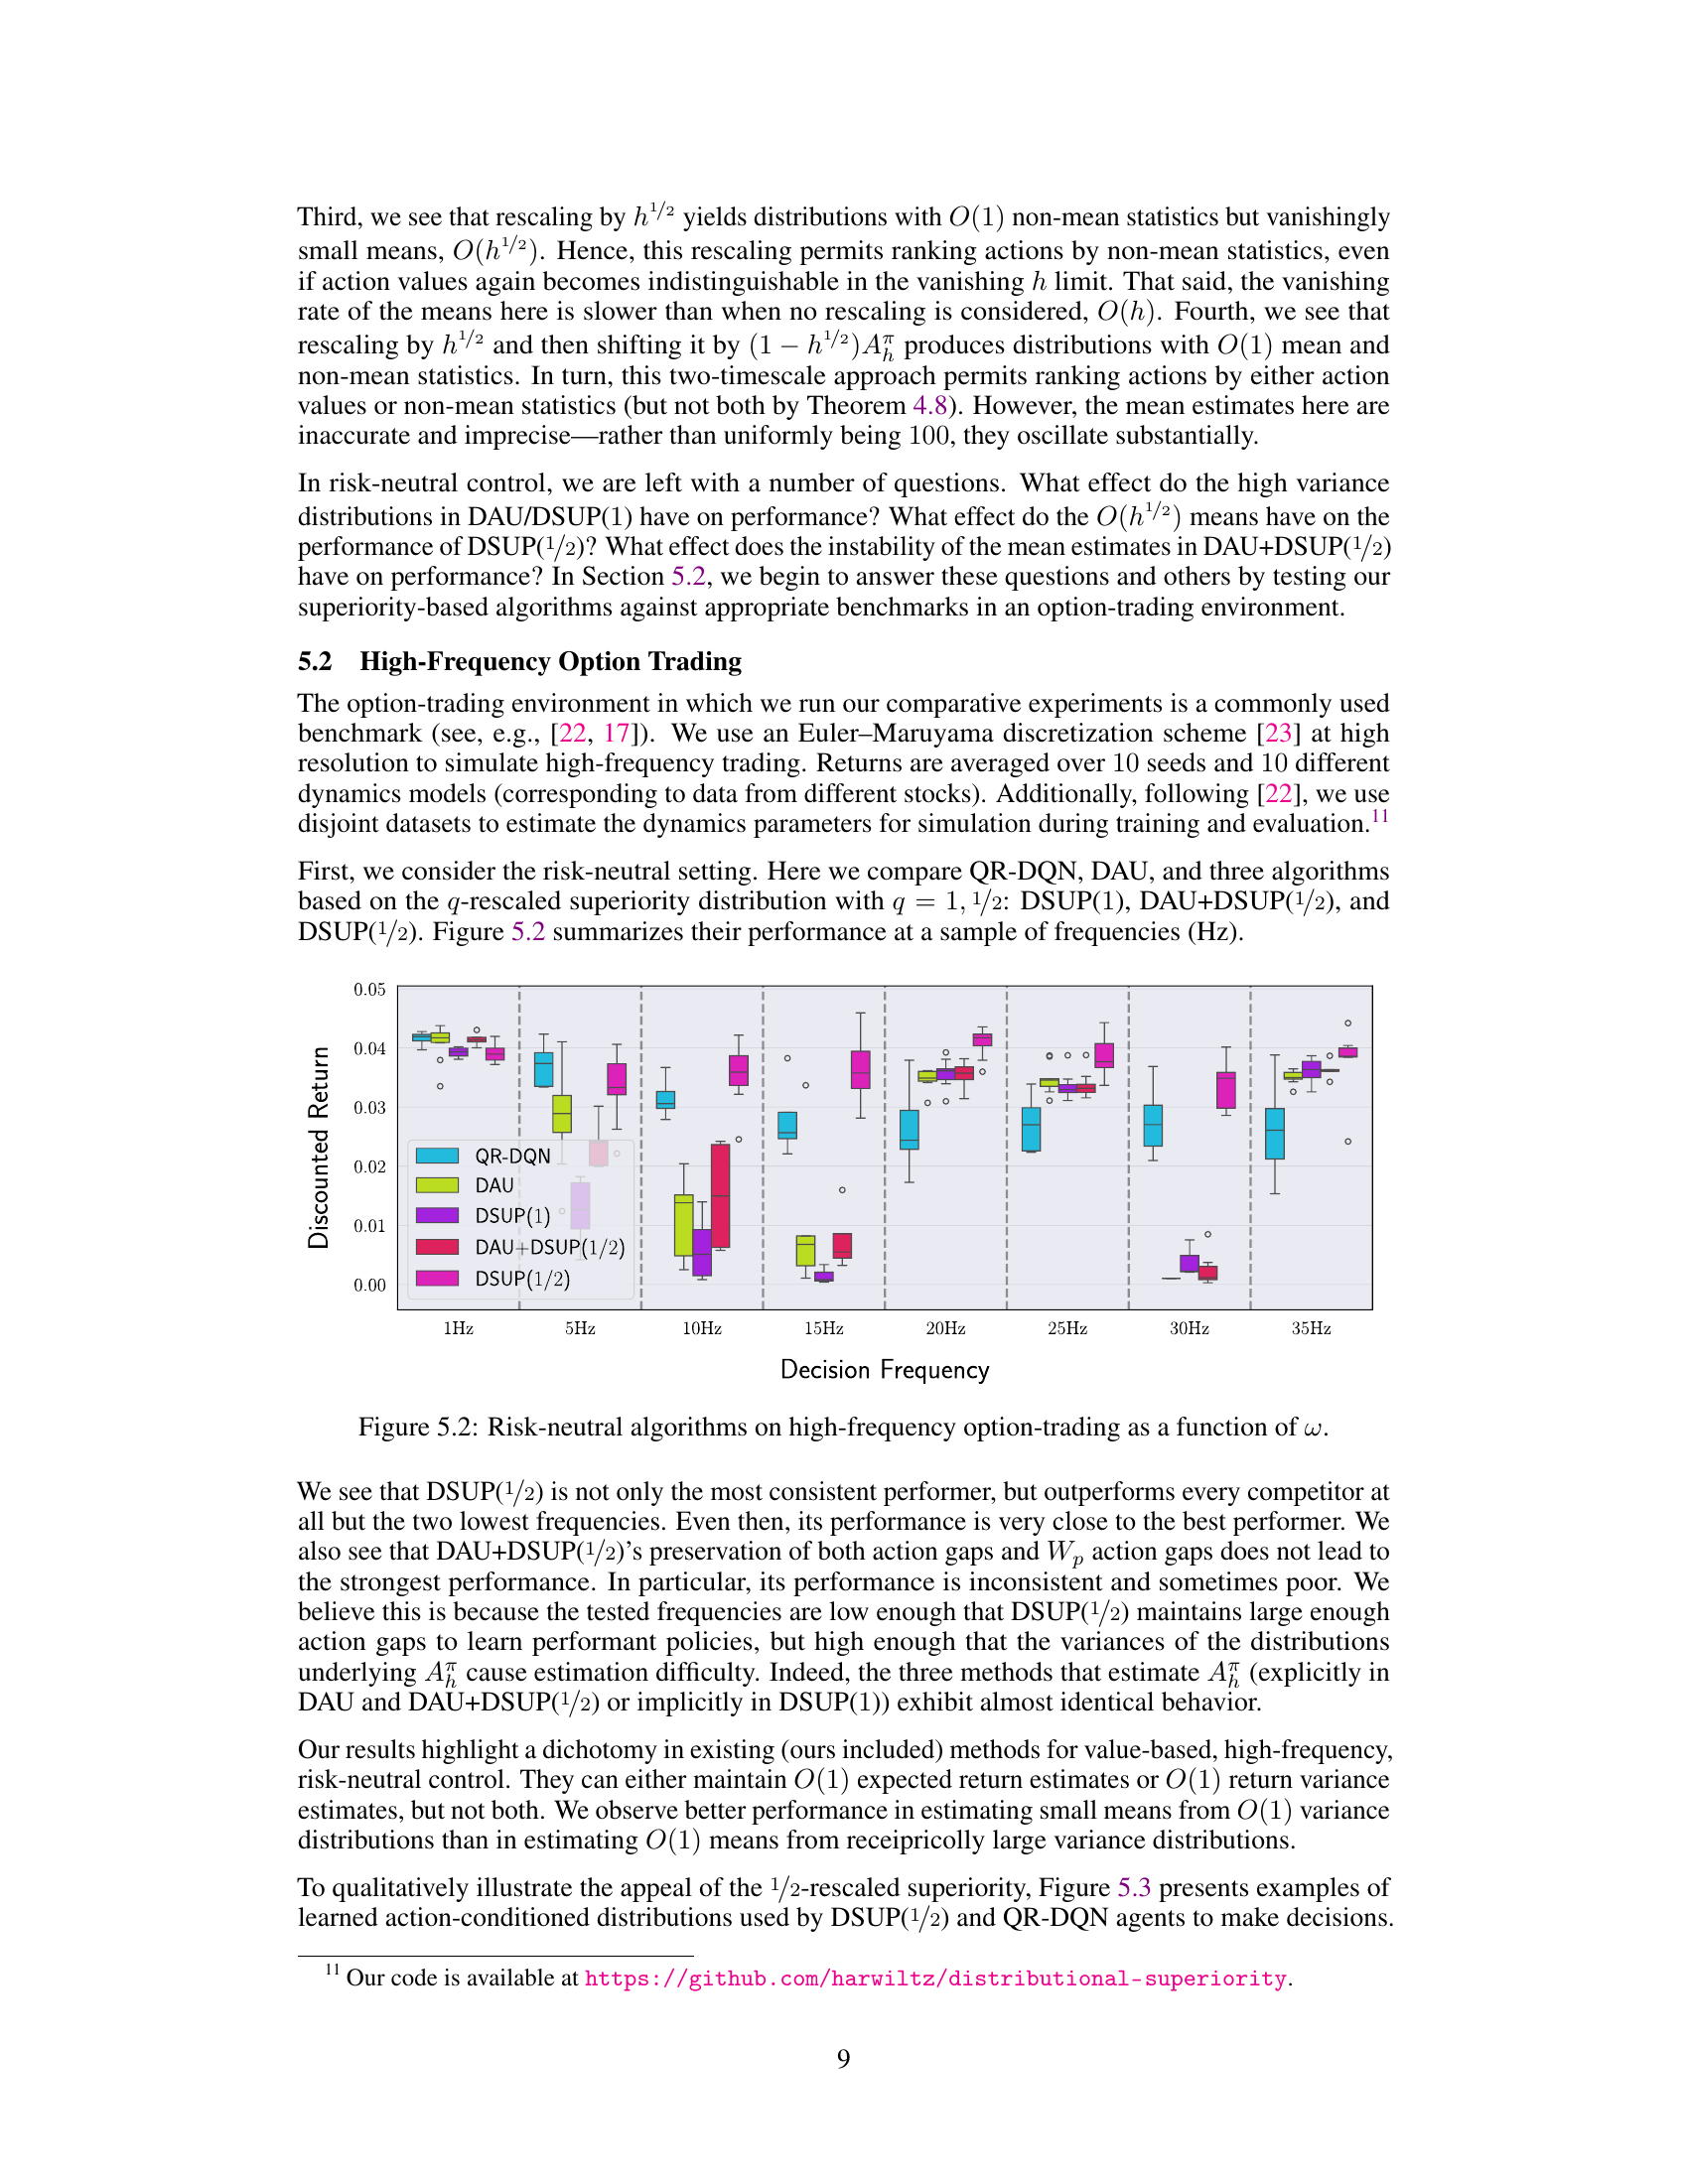
This box plot shows the discounted returns of different algorithms (QR-DQN, DAU, DSUP(1), DAU+DSUP(1/2), and DSUP(1/2)) across various decision frequencies (1Hz, 5Hz, 10Hz, 15Hz, 20Hz, 25Hz, 30Hz, and 35Hz). The y-axis represents the discounted returns, and the x-axis represents the decision frequency. Each box plot represents the distribution of discounted returns for a specific algorithm and frequency. The figure illustrates the performance of different value-based RL algorithms in a high-frequency option-trading environment under the risk-neutral setting.
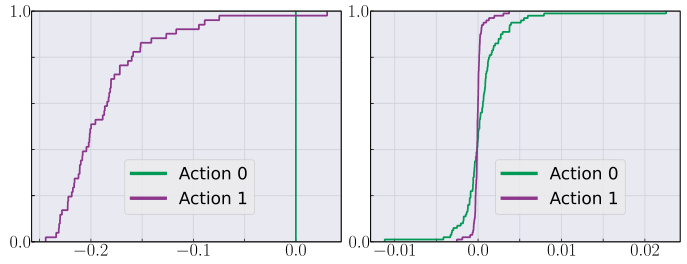
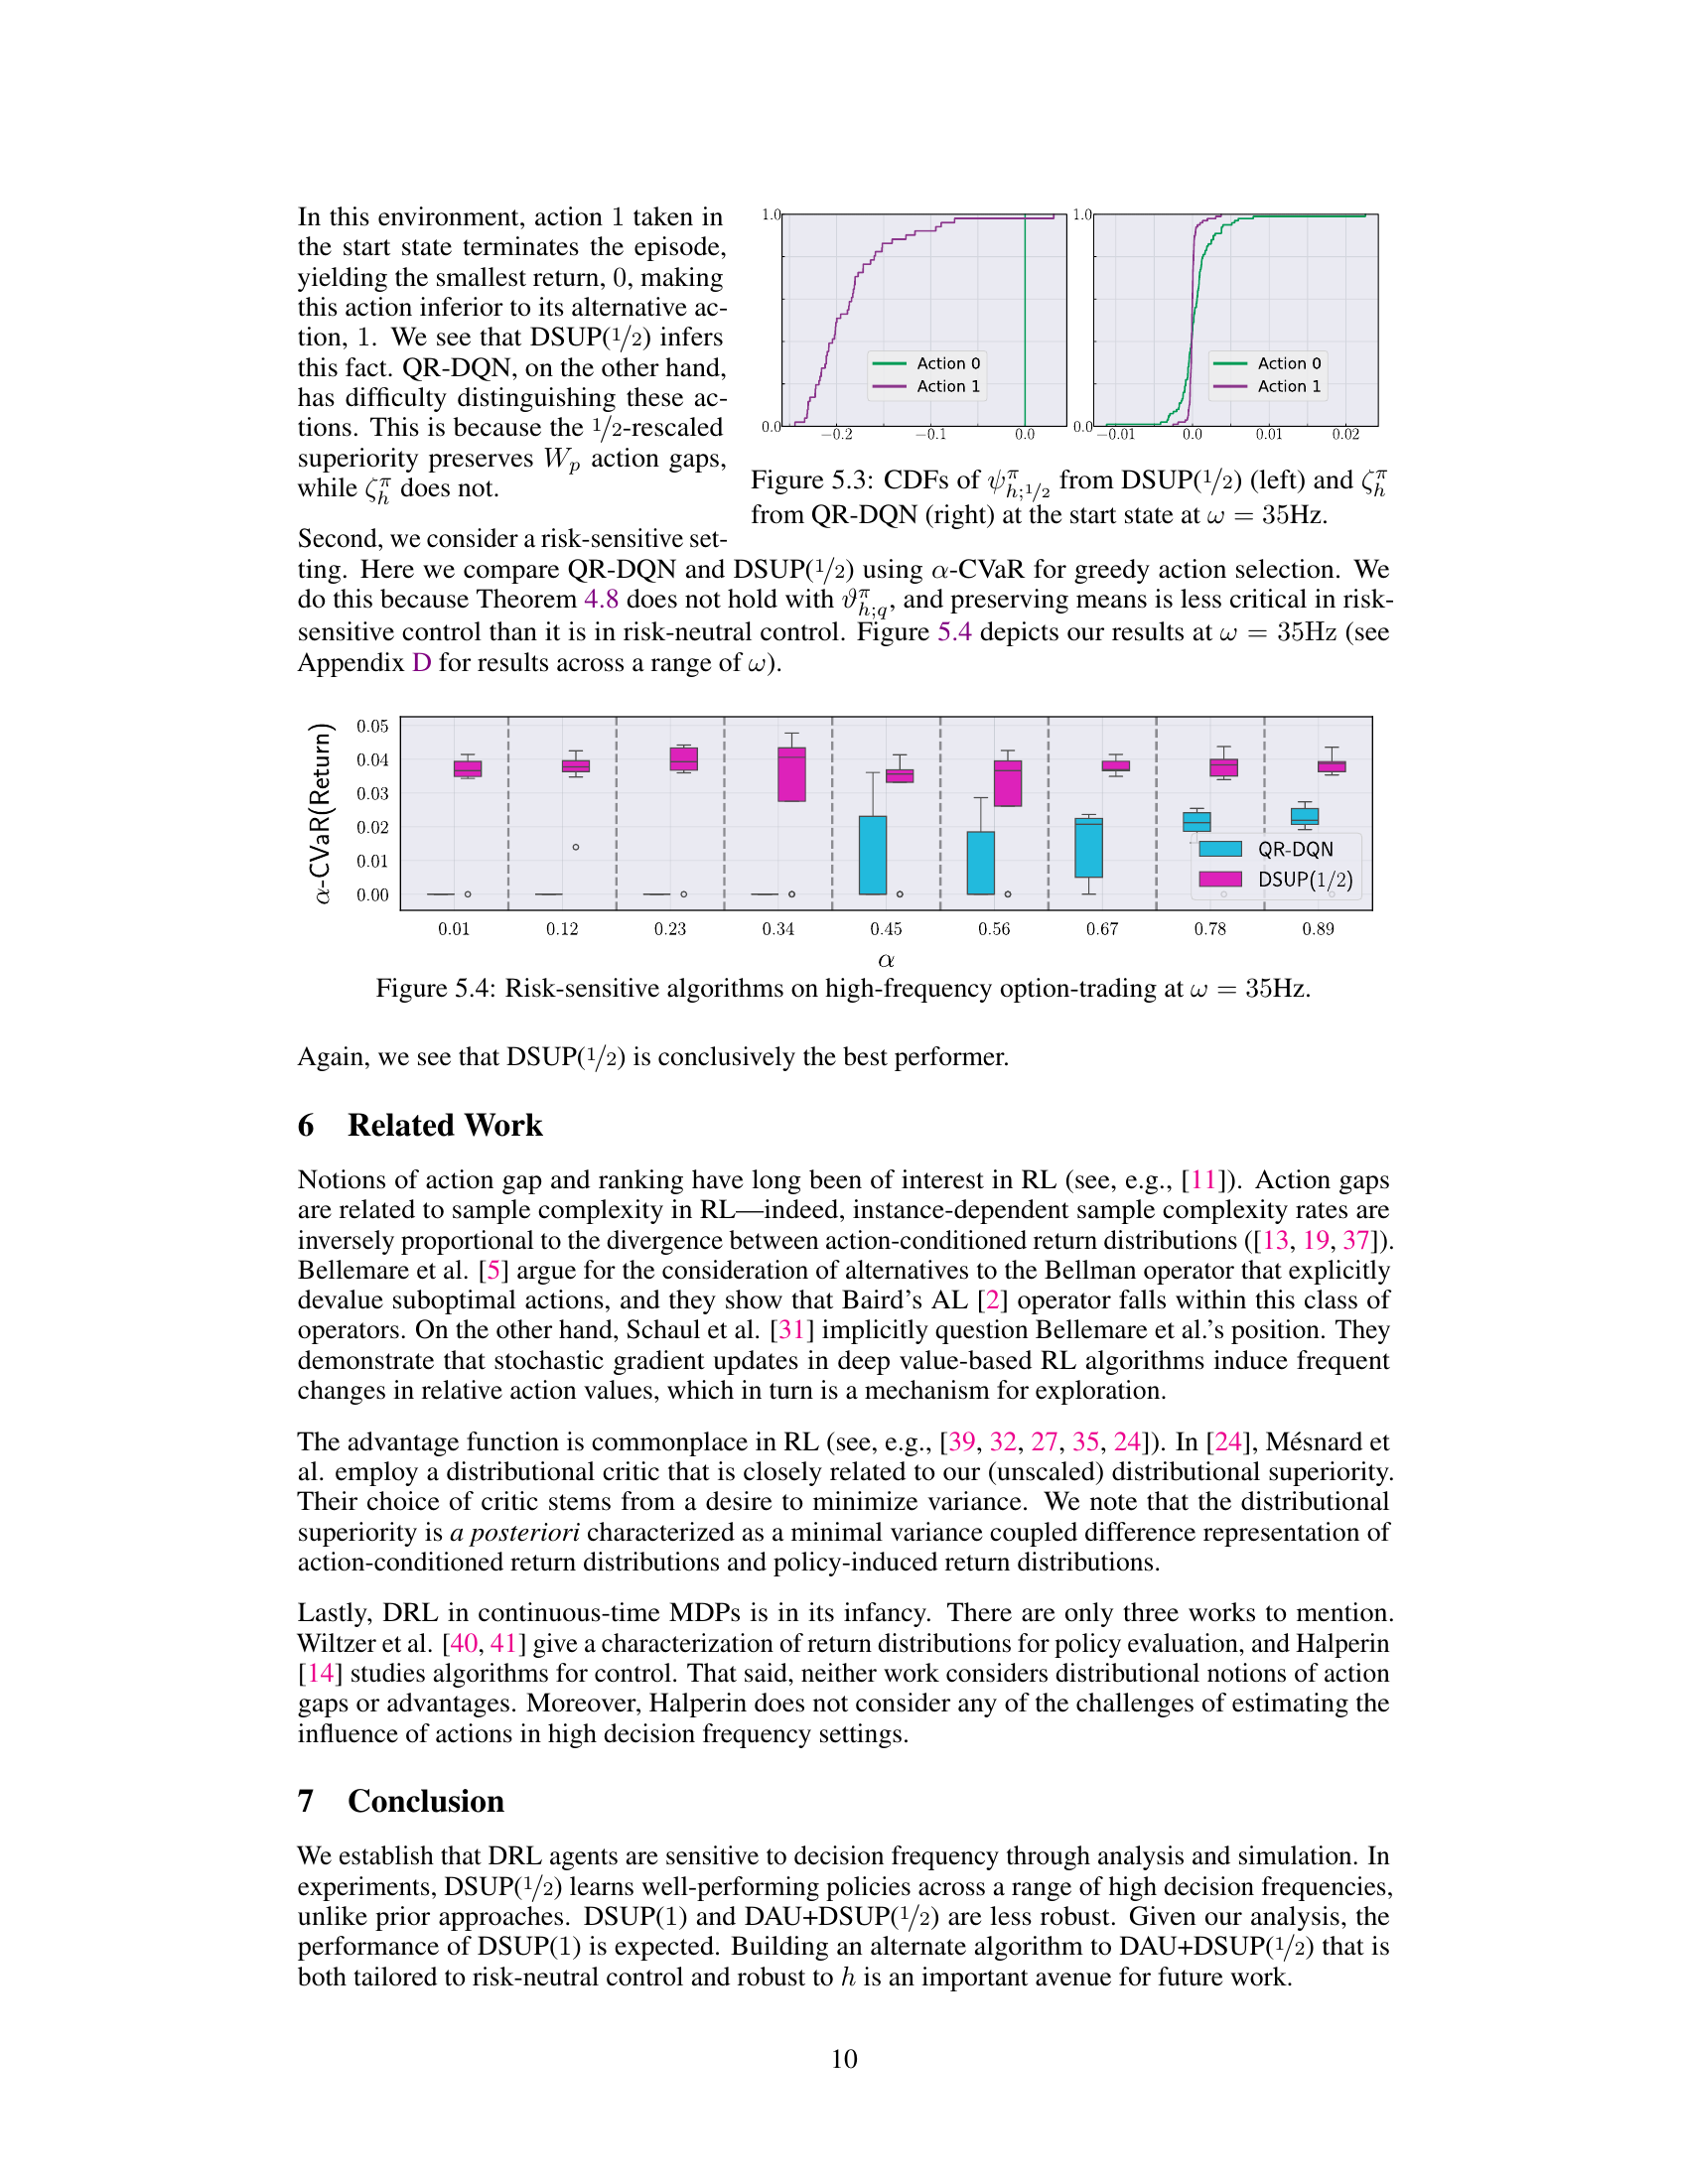
This figure compares the cumulative distribution functions (CDFs) of the 1/2-rescaled superiority distribution (ψ;1/2) learned by the DSUP(1/2) algorithm and the QR-DQN algorithm. The comparison is made for actions 0 and 1 at the initial state of the environment when the decision frequency is 35 Hz. The plot shows that DSUP(1/2) better distinguishes between the two actions, while QR-DQN struggles to discriminate between them.
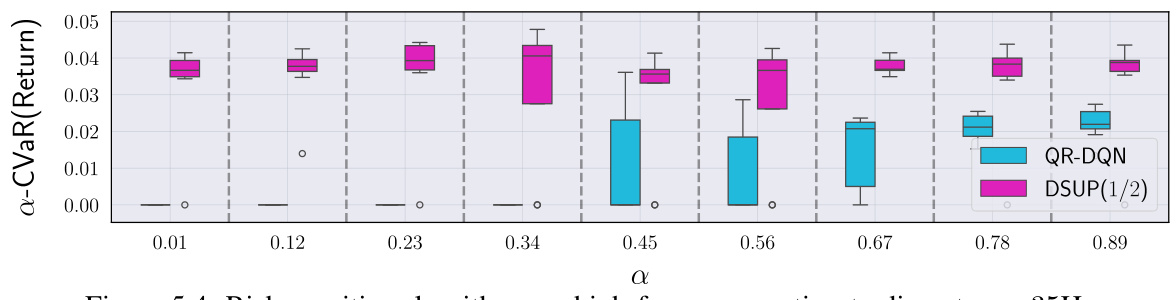
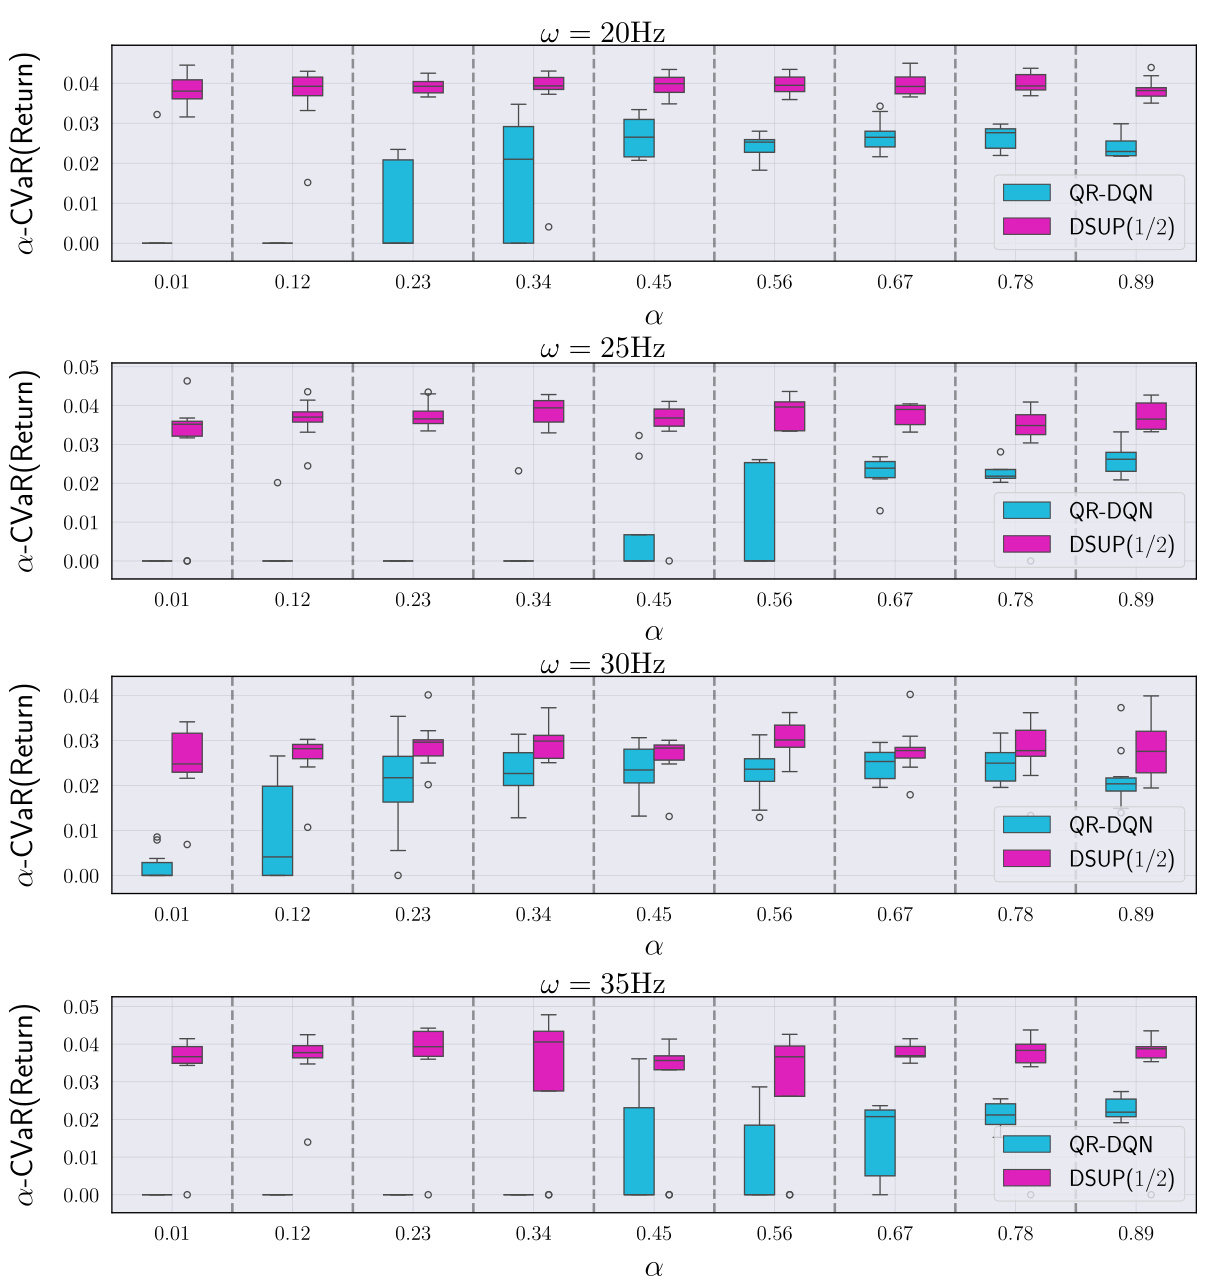
This figure shows the performance comparison of QR-DQN and DSUP(1/2) algorithms in a risk-sensitive setting for high-frequency option trading. The x-axis represents different values of α (a parameter in the α-CVaR risk measure), while the y-axis shows the α-CVaR of the returns obtained by each algorithm. Error bars represent variability in performance across multiple simulation runs. The results indicate that DSUP(1/2) outperforms QR-DQN consistently across various values of α, suggesting its superiority in risk-sensitive high-frequency trading scenarios.
The figure shows Monte-Carlo estimates of four different rescaled superiority distributions (ψ;q) with q = 0, 1, 1/2, and the advantage-shifted 1/2-rescaled superiority distribution (υπ;1/2) as a function of the decision frequency (w = 1/h). It illustrates the impact of different rescaling factors on the distributions as the decision frequency increases. The figure is crucial in demonstrating how the choice of the rescaling factor affects the behavior of the superiority distribution and its suitability for action ranking in high-frequency decision-making scenarios.
Full paper#