↗ OpenReview ↗ NeurIPS Homepage ↗ Chat
TL;DR#
Current methods for mitigating bias in image retrieval primarily focus on balancing representation across a limited number of demographic groups, often ignoring the complexities of intersectional identities. This can perpetuate harmful stereotypes and exacerbate existing inequalities. This oversight is problematic as it fails to address the nuanced and often overlapping identities and experiences of many marginalized groups. For example, simply ensuring equal representation for both men and women does not guarantee equitable representation of women from minority racial groups. This research highlights the limitations of current fairness techniques and the need for more sophisticated approaches that account for intersectional identities.
This paper introduces Multi-Group Proportional Representation (MPR), a novel metric that quantifies representation across intersectional groups. MPR measures the worst-case deviation between the observed and target distributions over a diverse set of representation statistics. To achieve MPR in retrieval, the researchers developed a practical algorithm called Multi-group Optimized Proportional Retrieval (MOPR). MOPR efficiently retrieves items that maximize both similarity to a query and proportional representation across intersectional groups. Through extensive experiments, the researchers showed that MOPR outperforms existing methods in balancing both retrieval accuracy and fair representation. This work emphasizes the critical importance of accounting for intersectional identities when designing fair and equitable AI systems.
Key Takeaways#
Why does it matter?#
This paper is crucial for researchers working on fair and unbiased retrieval systems. It addresses the critical issue of intersectional representation, providing a novel metric (MPR) and algorithm (MOPR) to ensure fair representation across various demographic groups. Its findings challenge existing approaches, demonstrating the need for more nuanced fairness considerations in retrieval systems, paving the way for more equitable AI systems.
Visual Insights#

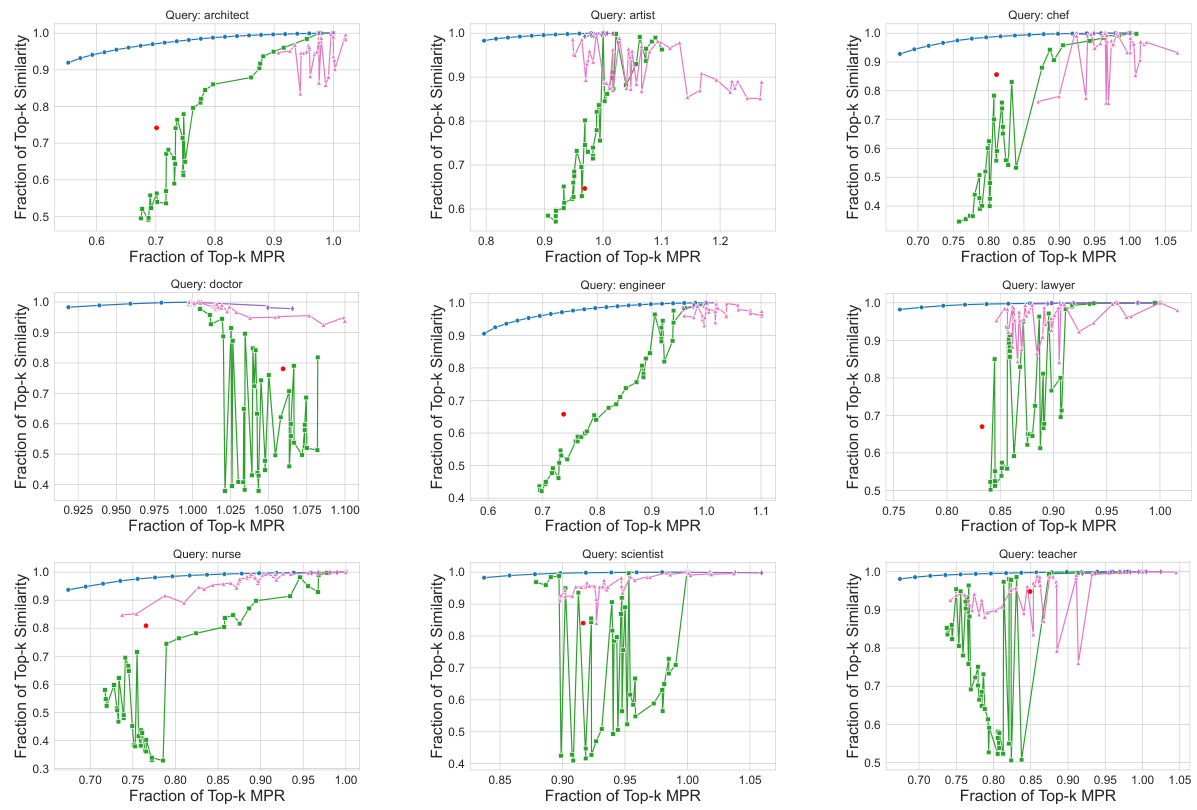
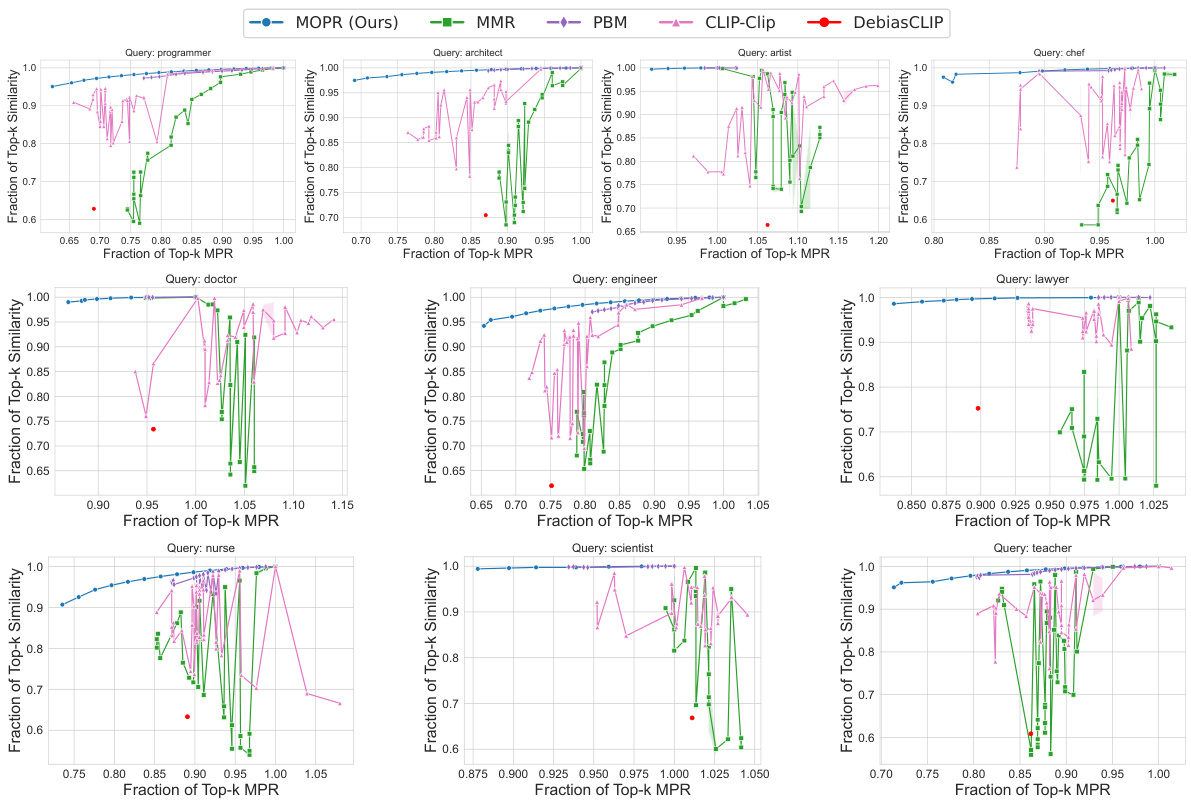
This figure compares the performance of MOPR against four baselines (MMR, PBM, CLIP-Clip, DebiasCLIP) across three datasets (CelebA, UTKFaces, Occupations). For each dataset, the plot shows the relationship between the fraction of top-k retrieved items achieving a certain level of similarity to the query and the fraction of top-k items achieving a certain level of Multi-group Proportional Representation (MPR). The results show that MOPR achieves higher MPR values while maintaining comparable similarity, demonstrating its Pareto dominance over the baselines.

This table presents the average percentage representation of different demographic groups in the top 50 retrieved items for three different retrieval methods: MOPR, k-NN, and MMR. The results are averaged over 10 different queries. The table highlights the ability of MOPR to balance representation across various intersectional groups (combinations of attributes like gender and race), while k-NN and MMR show disproportionate representation of some intersectional groups, indicated in red.
In-depth insights#
Multi-group Fairness#
Multi-group fairness tackles the inherent challenges of ensuring fairness across multiple intersecting demographic groups, moving beyond the limitations of single-attribute fairness. It acknowledges the complexities of intersectionality, where individuals belong to multiple overlapping groups, and emphasizes the need for fairness metrics and algorithms that consider these interwoven identities. Unlike single-group approaches that might inadvertently harm intersectional groups through ‘fairness gerrymandering’, multi-group fairness aims to mitigate biases and promote equitable representation for all groups, including historically marginalized ones. This requires careful consideration of both the attributes used to define groups and the choice of fairness metrics, as different metrics have varying strengths and weaknesses in addressing intersectional disparities. Developing and implementing effective multi-group fairness techniques remains a significant challenge that necessitates collaboration between researchers from multiple disciplines (social sciences, machine learning, etc.) to achieve truly fair and equitable systems.
MPR Metric#
The Multi-group Proportional Representation (MPR) metric is a crucial contribution to addressing representational harms in information retrieval. It moves beyond simpler metrics like equal or proportional representation by considering intersectional groups, defined by combinations of attributes. This is achieved by measuring the worst-case deviation between the average values of various representation statistics (defined by a function class C) computed over retrieved items, relative to a reference population (Q). MPR’s flexibility is a key advantage, allowing for the specification of complex intersectional groups beyond simple demographic categories and ensuring proportional representation across those nuanced groups. The metric’s robustness is enhanced by leveraging sample complexity bounds, facilitating accurate MPR estimation. The ability to compute MPR efficiently through methods like MSE minimization makes it practically applicable to large-scale retrieval systems. However, the choice of the reference distribution Q requires careful consideration, as any biases in Q will inevitably propagate to the resulting MPR values, highlighting the importance of a representative, carefully curated dataset. Therefore, while MPR offers a significant advancement, its success relies on the thoughtful selection and use of a truly representative reference population.
MOPR Algorithm#
The Multi-group Optimized Proportional Retrieval (MOPR) algorithm is a cutting-plane method designed to address the challenge of retrieving items from a database while ensuring proportional representation across multiple intersectional groups. Its core innovation lies in balancing retrieval accuracy (similarity to a query) with the MPR metric, which measures the worst-case deviation in representation statistics across a potentially large class of functions defining intersectional groups. MOPR iteratively refines its retrieval by incorporating constraints based on the MPR metric, making it robust and theoretically grounded. The use of an oracle to find the most violating function is a key component, enabling efficient optimization for complex and diverse groups. The algorithm’s effectiveness is demonstrated through empirical evaluations, showing its ability to achieve better proportionality than baselines, often with minimal compromise in retrieval accuracy. A strength of MOPR is its ability to handle a rich class of intersectional groups, and to balance proportional representation with retrieval accuracy. However, the computational cost, the dependency on a curated dataset, and the need for a regression oracle present limitations. Future work could focus on improving scalability and exploring ways to construct unbiased curated datasets.
Retrieval Experiments#
In a hypothetical research paper section titled “Retrieval Experiments,” a robust evaluation of various retrieval methods would be crucial. This would likely involve a multifaceted approach, beginning with a clear definition of the datasets used. Dataset characteristics, such as size, diversity (across demographics and other relevant attributes), and potential biases, would be explicitly stated. The evaluation metrics themselves would be carefully chosen, going beyond simple accuracy metrics. Precision, recall, F1-score, and Normalized Discounted Cumulative Gain (NDCG) are examples of commonly used metrics that can reveal different aspects of retrieval effectiveness. Furthermore, the experiments should rigorously test the algorithms under different query types (e.g., simple keyword queries, complex natural language queries). The results would ideally be presented visually, using charts and graphs, alongside statistical significance measures to confirm the reliability of the findings. To provide a well-rounded evaluation, the experiments should compare the proposed method against established baselines, highlighting any advantages or disadvantages. A thorough discussion of these results, explaining discrepancies and limitations, would conclude the section, providing the readers with a comprehensive understanding of the experiment’s strengths and weaknesses. The emphasis must be on providing a rigorous and transparent process, allowing other researchers to easily reproduce the experiments and validate the results.
Ethical Concerns#
Ethical considerations in using AI for image retrieval are multifaceted and demand careful attention. Bias amplification, where existing societal biases are magnified by algorithms, is a primary concern. The risk of perpetuating harmful stereotypes and marginalizing underrepresented groups is significant, demanding rigorous scrutiny of training data and model outputs. Fairness considerations must extend beyond simple demographic metrics to encompass intersectionality, acknowledging the unique experiences of individuals belonging to multiple overlapping groups. Transparency and accountability are crucial, requiring clear explanations of algorithmic choices, potential biases, and impact on various communities. Data privacy and protection against misuse of personal information are vital; methods must be designed to minimize risks and uphold ethical standards. Furthermore, the potential for unintentional harm caused by algorithmic errors or misinterpretations needs careful analysis and mitigating strategies. Ultimately, a human-centered approach is essential, ensuring that the system’s design and deployment align with societal values and benefit everyone equitably.
More visual insights#
More on figures

This figure compares the performance of three different optimization approaches for retrieving the top-k most similar items while satisfying an MPR constraint. The ‘LP’ line represents solving a linear program relaxation of the original integer program. The ‘LP Top-k’ line shows the result of rounding the solution of the linear program by selecting only the top-k items. The ‘IP’ line shows the results obtained from solving the original integer program. The graph demonstrates that the computationally expensive integer program and the simpler, rounded linear program achieve similar results, indicating that the computationally efficient approach of solving the linear program and rounding to the top-k items is a reasonable approximation for this problem.

This figure compares the performance of MOPR against four baseline methods (MMR, PBM, CLIP-Clip, DebiasCLIP) in terms of both retrieval accuracy (cosine similarity) and fairness (MPR). The x-axis represents the fraction of Top-k items that satisfy the MPR constraint, while the y-axis represents the fraction of Top-k items that maintain a high similarity score to the query. The results are shown for three different datasets: CelebA, UTKFaces, and Occupations. The plots demonstrate that MOPR achieves a better balance between accuracy and fairness compared to the baseline methods, and it often significantly improves the MPR while maintaining good accuracy.

This figure compares the performance of MOPR against four baseline methods in terms of both retrieval accuracy (cosine similarity) and fairness (MPR). The results are shown for three different datasets (CelebA, UTKFaces, Occupations) and averaged over 10 queries. The normalization ensures that a perfect retrieval with perfect representation would appear at the (1,1) point on the graph. The figure demonstrates that MOPR achieves significantly better MPR than the baselines without compromising much on retrieval accuracy, showing a Pareto improvement.
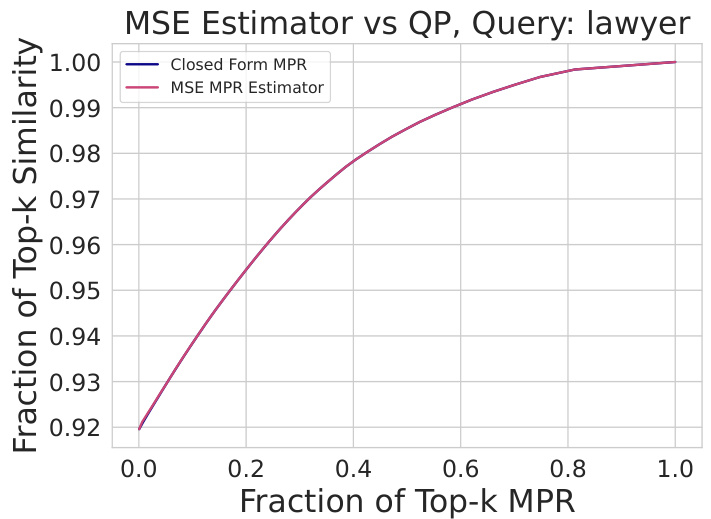
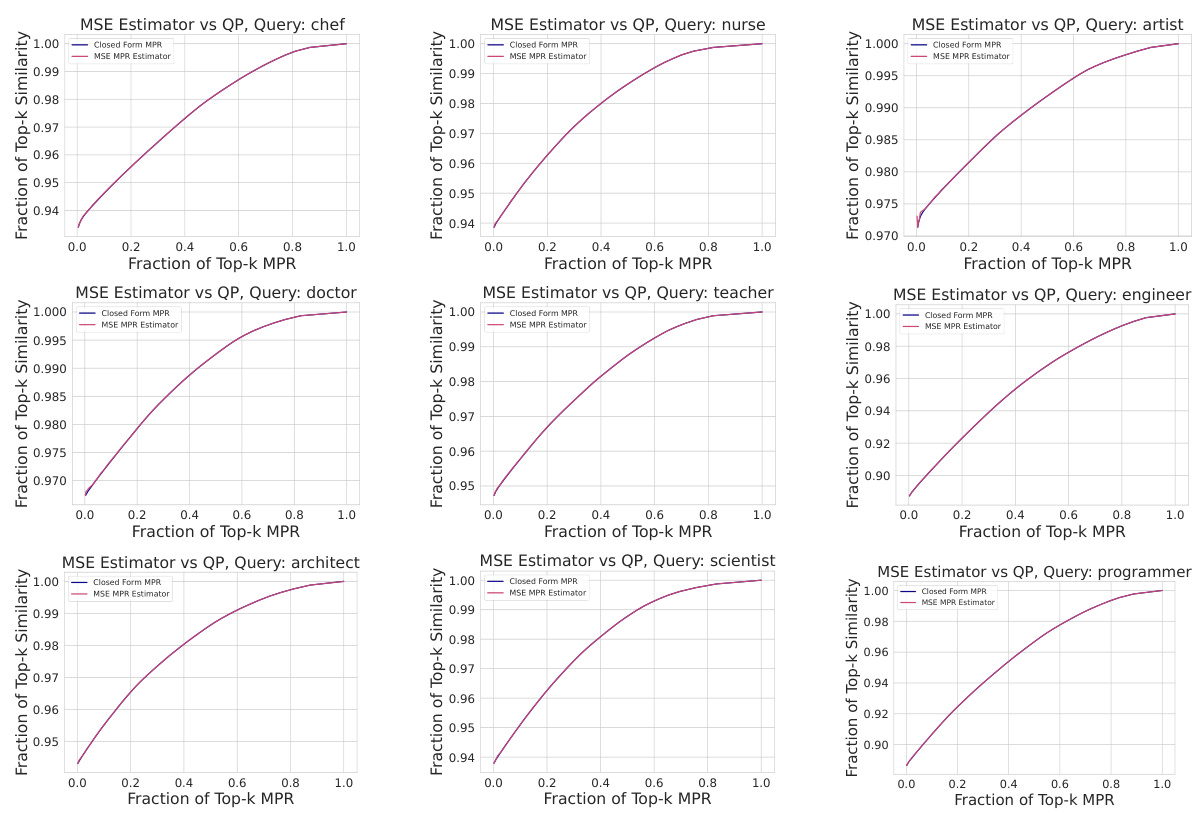
This figure compares the closed-form calculation of the Multi-group Proportional Representation (MPR) metric with the mean squared error (MSE) approximation. It shows that for the class of linear models, the MSE estimator accurately matches the closed-form solution for MPR, validating the effectiveness of the approximation.

This figure shows the comparison of MOPR with other baseline methods in terms of Top-k cosine similarity and Top-k MPR. The results are averaged over 10 queries with 50 retrieved items for each query. The x-axis represents the fraction of Top-k MPR, and the y-axis represents the fraction of Top-k cosine similarity. The three subfigures display the results for three different datasets: CelebA, UTKFaces, and Occupations. The values are normalized such that the point (1,1) represents perfect MPR and similarity. As can be seen from the figure, MOPR consistently outperforms the baselines, achieving a significantly better balance between retrieval accuracy and proportional representation across different intersectional groups.
This figure shows the comparison of MOPR with other baselines on three different datasets (CelebA, UTKFaces, Occupations) in terms of Top-k cosine similarity and Top-k MPR. The x-axis represents the fraction of Top-k MPR, and the y-axis represents the fraction of Top-k cosine similarity. The results show that MOPR outperforms the baselines by achieving a higher fraction of Top-k similarity while maintaining a lower fraction of Top-k MPR. The normalization ensures that the ideal point (1,1) represents both perfect MPR and maximum similarity.

This figure shows the tradeoff between retrieval accuracy (cosine similarity) and Multi-group Proportional Representation (MPR) for three different datasets (CelebA, UTKFaces, Occupations). Each plot compares MOPR to several baseline methods. The x-axis represents the fraction of Top-k MPR, and the y-axis represents the fraction of Top-k cosine similarity. MOPR consistently outperforms the baselines, achieving higher similarity while simultaneously improving MPR. The normalization to (1,1) allows for easier comparison of performance across different datasets and methods.

This figure compares the performance of MOPR against other baseline methods in terms of top-k cosine similarity and top-k MPR. The x-axis represents the fraction of top-k MPR, while the y-axis represents the fraction of top-k cosine similarity. The results are shown for three different datasets: CelebA, UTKFaces, and Occupations. The figure demonstrates that MOPR outperforms the baselines by achieving higher similarity while simultaneously reducing the MPR gap.
This figure shows the trade-off between retrieval accuracy (cosine similarity) and Multi-group Proportional Representation (MPR) for three different datasets (CelebA, UTKFaces, Occupations). Each plot compares MOPR to other baseline methods. The x-axis represents the fraction of Top-k items satisfying the MPR constraint, and the y-axis represents the fraction of Top-k items with high similarity to the query. The results demonstrate that MOPR achieves a better balance between representation and accuracy than the other methods, often achieving higher accuracy with similar or better representation.
This figure compares the performance of MOPR against four baselines (MMR, PBM, CLIP-Clip, DebiasCLIP) across three datasets (CelebA, UTKFaces, Occupations) using cosine similarity and MPR as evaluation metrics. The x-axis represents the fraction of Top-k items achieving the target MPR, and the y-axis shows the fraction of Top-k items maintaining a certain level of cosine similarity to the query. The plot demonstrates that MOPR consistently outperforms the baselines by achieving higher similarity while significantly reducing the MPR gap, showcasing its effectiveness in promoting proportional representation across intersectional groups.
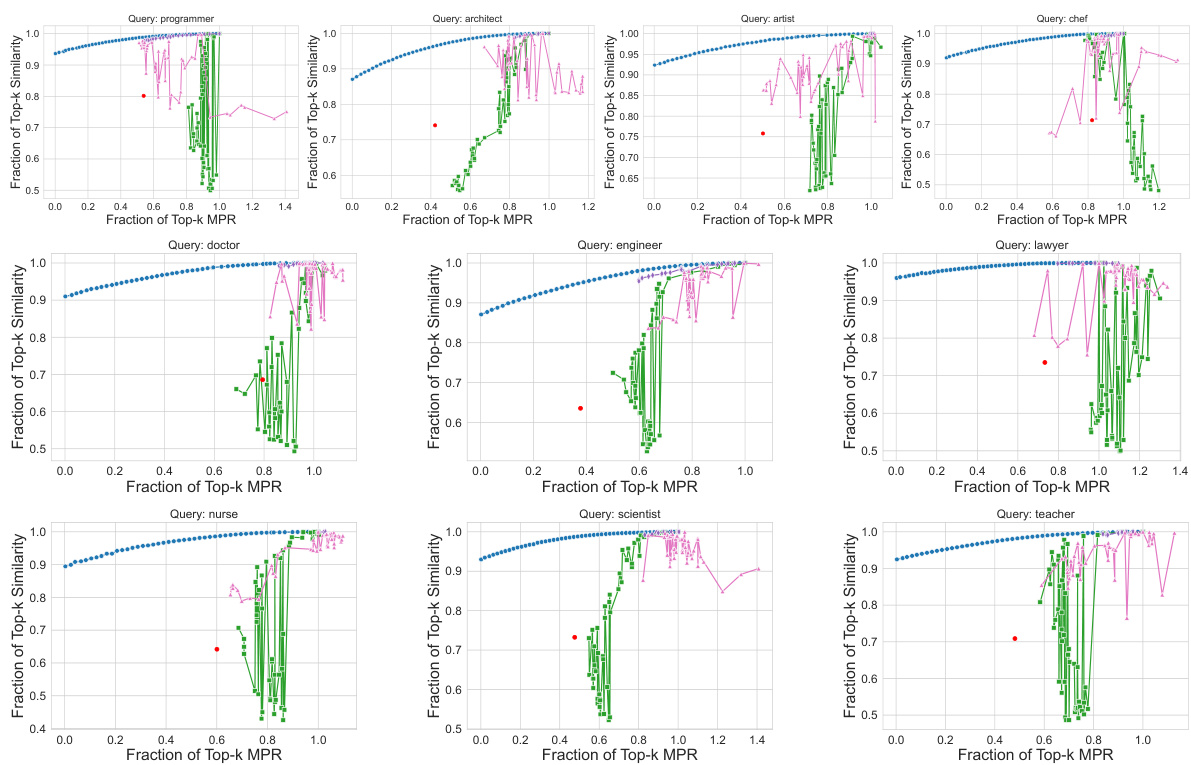
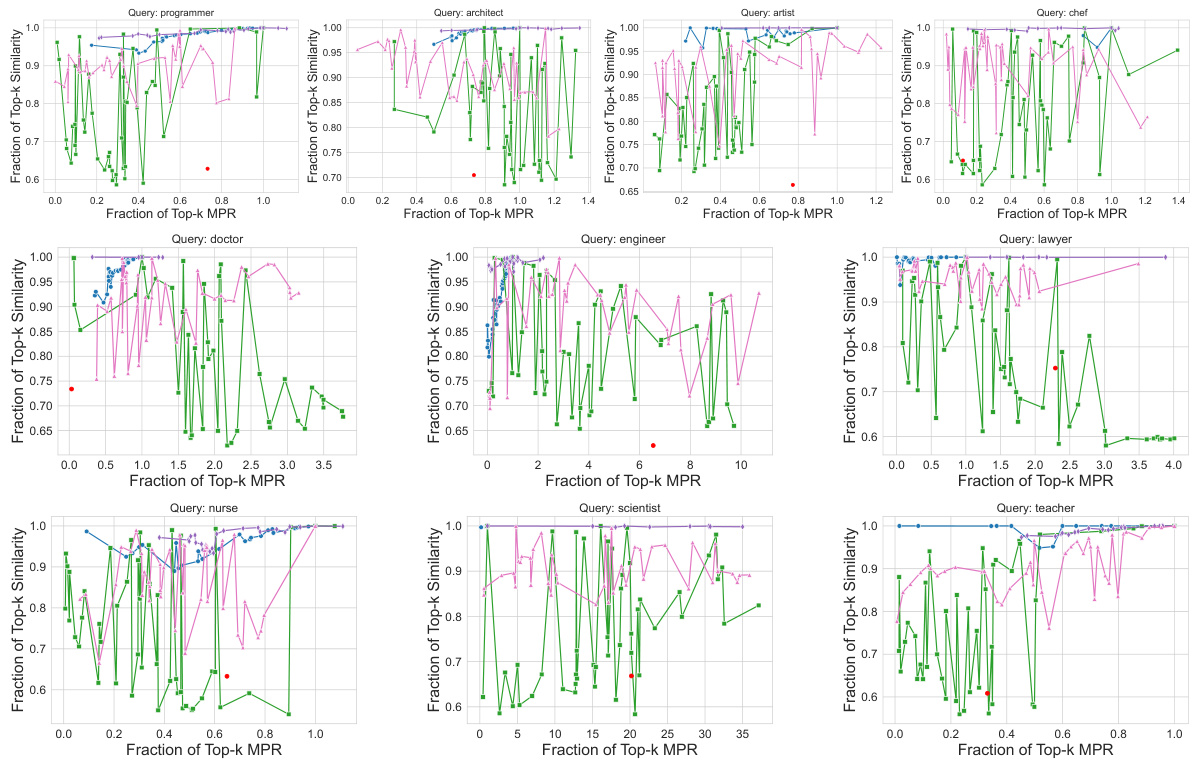
This figure compares the performance of MOPR against other methods on three different datasets (CelebA, UTKFaces, and Occupations). The x-axis represents the fraction of top-k retrieved items achieving the Multi-group Proportional Representation (MPR) target, while the y-axis shows the fraction of top-k items maintaining a high cosine similarity with the query. The plots demonstrate that MOPR consistently outperforms other methods by achieving a higher fraction of top-k items satisfying the MPR constraint with minimal compromise to similarity.
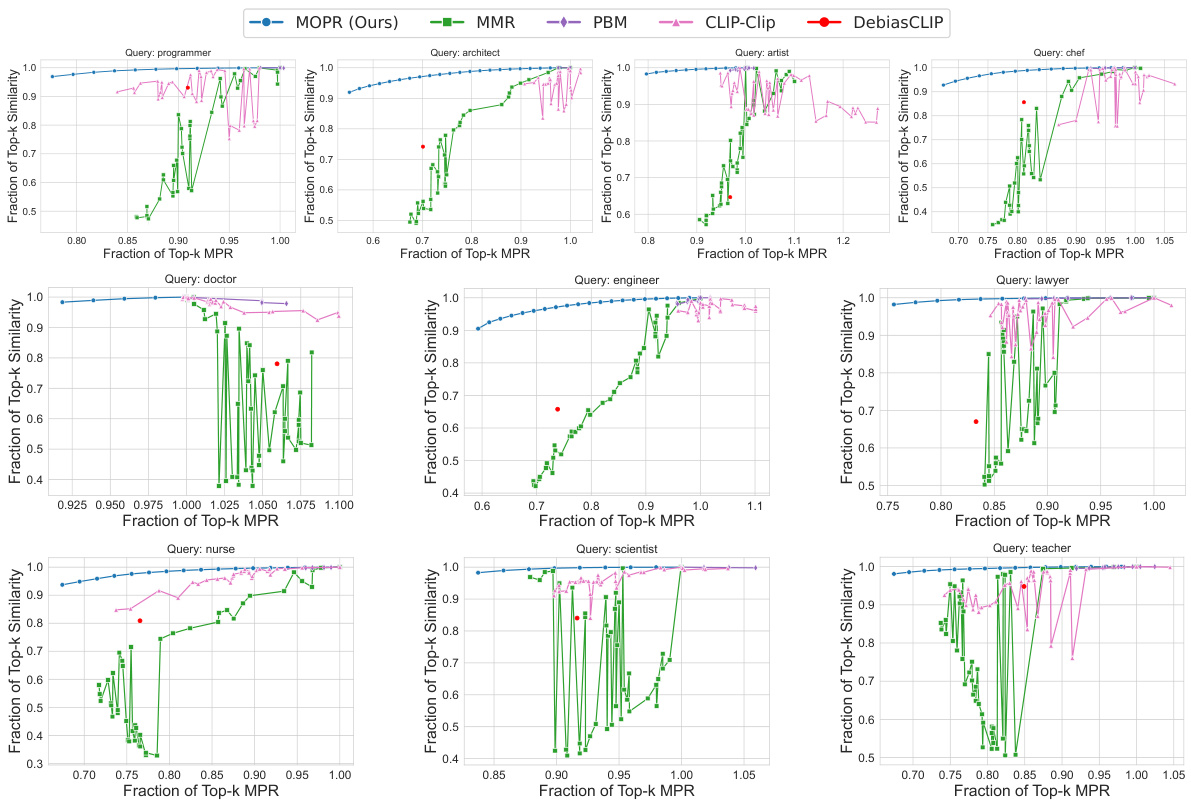
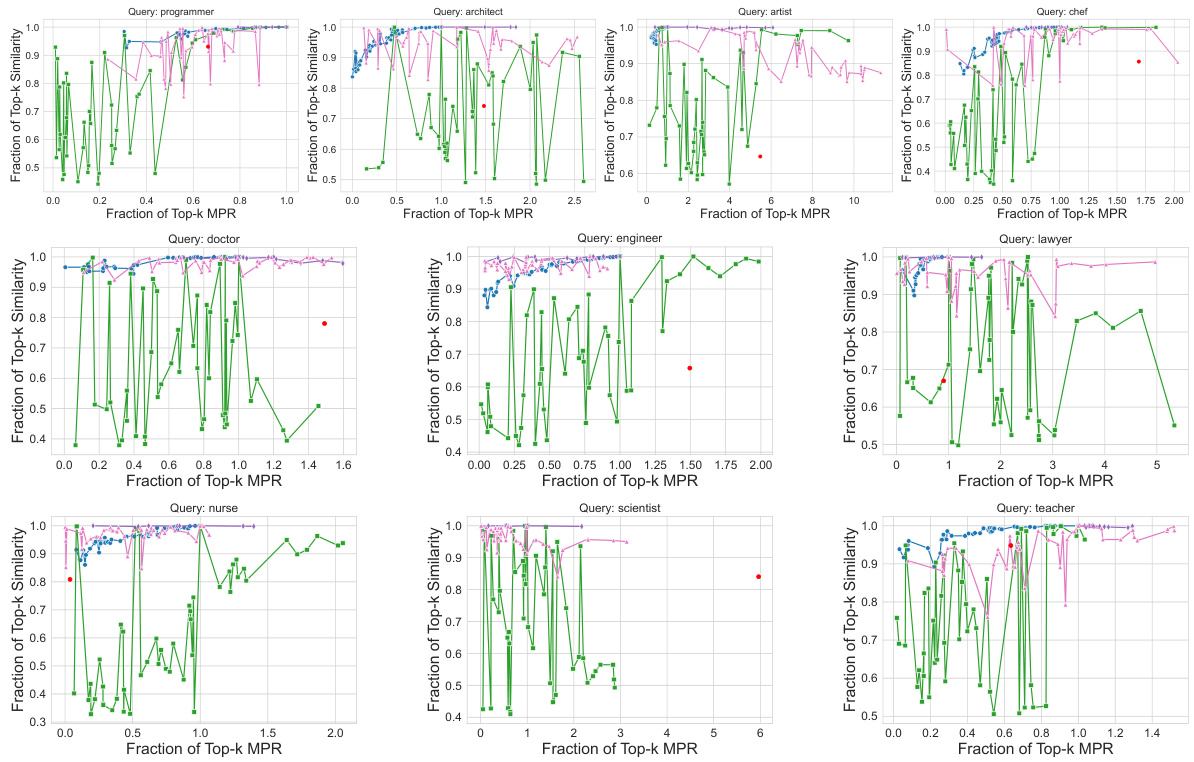
This figure shows the performance of MOPR against four baselines (MMR, PBM, CLIP-Clip, DebiasCLIP) across three different datasets (CelebA, UTKFaces, Occupations). For each dataset, the x-axis represents the fraction of Top-k items that satisfy the Multi-group Proportional Representation (MPR) constraint, and the y-axis represents the fraction of Top-k items that maintain high similarity to the query. The results show that MOPR outperforms the baselines by achieving a higher fraction of Top-k items with high similarity while simultaneously satisfying a higher fraction of the MPR constraint. The normalization ensures the ideal scenario (perfect similarity and perfect MPR) is represented as the point (1,1).
This figure compares the performance of MOPR against four baseline methods (MMR, PBM, CLIP-Clip, DebiasCLIP) across three different datasets (CelebA, UTKFaces, Occupations) for image retrieval. The x-axis represents the fraction of Top-k items retrieved that satisfy the Multi-group Proportional Representation (MPR) constraint, while the y-axis shows the fraction of Top-k items that maintain high cosine similarity with the query. The plots demonstrate that MOPR outperforms the baselines by achieving a better balance between achieving high similarity and satisfying the MPR constraint. Values are normalized to ensure easy comparison.

This figure compares the performance of MOPR against four baseline methods in terms of the trade-off between retrieval similarity and Multi-group Proportional Representation (MPR). The x-axis represents the fraction of Top-k items that satisfy the MPR constraint, and the y-axis shows the fraction of Top-k items that have high similarity to the query. Results are shown for three different datasets: CelebA, UTKFaces, and Occupations. The results indicate that MOPR achieves higher similarity while simultaneously satisfying a given MPR constraint compared to the other baselines.
This figure shows the trade-off between retrieval accuracy (cosine similarity) and the Multi-group Proportional Representation (MPR) metric for three different datasets: CelebA, UTKFaces, and Occupations. Each plot compares the performance of MOPR against several baseline methods. The x-axis represents the fraction of Top-k items achieving the desired MPR, and the y-axis represents the fraction of Top-k items achieving the desired cosine similarity to the query. The results show that MOPR outperforms the baselines, achieving a better balance between similarity and representation.

This figure shows the performance of MOPR and several baseline methods in balancing retrieval accuracy and multi-group proportional representation (MPR) across three image datasets: CelebA, UTKFaces, and Occupations. Each plot shows the tradeoff between average cosine similarity (x-axis) and the fraction of Top-k items satisfying the MPR constraint (y-axis) for k=50 items retrieved. MOPR consistently outperforms the baseline methods by achieving higher MPR with comparable or better similarity.
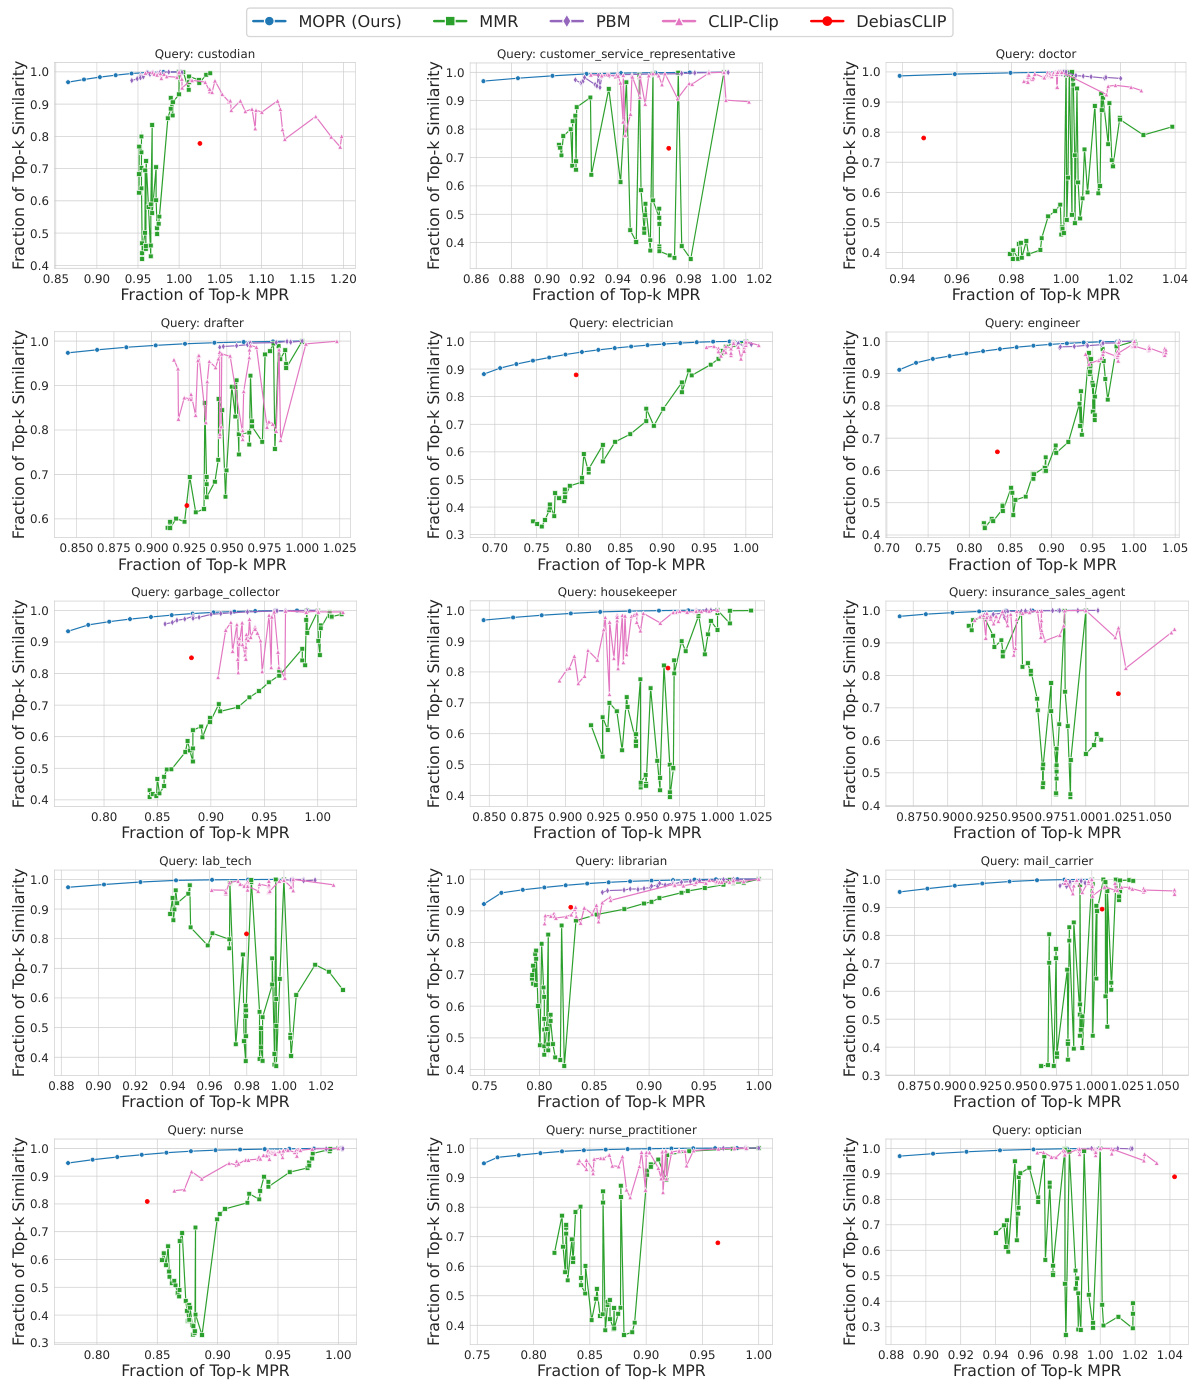
This figure shows the trade-off between retrieval accuracy (cosine similarity) and Multi-group Proportional Representation (MPR) for three different datasets (CelebA, UTKFaces, Occupations). Each point represents the average performance across 10 queries, retrieving the top 50 results (k=50). The x-axis shows the fraction of Top-k items that satisfy the MPR constraint, while the y-axis shows the fraction of Top-k items that have high cosine similarity to the query. The lines represent different retrieval methods, with MOPR consistently outperforming existing baselines by achieving higher similarity while maintaining a proportionally representative selection of items.

This figure shows the trade-off between retrieval accuracy (cosine similarity) and Multi-group Proportional Representation (MPR) for three different datasets (CelebA, UTKFaces, Occupations). Each plot compares MOPR to several baseline methods. The x-axis represents the fraction of Top-k items that satisfy the MPR constraint, and the y-axis represents the fraction of Top-k items that maintain high similarity to the query. MOPR consistently outperforms baseline methods by achieving a better balance between MPR and similarity, often dominating the baselines according to the Pareto dominance criterion.
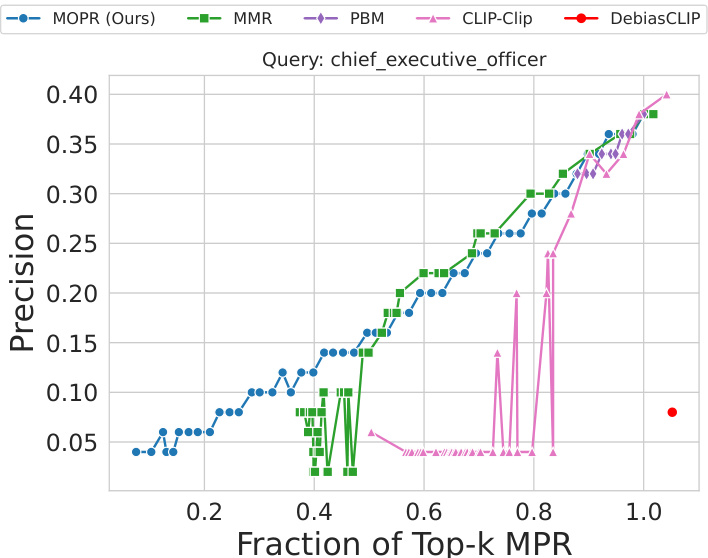
This figure shows the precision-MPR curve for the Occupations dataset using linear regression. It compares the performance of different retrieval methods (MOPR, MMR, PBM, CLIP-Clip, DebiasCLIP) when retrieving the top 50 most similar items for the query ‘A photo of a chief executive officer.’ The x-axis represents the fraction of top-k MPR (Multi-Group Proportional Representation), and the y-axis represents the precision. The plot demonstrates that even when aiming for a low MPR, the proposed MOPR method achieves competitive precision compared to other baselines.
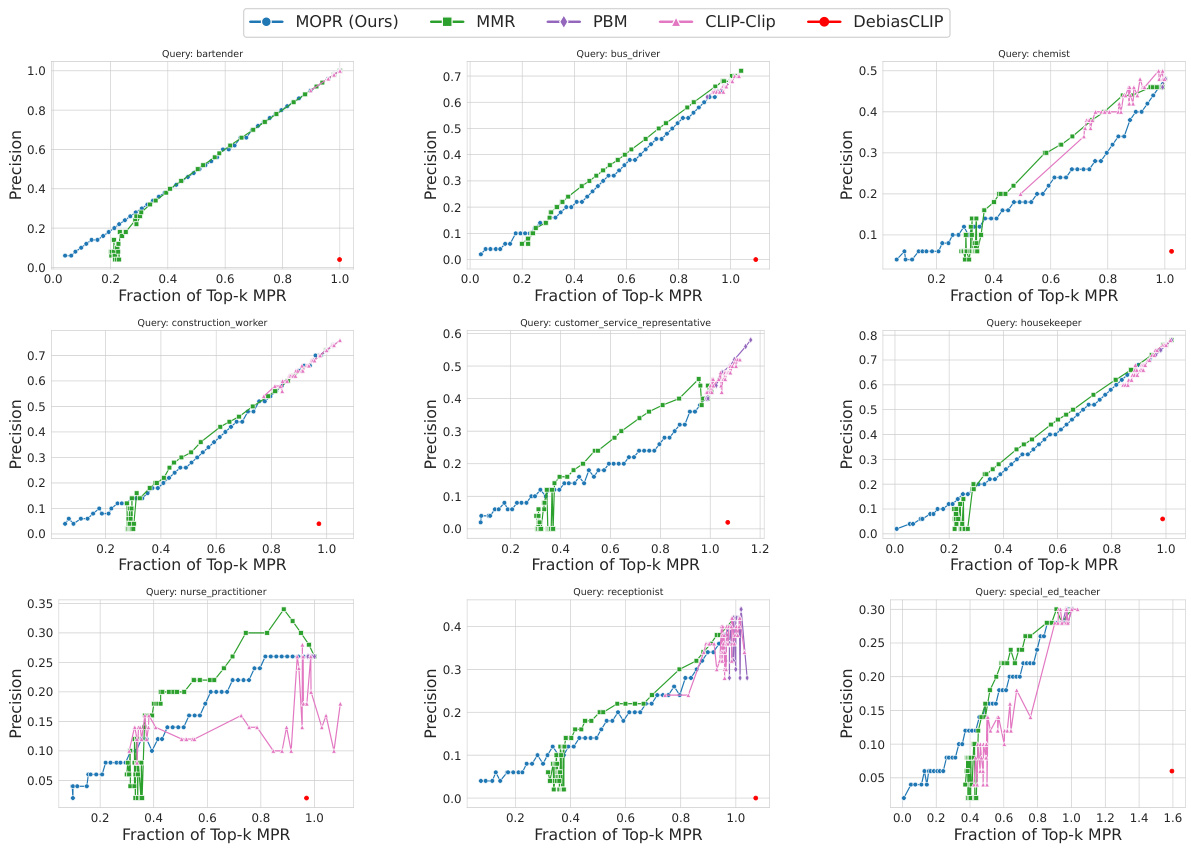
This figure compares the performance of MOPR against several baseline methods for three different datasets: CelebA, UTKFaces, and Occupations. The x-axis represents the fraction of Top-k items retrieved that satisfy the Multi-group Proportional Representation (MPR) constraint, while the y-axis shows the fraction of Top-k items with high cosine similarity to the query. The plots demonstrate that MOPR achieves a better balance between MPR and similarity, outperforming the baselines in closing the MPR gap. Each dataset’s results are shown in a separate subplot.

This figure compares the performance of MOPR against four baselines (MMR, PBM, CLIP-Clip, DebiasCLIP) across three image datasets (CelebA, UTKFaces, Occupations) in terms of both retrieval similarity and Multi-group Proportional Representation (MPR). Each plot shows the fraction of top-k items that achieve a certain level of similarity versus the fraction of top-k items that achieve a certain level of MPR. The results demonstrate that MOPR consistently outperforms the baselines, achieving higher similarity while significantly reducing the MPR gap.

This figure shows the trade-off between retrieval accuracy (cosine similarity) and Multi-group Proportional Representation (MPR) for three different datasets (CelebA, UTKFaces, and Occupations). The x-axis represents the fraction of Top-k items that satisfy the MPR constraint, while the y-axis represents the fraction of Top-k items with high cosine similarity to the query. Each line represents a different retrieval method. The results demonstrate that MOPR outperforms other methods by achieving higher similarity while maintaining a much smaller MPR gap (difference between desired and achieved proportional representation).

This figure compares different retrieval methods’ performance in terms of both similarity to the query and proportional representation (MPR) across intersectional groups. The x-axis shows the fraction of top-k retrieved items achieving the target MPR, while the y-axis represents the fraction of top-k items with high similarity scores to the query. The three subplots show the results for three different datasets: CelebA, UTKFaces, and Occupations. MOPR (the proposed method) consistently outperforms existing methods, achieving better MPR with comparable or higher similarity.

This figure displays the results of comparing the proposed Multi-group Optimized Proportional Retrieval (MOPR) algorithm against four baseline methods (MMR, PBM, CLIP-Clip, and DebiasCLIP) across three different datasets (CelebA, UTKFaces, and Occupations). The x-axis represents the fraction of Top-k Multi-group Proportional Representation (MPR), while the y-axis shows the fraction of Top-k cosine similarity. The plots illustrate that MOPR outperforms other methods, achieving a significantly smaller MPR gap (difference between achieved MPR and desired MPR) while maintaining high similarity scores. The normalization to the point (1,1) allows for a direct comparison of the methods’ performance in balancing MPR and similarity. The Pareto-dominance of MOPR indicates that it offers superior performance.

This figure compares the performance of MOPR against other baseline methods in terms of both retrieval similarity and MPR. The x-axis represents the fraction of top-k items retrieved that satisfy the Multi-group Proportional Representation (MPR) constraint, while the y-axis represents the fraction of top-k items having high similarity to the query. The plots show the results for three different datasets (CelebA, UTKFaces, and Occupations). The results demonstrate that MOPR achieves better MPR with minimal compromise on retrieval accuracy, outperforming other methods.

This figure compares the performance of MOPR against four baseline methods across three different datasets (CelebA, UTKFaces, and Occupations) in terms of top-k cosine similarity and top-k MPR. The x-axis represents the fraction of Top-k MPR, while the y-axis represents the fraction of Top-k cosine similarity. Each dataset is shown in a separate subplot. The results demonstrate that MOPR outperforms the baselines, achieving higher similarity while simultaneously reducing the MPR gap (the difference between the representation statistics of retrieved items and the target population).
This figure compares the performance of MOPR against other baseline methods across three different datasets (CelebA, UTKFaces, and Occupations). The x-axis represents the fraction of top-k items retrieved that satisfy the Multi-group Proportional Representation (MPR) constraint. The y-axis shows the fraction of top-k items with high cosine similarity to the query. Each plot shows the results for a specific dataset. The results demonstrate that MOPR outperforms the other methods by achieving a higher MPR (more proportional representation) while maintaining comparable or better similarity to the query.

This figure shows the comparison between the fraction of top-k cosine similarity and the fraction of top-k MPR for three different datasets (CelebA, UTKFaces, and Occupations). The results are averaged over 10 queries, with k=50 images retrieved for each query. The values are normalized such that the point (1,1) represents perfect similarity and MPR. The figure demonstrates that the proposed method (MOPR) outperforms other baselines by achieving significantly closer MPR values to the ideal while maintaining high similarity.

This figure shows the performance comparison of MOPR against several baselines across three different datasets (CelebA, UTKFaces, and Occupations). For each dataset, the x-axis represents the fraction of the top-k retrieved images achieving the Multi-group Proportional Representation (MPR) target, while the y-axis shows the fraction of the top-k images maintaining a certain level of similarity to the query. The normalization ensures that perfect MPR and similarity is represented by (1,1). The results demonstrate that MOPR outperforms the baselines by achieving better MPR (more proportional representation) while maintaining comparable similarity to the query.

This figure shows the trade-off between retrieval accuracy (cosine similarity) and Multi-group Proportional Representation (MPR) for three different datasets (CelebA, UTKFaces, and Occupations). Each plot shows the fraction of top-k items that satisfy a given MPR threshold against their average cosine similarity to the query. The results demonstrate that MOPR achieves better representation across multiple intersectional groups compared to existing methods (MMR, PBM, CLIP-Clip, and DebiasCLIP) while maintaining comparable retrieval accuracy.

This figure compares the performance of MOPR against four baseline methods (MMR, PBM, CLIP-Clip, DebiasCLIP) across three different datasets (CelebA, UTKFaces, Occupations) for image retrieval. The x-axis represents the fraction of top-k retrieved items satisfying the Multi-Group Proportional Representation (MPR) constraint, and the y-axis represents the fraction of top-k items with high cosine similarity to the query. The results show that MOPR outperforms the baselines by achieving higher similarity while simultaneously ensuring better proportional representation across multiple groups.
This figure shows the comparison between the fraction of top-k cosine similarity and the fraction of top-k multi-group proportional representation (MPR) for three different datasets: CelebA, UTKFaces, and Occupations. The x-axis represents the fraction of Top-k MPR, while the y-axis represents the fraction of Top-k cosine similarity. Each line represents a different retrieval method: MOPR, MMR, PBM, CLIP-clip, and DebiasCLIP. The results show that MOPR outperforms the other methods by achieving a higher fraction of Top-k cosine similarity while maintaining a lower fraction of Top-k MPR. This demonstrates that MOPR effectively balances retrieval accuracy and proportional representation across multiple intersectional groups.
More on tables

This table compares the performance of three retrieval methods (MOPR, k-NN, and MMR) on the UTKFace dataset in terms of their ability to achieve balanced representation across different demographic groups. The table shows the percentage representation of each group (male/female, different races) in the top 50 retrieved items for each of the methods, averaged over 10 queries. The results highlight MOPR’s superior ability to balance representation across intersectional groups, unlike the other methods which show imbalances, particularly for minority intersectional groups, indicated in red.

This table presents the average percentage representation of different demographic groups in the top 50 retrieved items for three different retrieval methods: MOPR, k-NN, and MMR, using the UTKFace dataset. The results are averaged over 10 queries. The table highlights that MOPR effectively balances representation across various demographic groups, whereas k-NN and MMR show significant disparities, particularly for intersectional groups (highlighted in red).

This table presents the average percentage representation of different demographic groups in the top 50 retrieved items for three different retrieval methods: MOPR, k-NN, and MMR. The UTKFace dataset was used, and the results are averaged over 10 queries. The table highlights MOPR’s ability to achieve a balanced representation across various intersectional groups, while k-NN and MMR methods demonstrate significant shortcomings in this regard, particularly with respect to intersectional groups that are under-represented (highlighted in red).
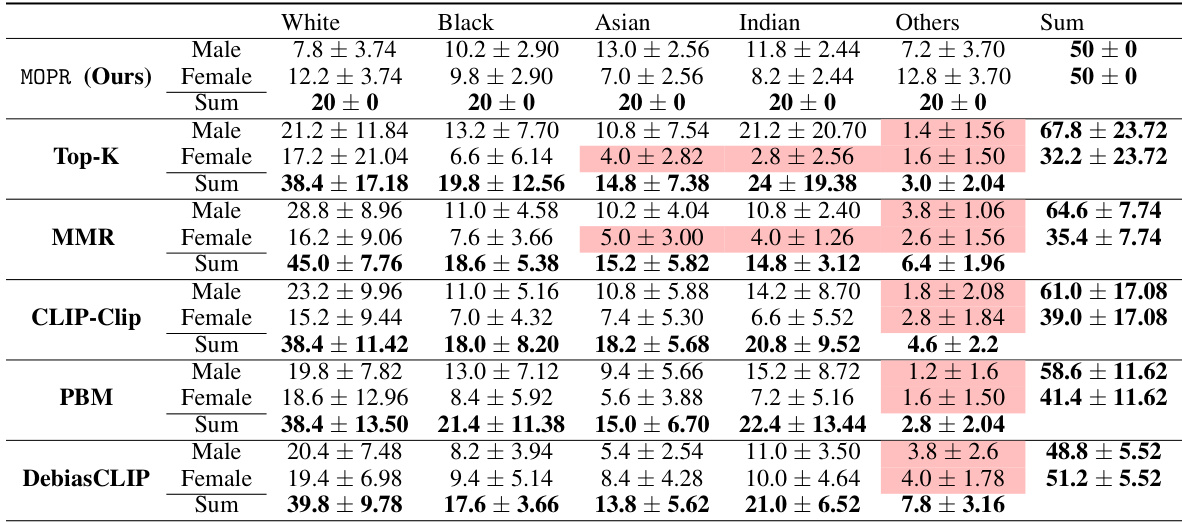
This table presents the average percentage representation of different demographic groups (male/female, white/black/Asian/Indian/others) in the top 50 retrieved items for three different retrieval methods: MOPR (the proposed method), k-NN (k-Nearest Neighbors), and MMR (Maximal Marginal Relevance). The results are averaged over 10 queries. The table highlights that MOPR achieves a more balanced representation across various intersectional groups compared to the other two methods, which tend to miss certain groups.
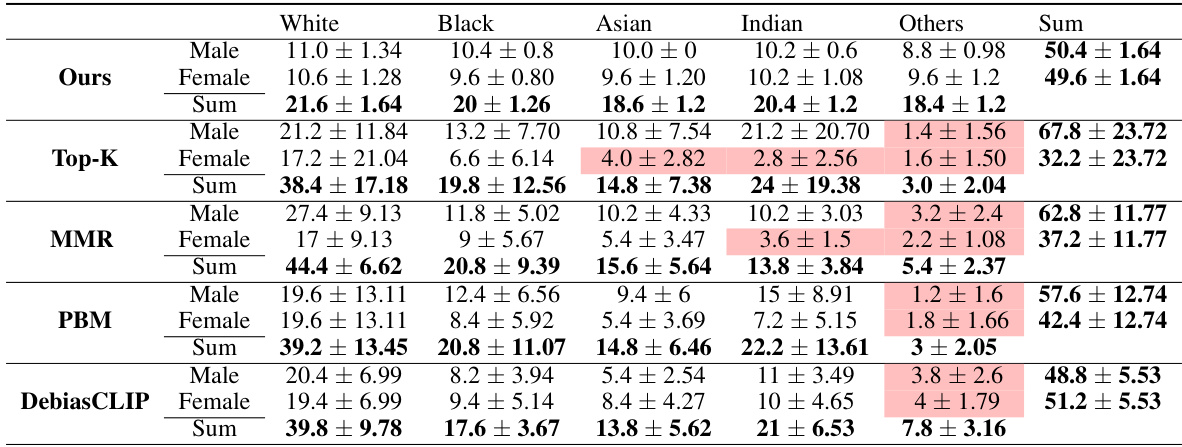
This table presents the average percentage representation of different demographic groups in the top 50 retrieved items for three different retrieval methods: MOPR, k-NN, and MMR. The UTKFace dataset [40] was used. The table shows that MOPR effectively balances representation across various demographic groups, while k-NN and MMR show a disproportionate representation of certain intersectional groups (highlighted in red). This demonstrates MOPR’s ability to improve fairness and inclusivity in retrieval systems.
Full paper#


