TL;DR#
Visual Place Recognition (VPR) is crucial for various applications, but existing methods like NetVLAD often suffer from high dimensionality and vulnerability to domain shifts. These issues hinder efficiency and real-world applicability, especially in resource-limited environments. The high-dimensional feature vectors also demand considerable memory and computational resources.
This paper introduces SuperVLAD, which tackles these challenges head-on. By removing cluster centers and using a small number of clusters, SuperVLAD produces compact and robust image descriptors that generalize well across diverse domains. Experimental results demonstrate its superior performance over existing methods on various benchmark datasets, showcasing its significant improvements in terms of both accuracy and efficiency. The creation of a very low-dimensional 1-Cluster VLAD further enhances the method’s practicality and impact.
Key Takeaways#
Why does it matter?#
This paper is crucial for researchers in visual place recognition (VPR) and related fields. It introduces SuperVLAD, a novel and efficient method that significantly improves upon existing techniques. The method’s focus on compactness and robustness makes it highly relevant to resource-constrained applications (like robotics) and scenarios with domain gaps. The findings pave the way for better VPR systems and open avenues for further research into compact yet effective feature representations.
Visual Insights#
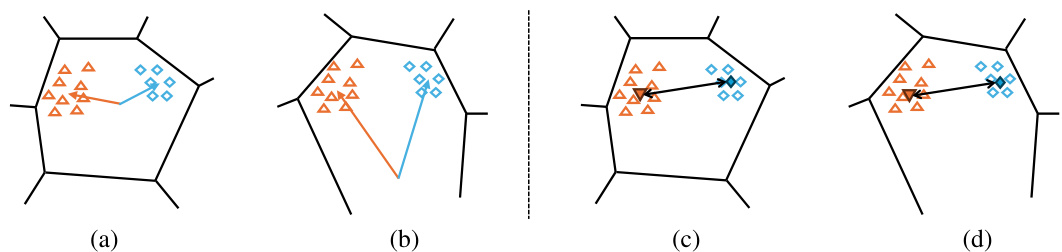
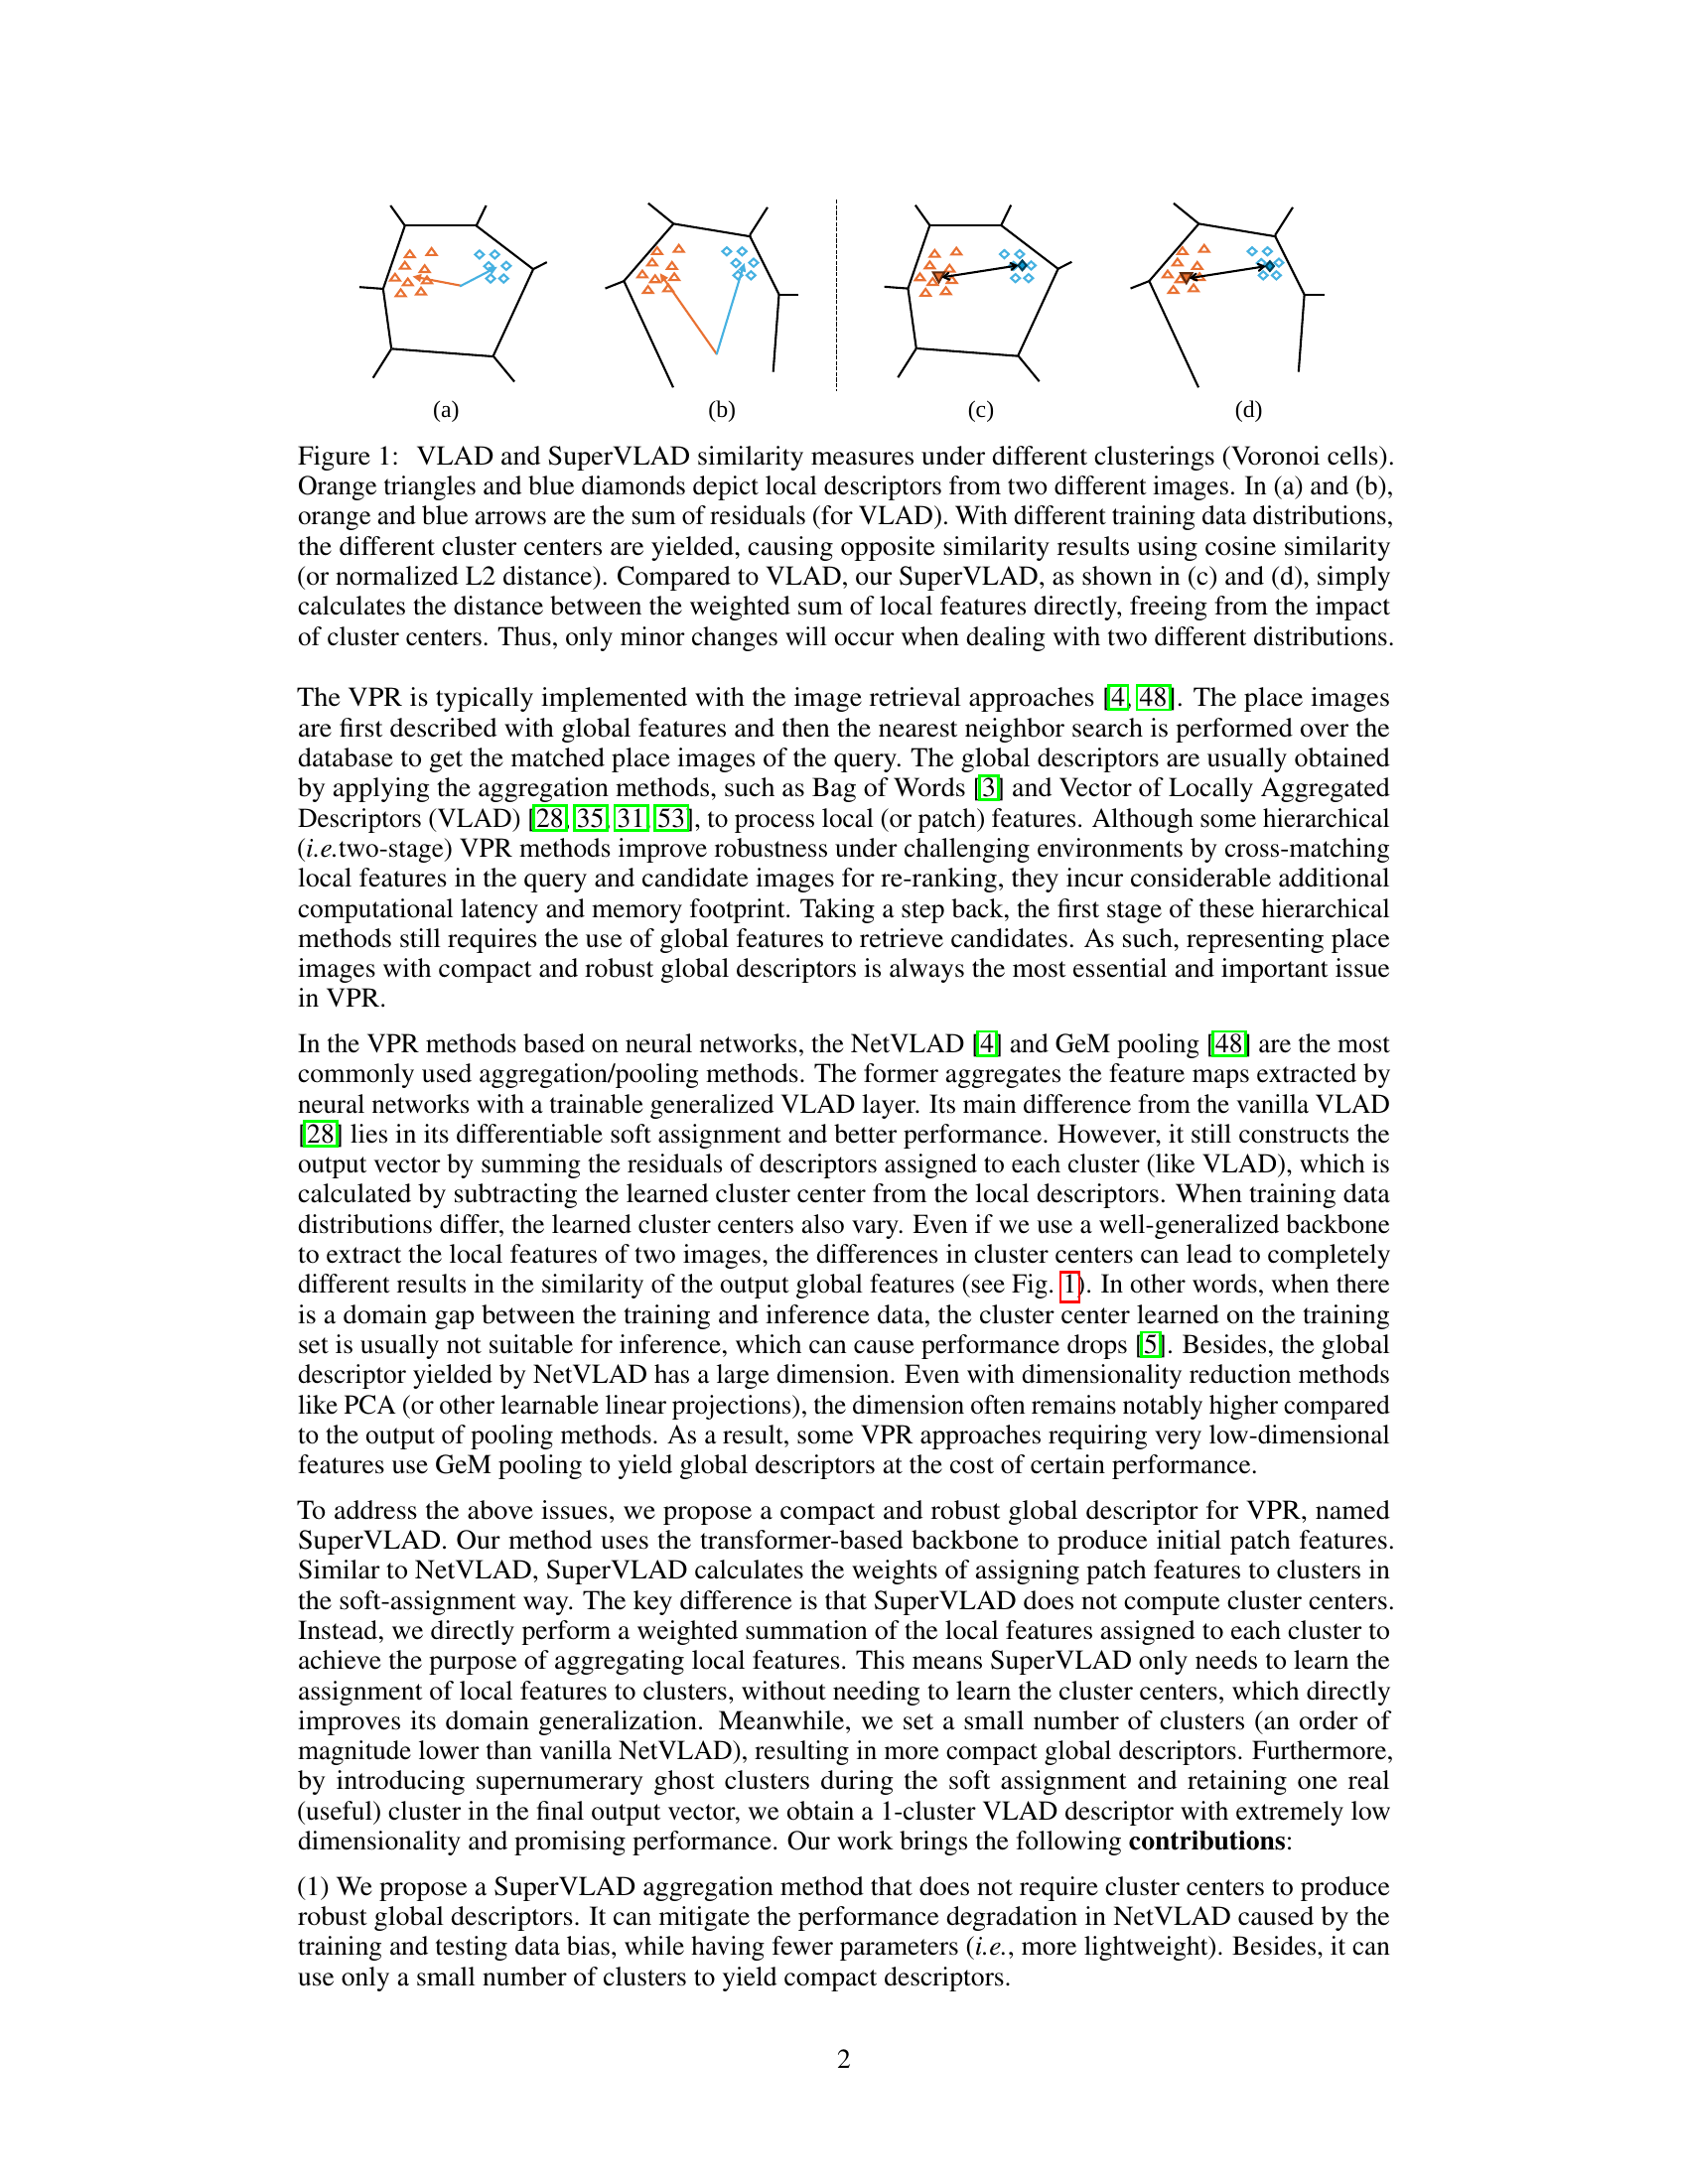
🔼 This figure illustrates the difference between VLAD and SuperVLAD in handling different training data distributions. VLAD, shown in (a) and (b), uses cluster centers to aggregate local features, resulting in sensitivity to data distribution changes. SuperVLAD, shown in (c) and (d), directly calculates the weighted sum of local features, making it more robust to these changes.
read the caption
Figure 1: VLAD and SuperVLAD similarity measures under different clusterings (Voronoi cells). Orange triangles and blue diamonds depict local descriptors from two different images. In (a) and (b), orange and blue arrows are the sum of residuals (for VLAD). With different training data distributions, the different cluster centers are yielded, causing opposite similarity results using cosine similarity (or normalized L2 distance). Compared to VLAD, our SuperVLAD, as shown in (c) and (d), simply calculates the distance between the weighted sum of local features directly, freeing from the impact of cluster centers. Thus, only minor changes will occur when dealing with two different distributions.
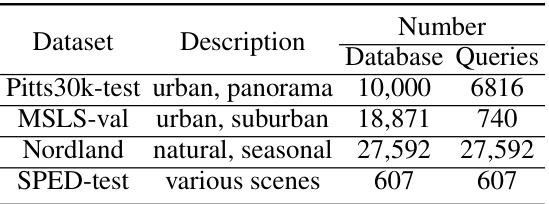
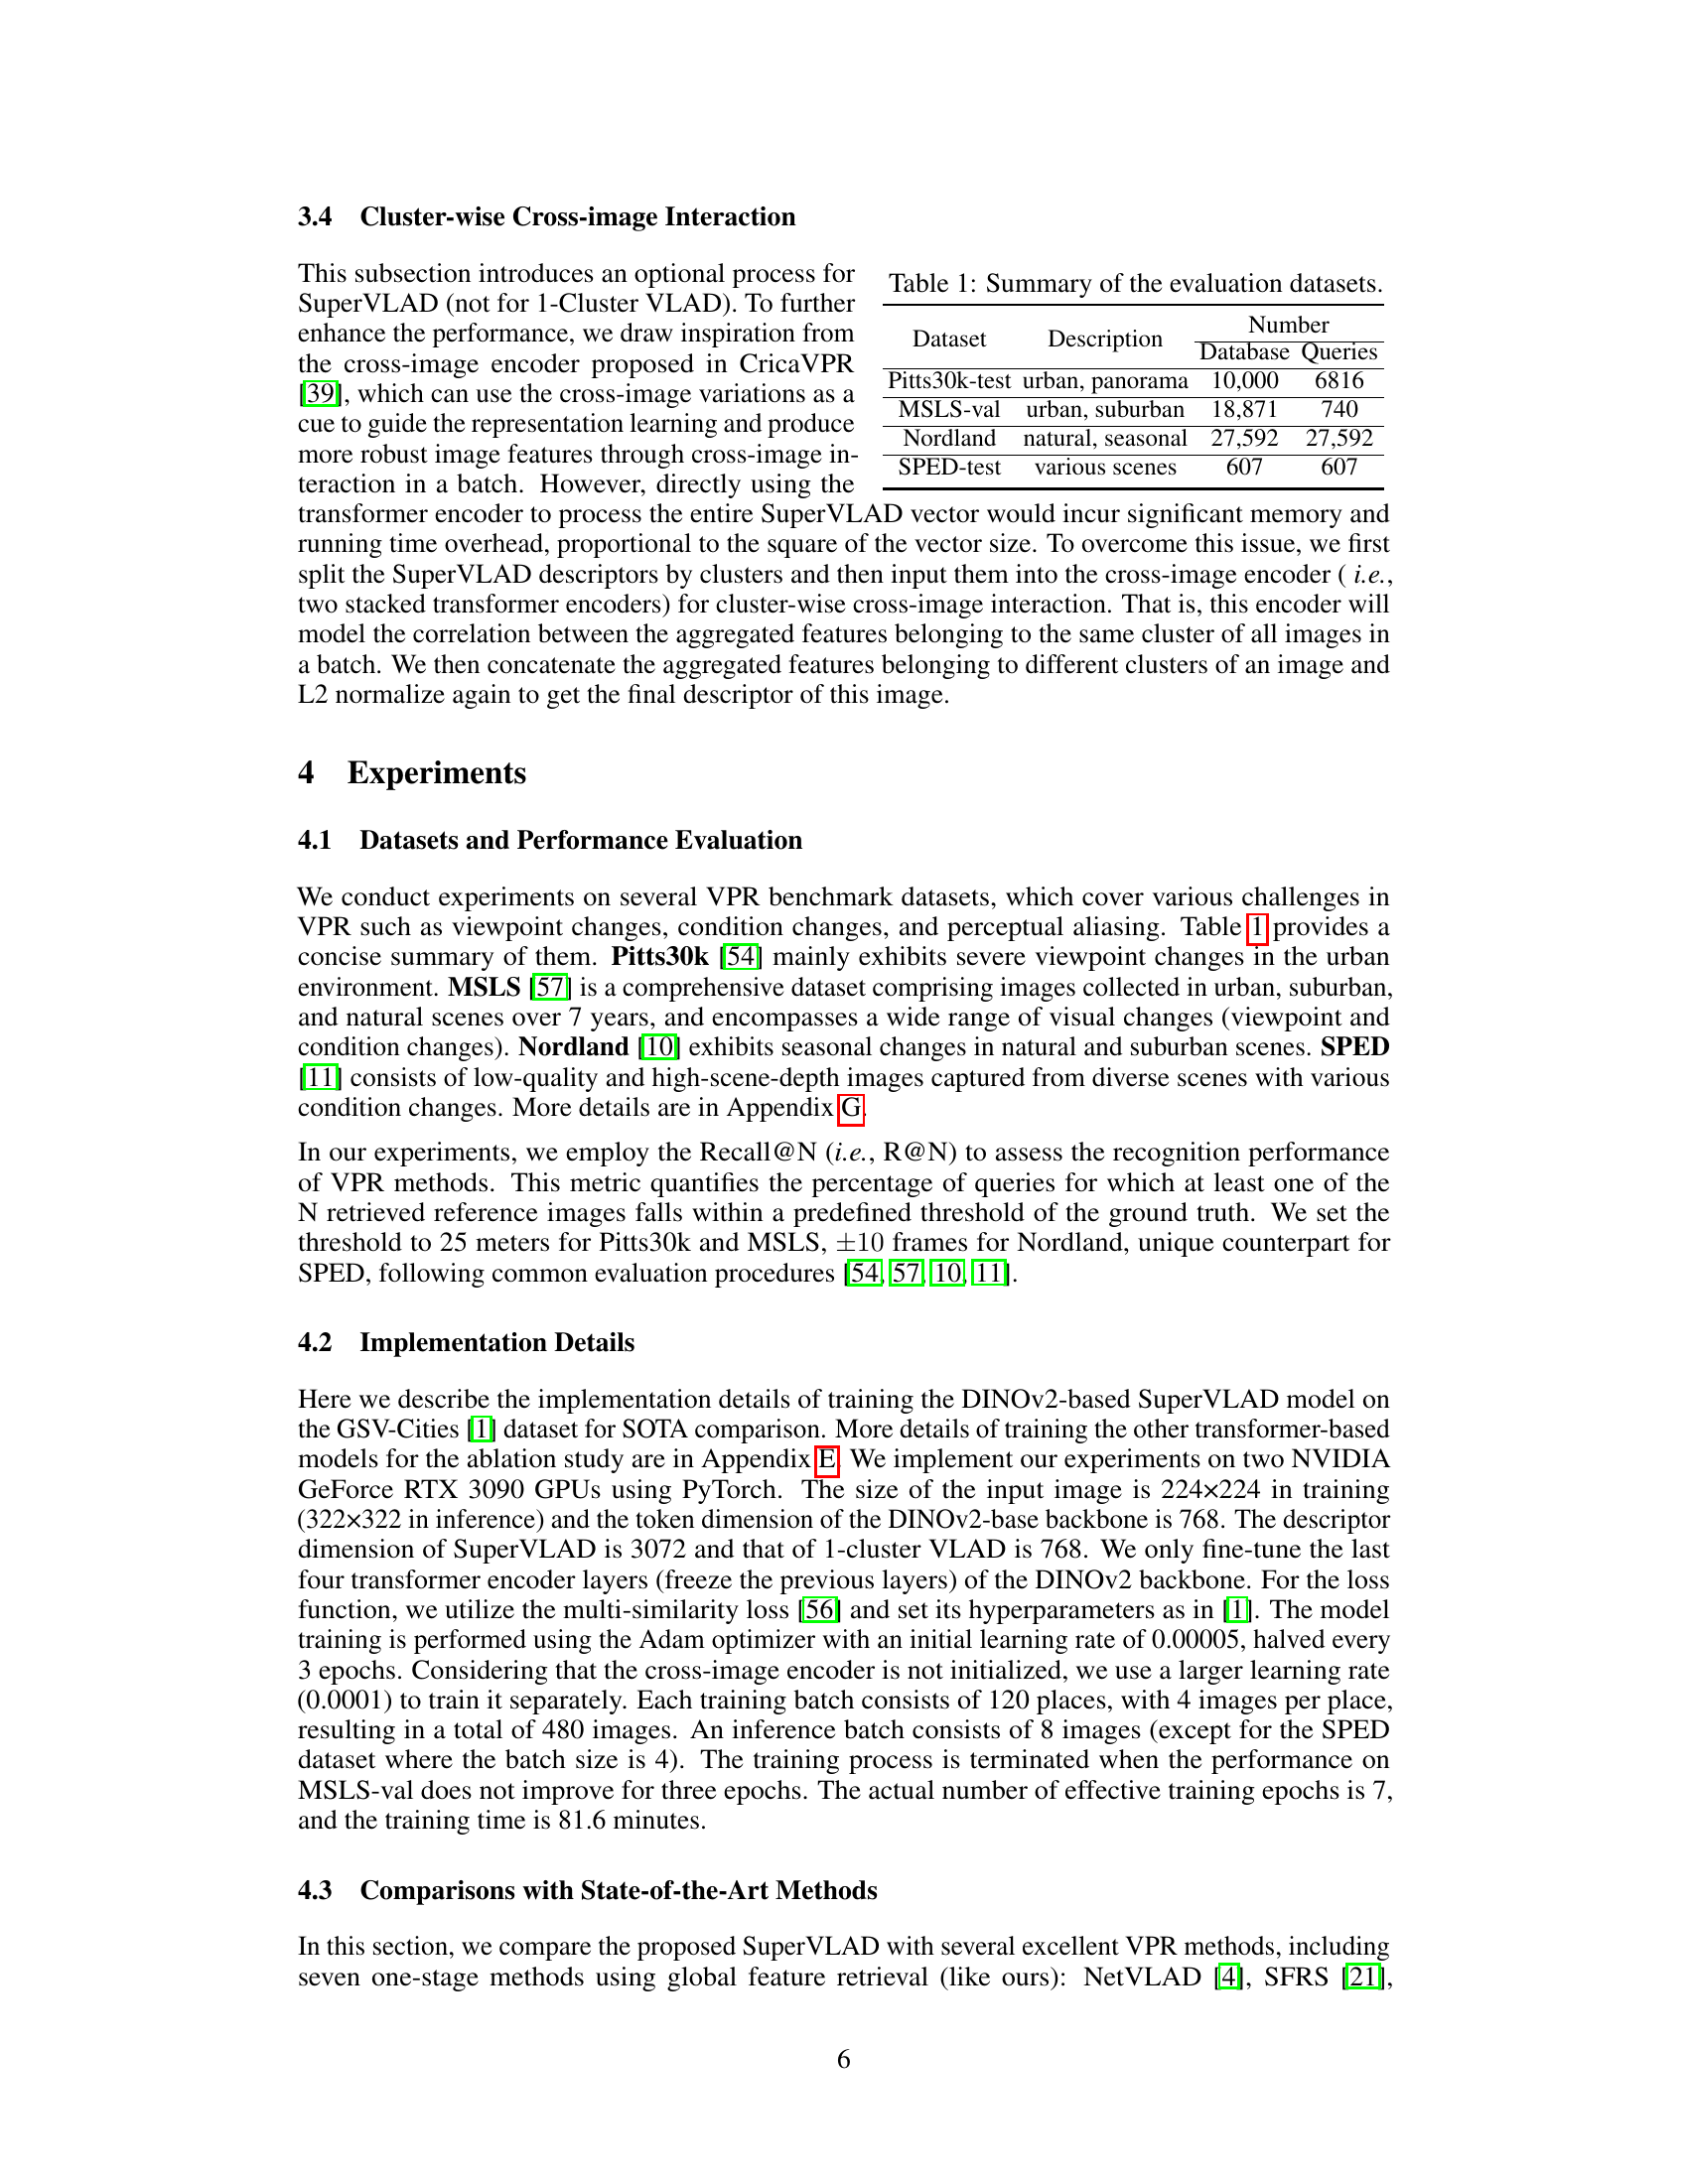
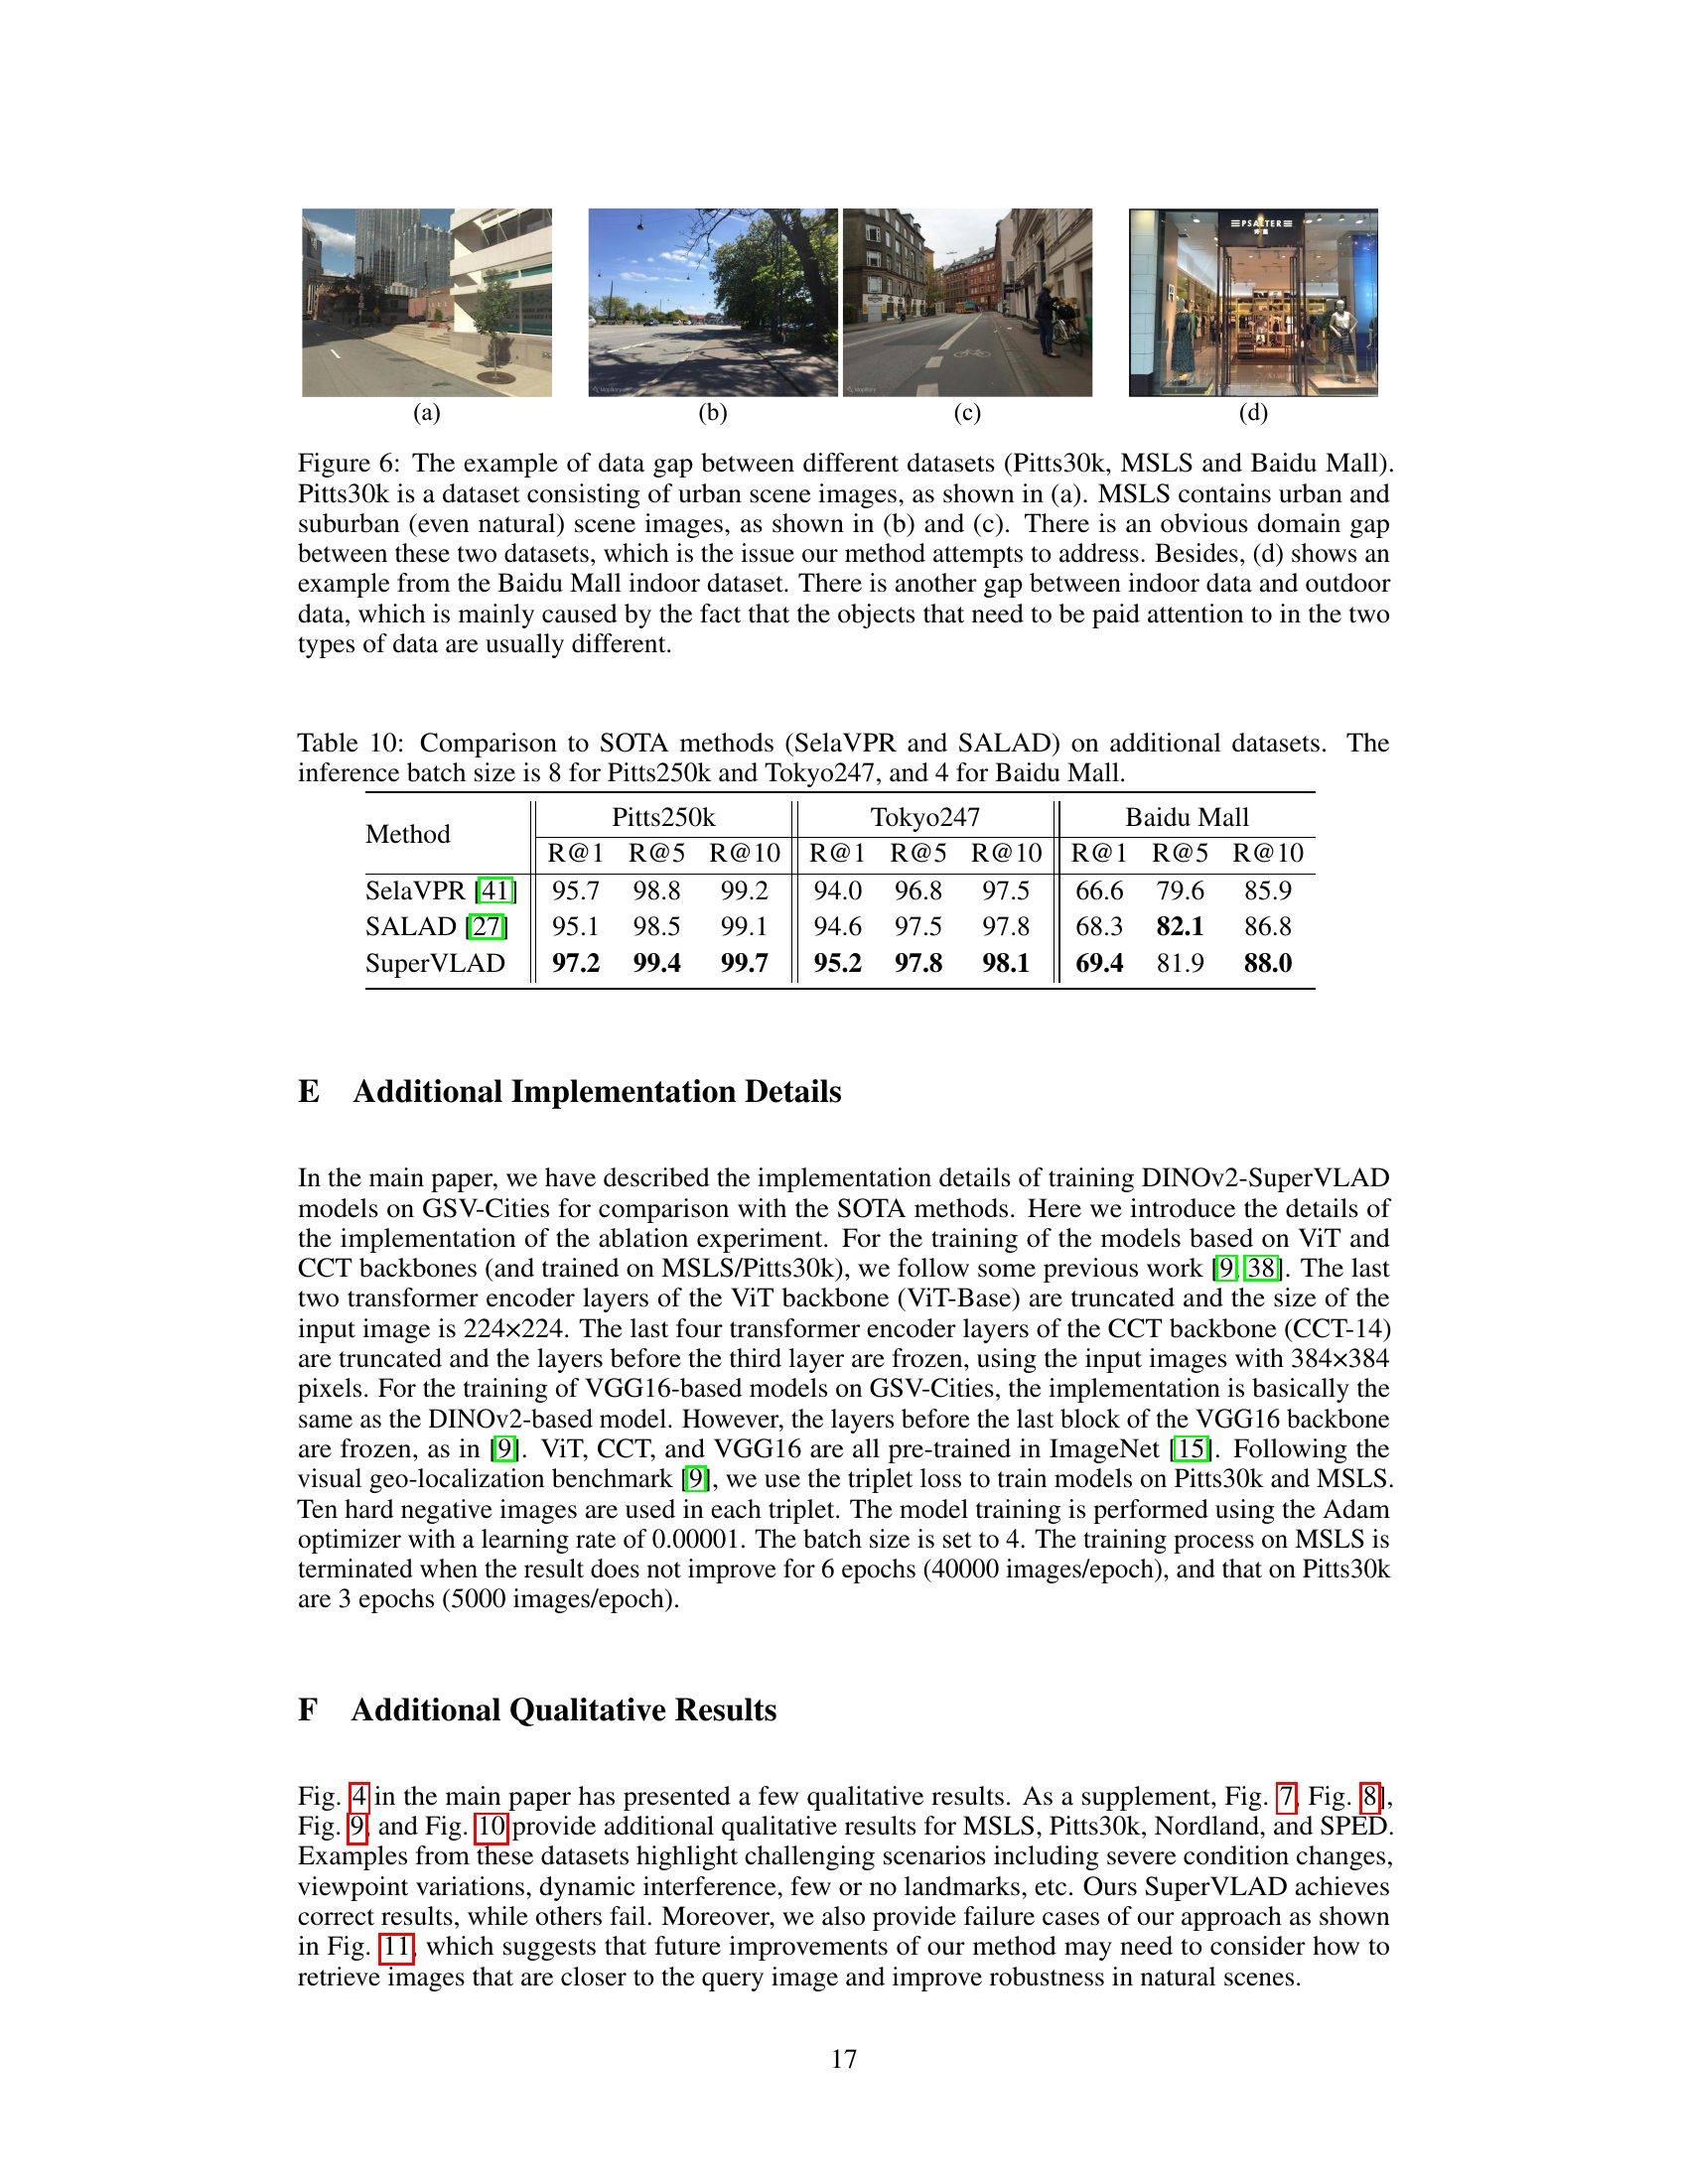
🔼 This table summarizes the four datasets used for evaluating the visual place recognition (VPR) methods. It lists each dataset’s name, a brief description of the types of scenes it contains (urban, suburban, natural, or a mix), and the number of database images and query images used in the experiments. The datasets vary in size and the types of challenges they present (viewpoint changes, seasonal variations, etc.).
read the caption
Table 1: Summary of the evaluation datasets.
In-depth insights#
SuperVLAD’s Core#
SuperVLAD’s core innovation lies in its departure from traditional VLAD methods by eliminating the need for cluster centers. This simplification is achieved through a weighted summation of local features assigned to each cluster, directly improving domain generalization and compactness. Removing cluster centers mitigates the performance drop usually observed in NetVLAD due to domain gaps between training and inference data. By directly summing weighted local features instead of using residuals, SuperVLAD exhibits improved robustness and significantly fewer parameters. The method’s efficacy is further enhanced by its use of soft-assignment, similar to NetVLAD, which allows for a differentiable and more flexible cluster assignment. The resulting global descriptor, even with a drastically reduced number of clusters, achieves state-of-the-art performance, demonstrating SuperVLAD’s effectiveness and efficiency as a compact and robust image descriptor for visual place recognition.
Ghost Clusters#
The concept of “Ghost Clusters” in visual place recognition (VPR) introduces a powerful technique to enhance model robustness and efficiency. By introducing additional clusters during the soft-assignment process that are not included in the final output vector, the model gains the ability to learn and filter out irrelevant or noisy features. These “ghost clusters” act as a kind of regularization technique, absorbing distracting information that would otherwise negatively impact the performance of the main clusters, ultimately improving the overall accuracy and generalization capabilities of the VPR system. This is particularly beneficial in scenarios with domain gaps, where the distribution of training and test data significantly differs. The use of ghost clusters allows the model to effectively ignore these discrepancies and focus on relevant features, leading to enhanced performance across different datasets and environments. Crucially, the computational cost is often minimal because the ghost clusters are not retained in the final descriptor. This makes the method particularly attractive for resource-constrained applications where computational efficiency is paramount. The integration of ghost clusters therefore offers a valuable improvement to VPR models by enhancing robustness, accuracy, and efficiency, making it a noteworthy technique for advancing the field.
1-Cluster VLAD#
The proposed 1-Cluster VLAD method is a significant innovation for visual place recognition (VPR), addressing the limitations of high dimensionality and domain generalization issues present in traditional VLAD-based approaches. By introducing ghost clusters during soft assignment, but retaining only a single real cluster in the final output, it produces very low-dimensional features comparable to GeM pooling yet exhibiting substantially improved performance. This approach cleverly leverages the strengths of soft-assignment while mitigating the negative impact of learned cluster centers, which can vary significantly across domains. The extremely low dimensionality makes it computationally efficient and suitable for resource-constrained applications. The 1-Cluster VLAD design elegantly balances compactness with accuracy, offering a compelling alternative to existing aggregation methods, particularly when paired with transformer-based backbones.
Cross-Image Encoders#
Cross-image encoders represent a powerful technique to enhance visual place recognition (VPR) by leveraging relationships between images within a batch. Instead of treating each image independently, these encoders model the inter-image dependencies, capturing contextual information that improves robustness and accuracy. The key advantage is the ability to handle variations in viewpoint, lighting, and weather conditions more effectively. By considering multiple images simultaneously, the encoder can learn more robust representations that are less susceptible to individual image idiosyncrasies. However, implementation requires careful consideration of computational cost, as processing increases quadratically with the number of images. This limitation can be mitigated using efficient architectures or by processing features in a cluster-wise manner, as done in the paper, where each cluster of features is passed through the encoder, rather than the whole vector. Overall, cross-image encoders provide a valuable pathway toward more robust VPR systems, particularly when paired with compact descriptor methods like SuperVLAD. The potential for improved generalization across different domains is significant, making it a promising area for future research and development.
Future of VPR#
The future of Visual Place Recognition (VPR) hinges on addressing its current limitations and leveraging emerging technologies. Robustness in challenging conditions (e.g., varied lighting, weather, seasons) remains a key challenge, demanding more sophisticated feature extraction and aggregation techniques, perhaps incorporating multimodal data (LiDAR, IMU). Computational efficiency is critical for real-time applications, necessitating more compact and efficient descriptors and faster search algorithms. Scalability to massive datasets requires innovative indexing and retrieval methods. Generalization across diverse domains (urban, rural, indoor) demands domain adaptation or more generalized feature representations. Integration with other technologies, like SLAM and semantic scene understanding, is vital for more comprehensive spatial awareness. Finally, ethical considerations, particularly regarding privacy and bias in datasets, need careful attention as VPR applications expand.
More visual insights#
More on figures
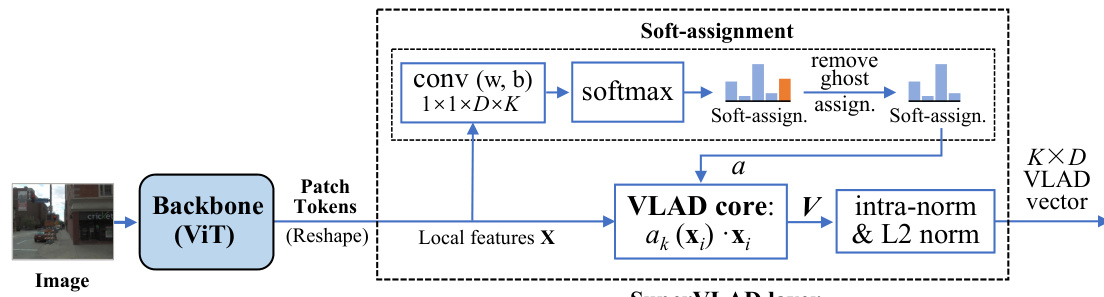
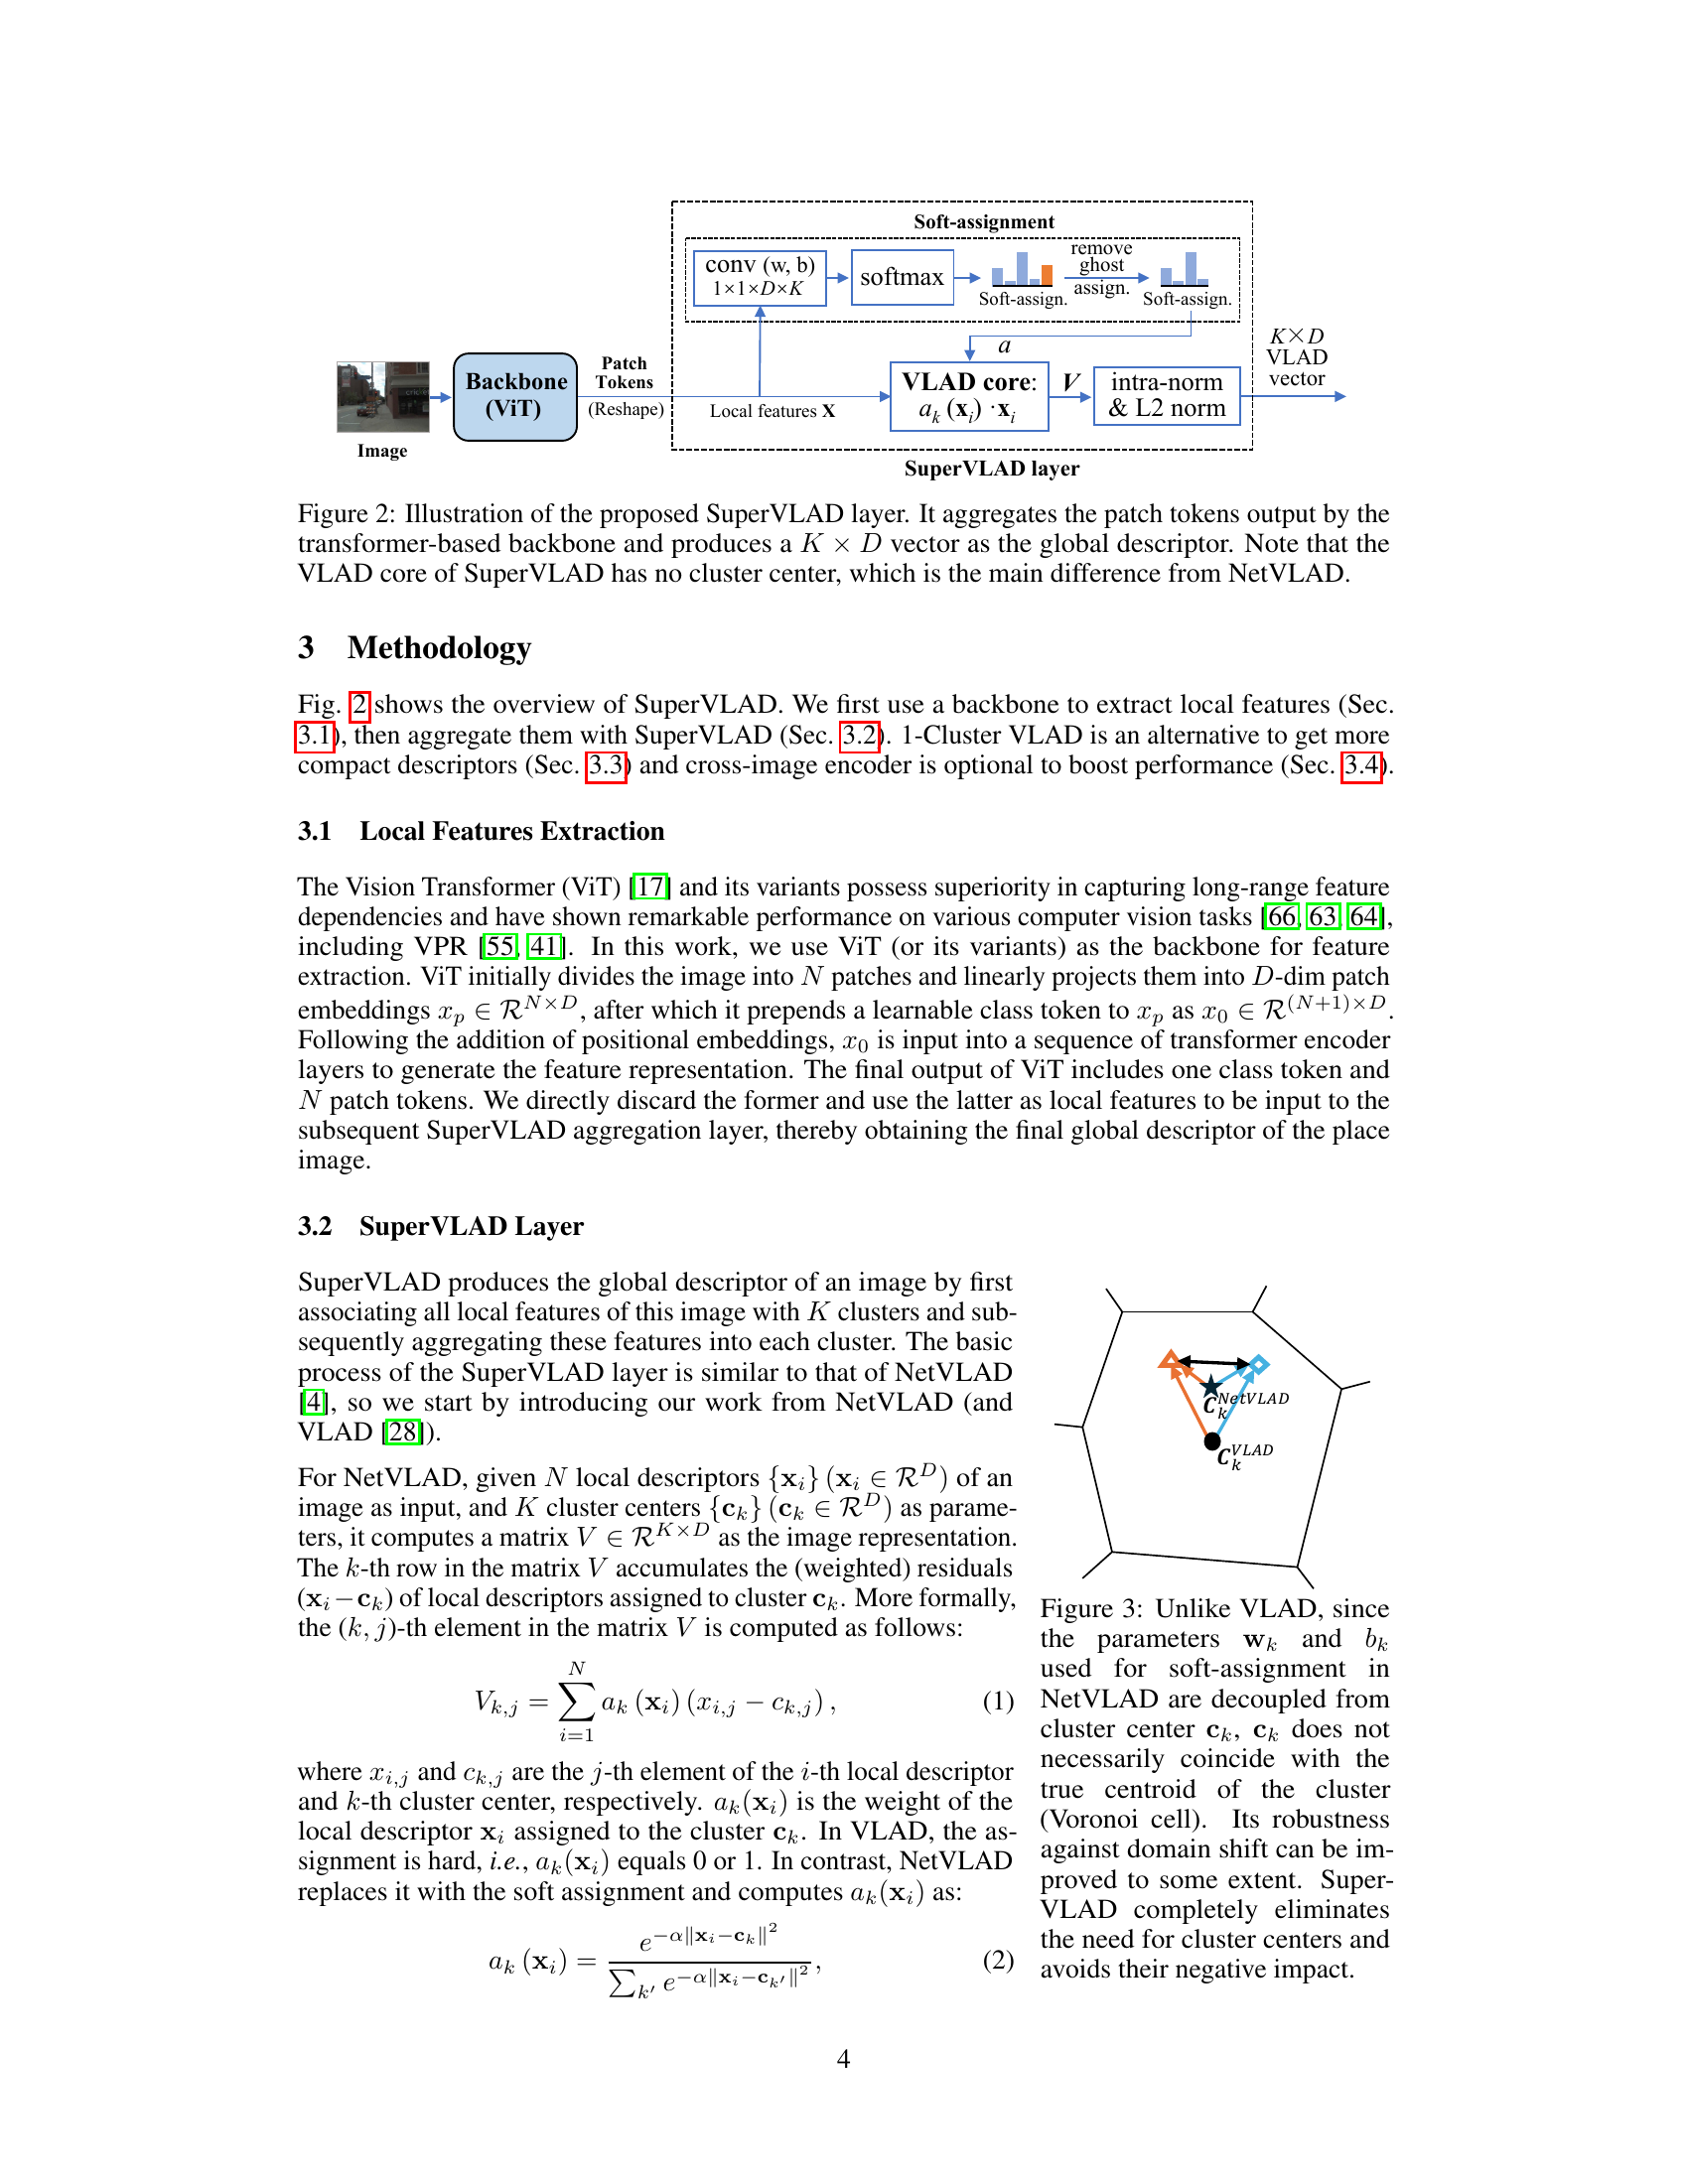
🔼 This figure illustrates the SuperVLAD layer architecture. The input is the patch tokens from a transformer-based backbone. These tokens are then processed by a 1x1 convolutional layer and a softmax layer for soft-assignment to K clusters. Unlike NetVLAD, there are no cluster centers. The weighted sum of the assigned local features is then computed in a VLAD core to form the global descriptor which is finally intra-normalized and L2 normalized. The use of ‘ghost’ clusters is also shown, indicating that some clusters are not included in the final output.
read the caption
Figure 2: Illustration of the proposed SuperVLAD layer. It aggregates the patch tokens output by the transformer-based backbone and produces a K × D vector as the global descriptor. Note that the VLAD core of SuperVLAD has no cluster center, which is the main difference from NetVLAD.
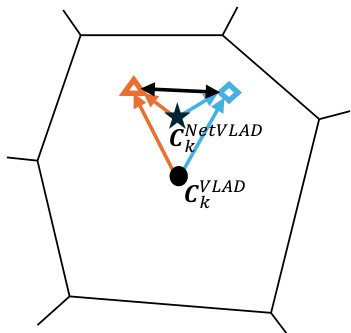
🔼 This figure compares VLAD and NetVLAD’s approaches to assigning local features to clusters and highlights SuperVLAD’s improvement. VLAD uses hard assignment based on distance to cluster centers (ck), while NetVLAD uses soft assignment, where weights (wk and bk) are decoupled from the cluster centers. SuperVLAD improves further by completely removing the need for cluster centers, making it more robust to domain shift and training data variations. The figure uses Voronoi cells to illustrate cluster assignments and the impact of cluster centers.
read the caption
Figure 3: Unlike VLAD, since the parameters wk and bk used for soft-assignment in (1) NetVLAD are decoupled from cluster center ck, ck does not necessarily coincide with the true centroid of the cluster (Voronoi cell). Its robustness against domain shift can be improved to some extent. SuperVLAD completely eliminates the need for cluster centers and (2) avoids their negative impact.
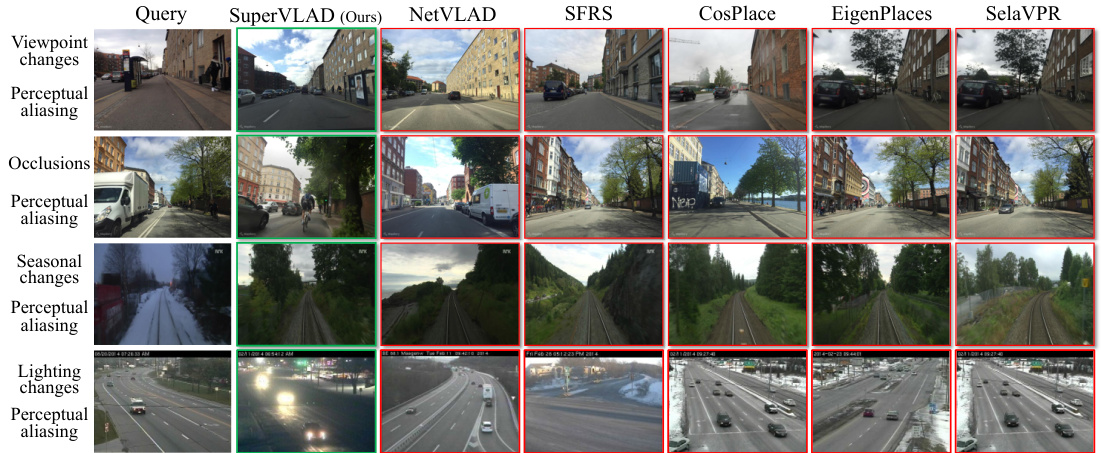
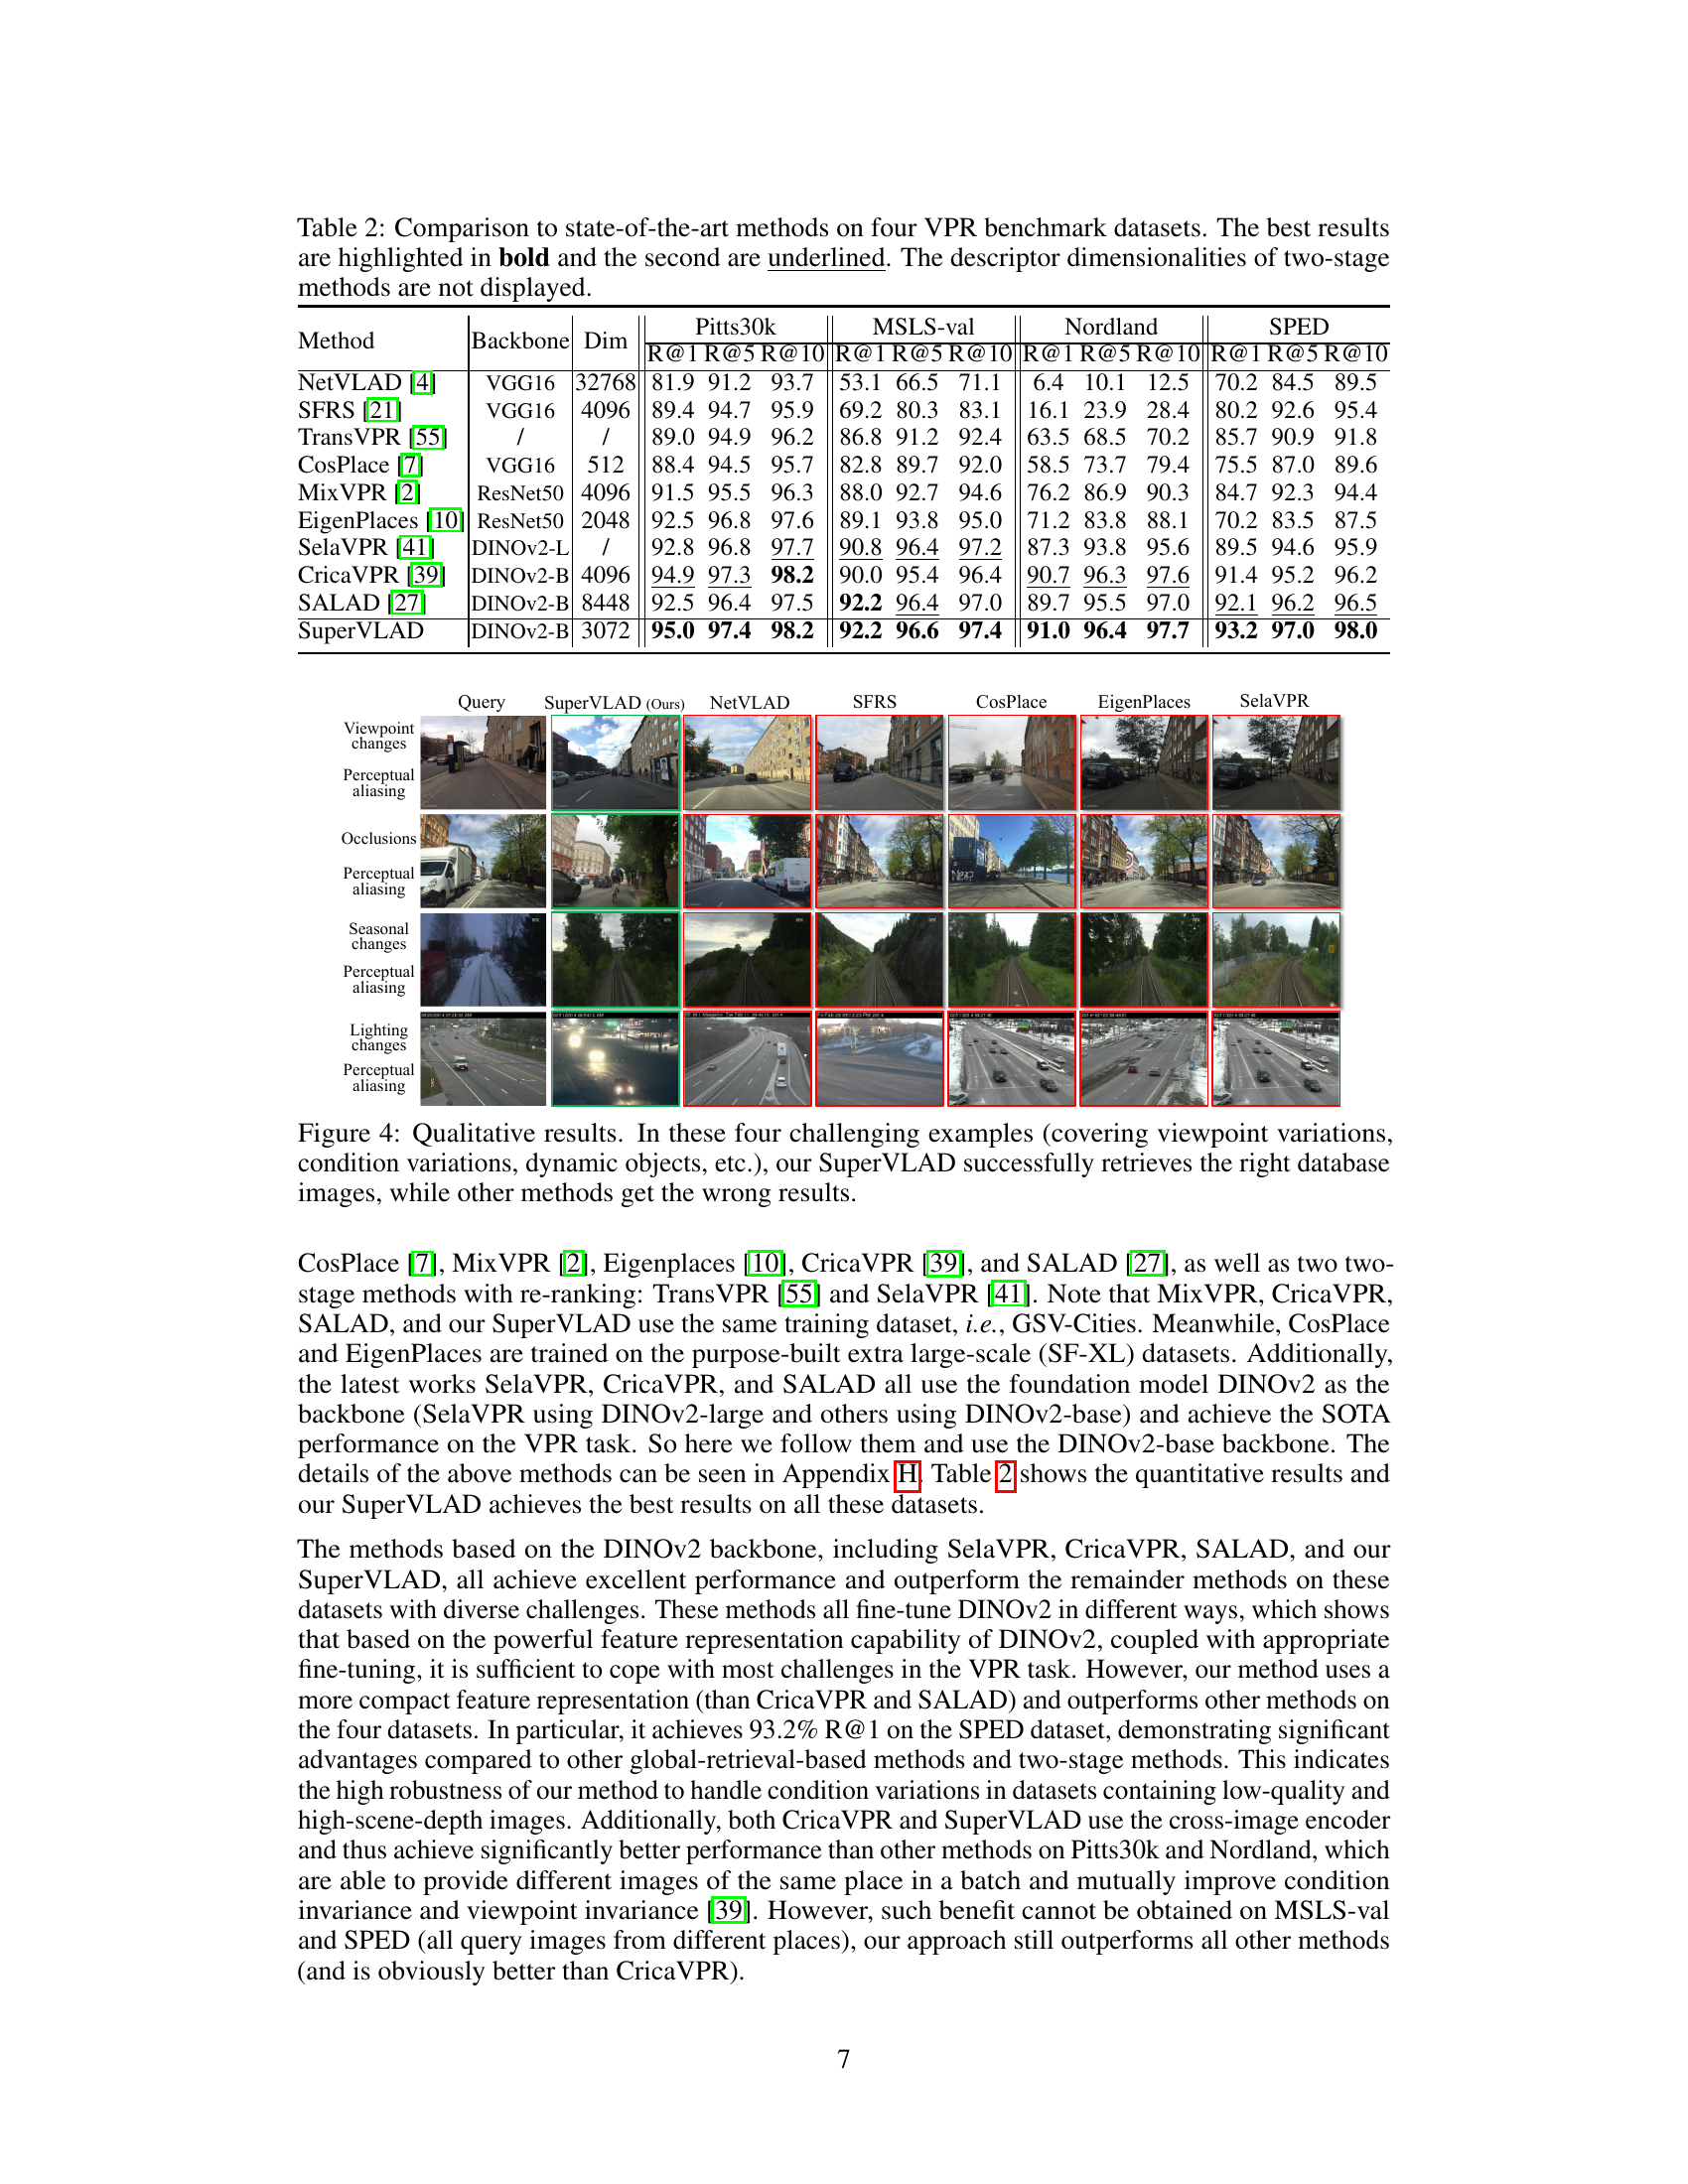
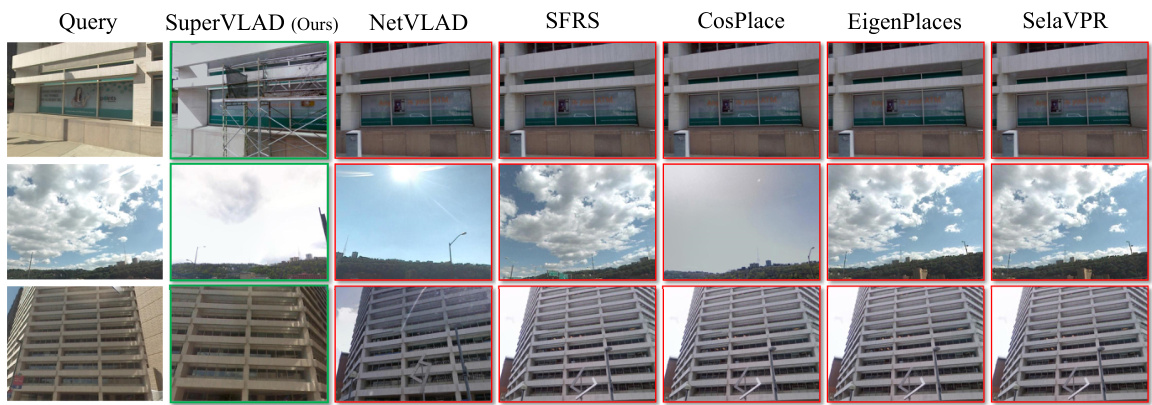
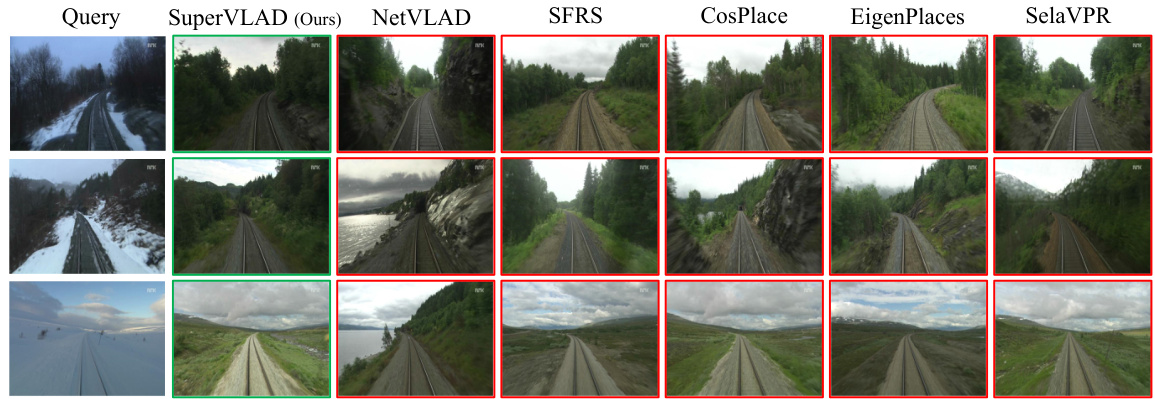
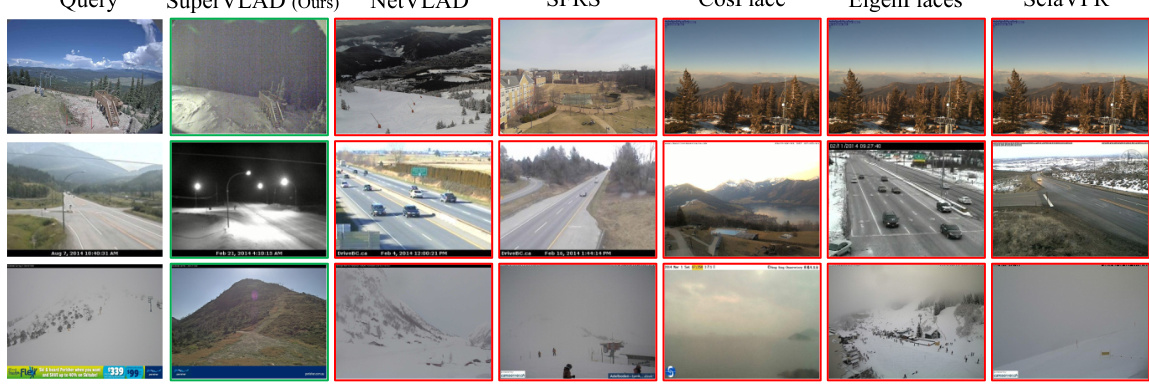
🔼 This figure presents four challenging examples where viewpoint, condition, and dynamic objects cause variations in the images. It demonstrates the superior performance of SuperVLAD in successfully retrieving the correct database images, while other methods fail, highlighting SuperVLAD’s robustness to various challenges.
read the caption
Figure 4: Qualitative results. In these four challenging examples (covering viewpoint variations, condition variations, dynamic objects, etc.), our SuperVLAD successfully retrieves the right database images, while other methods get the wrong results.
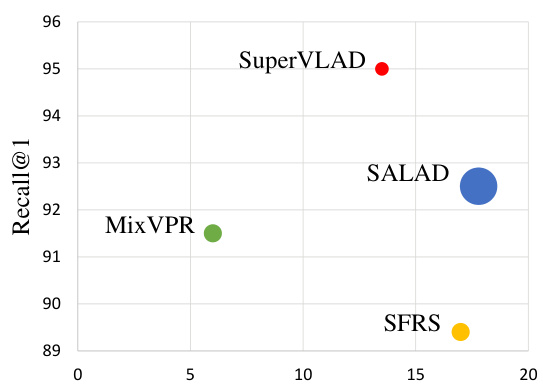
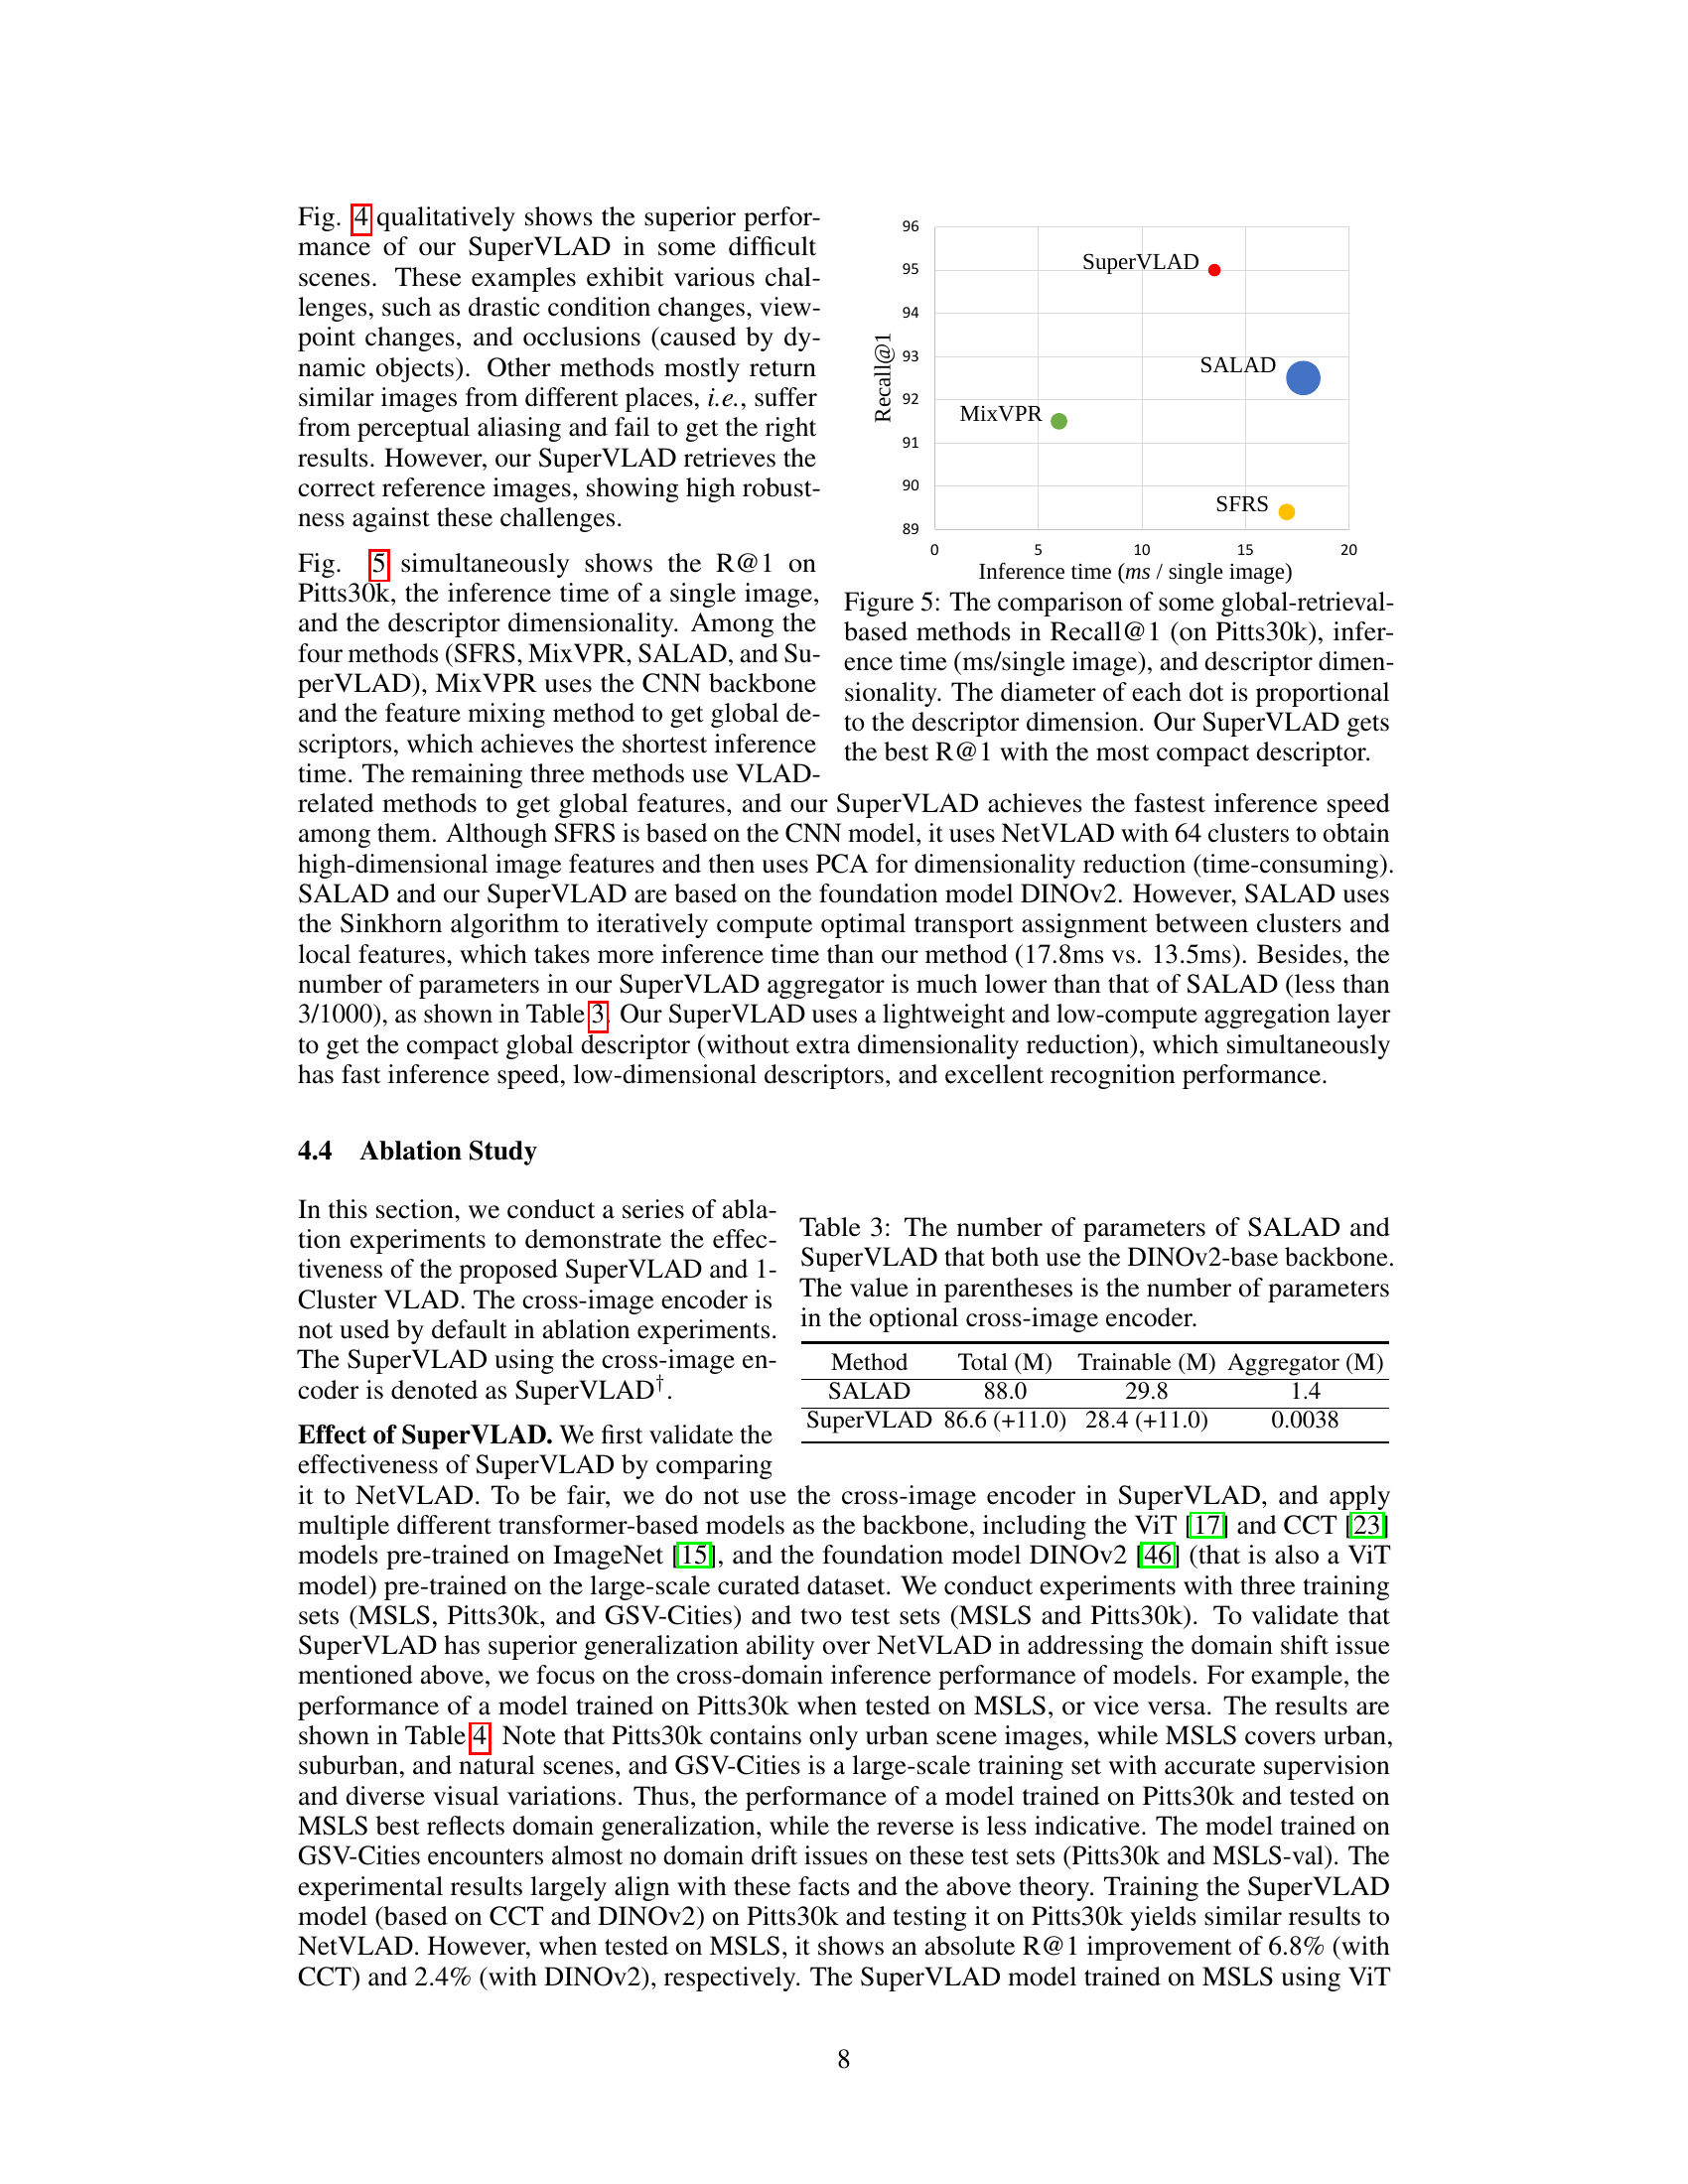
🔼 This figure compares several global retrieval-based visual place recognition methods using three metrics: Recall@1 on the Pitts30k dataset, inference time per image, and descriptor dimensionality. The size of each data point visually represents the dimensionality of the descriptor. SuperVLAD demonstrates superior Recall@1 performance with a significantly smaller descriptor size and faster inference time compared to the other methods.
read the caption
Figure 5: The comparison of some global-retrieval-based methods in Recall@1 (on Pitts30k), inference time (ms/single image), and descriptor dimensionality. The diameter of each dot is proportional to the descriptor dimension. Our SuperVLAD gets the best R@1 with the most compact descriptor.
🔼 This figure compares the VLAD and SuperVLAD methods’ similarity measures under varying clusterings. It uses a visual representation of local descriptors from two images to illustrate how VLAD’s reliance on cluster centers leads to sensitivity to training data distribution, resulting in potentially opposite similarity results depending on the training data. SuperVLAD, in contrast, directly calculates the weighted sum of features, making it more robust to differences in training data distributions.
read the caption
Figure 1: VLAD and SuperVLAD similarity measures under different clusterings (Voronoi cells). Orange triangles and blue diamonds depict local descriptors from two different images. In (a) and (b), orange and blue arrows are the sum of residuals (for VLAD). With different training data distributions, the different cluster centers are yielded, causing opposite similarity results using cosine similarity (or normalized L2 distance). Compared to VLAD, our SuperVLAD, as shown in (c) and (d), simply calculates the distance between the weighted sum of local features directly, freeing from the impact of cluster centers. Thus, only minor changes will occur when dealing with two different distributions.
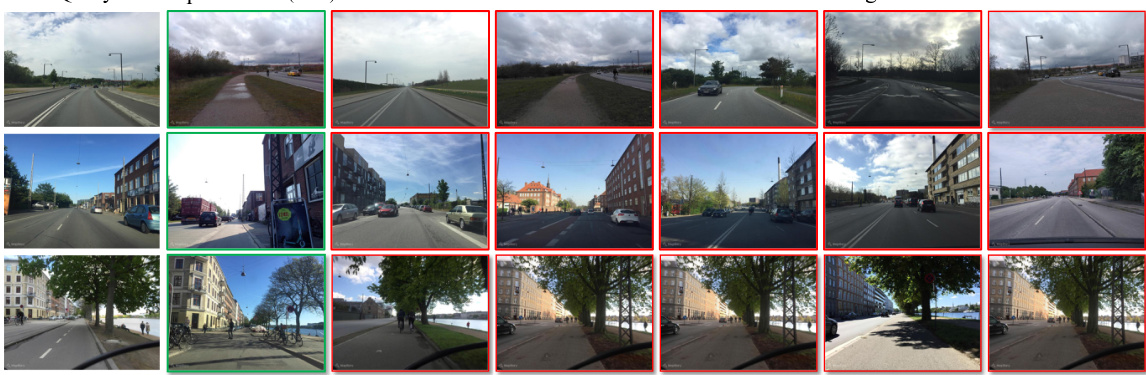
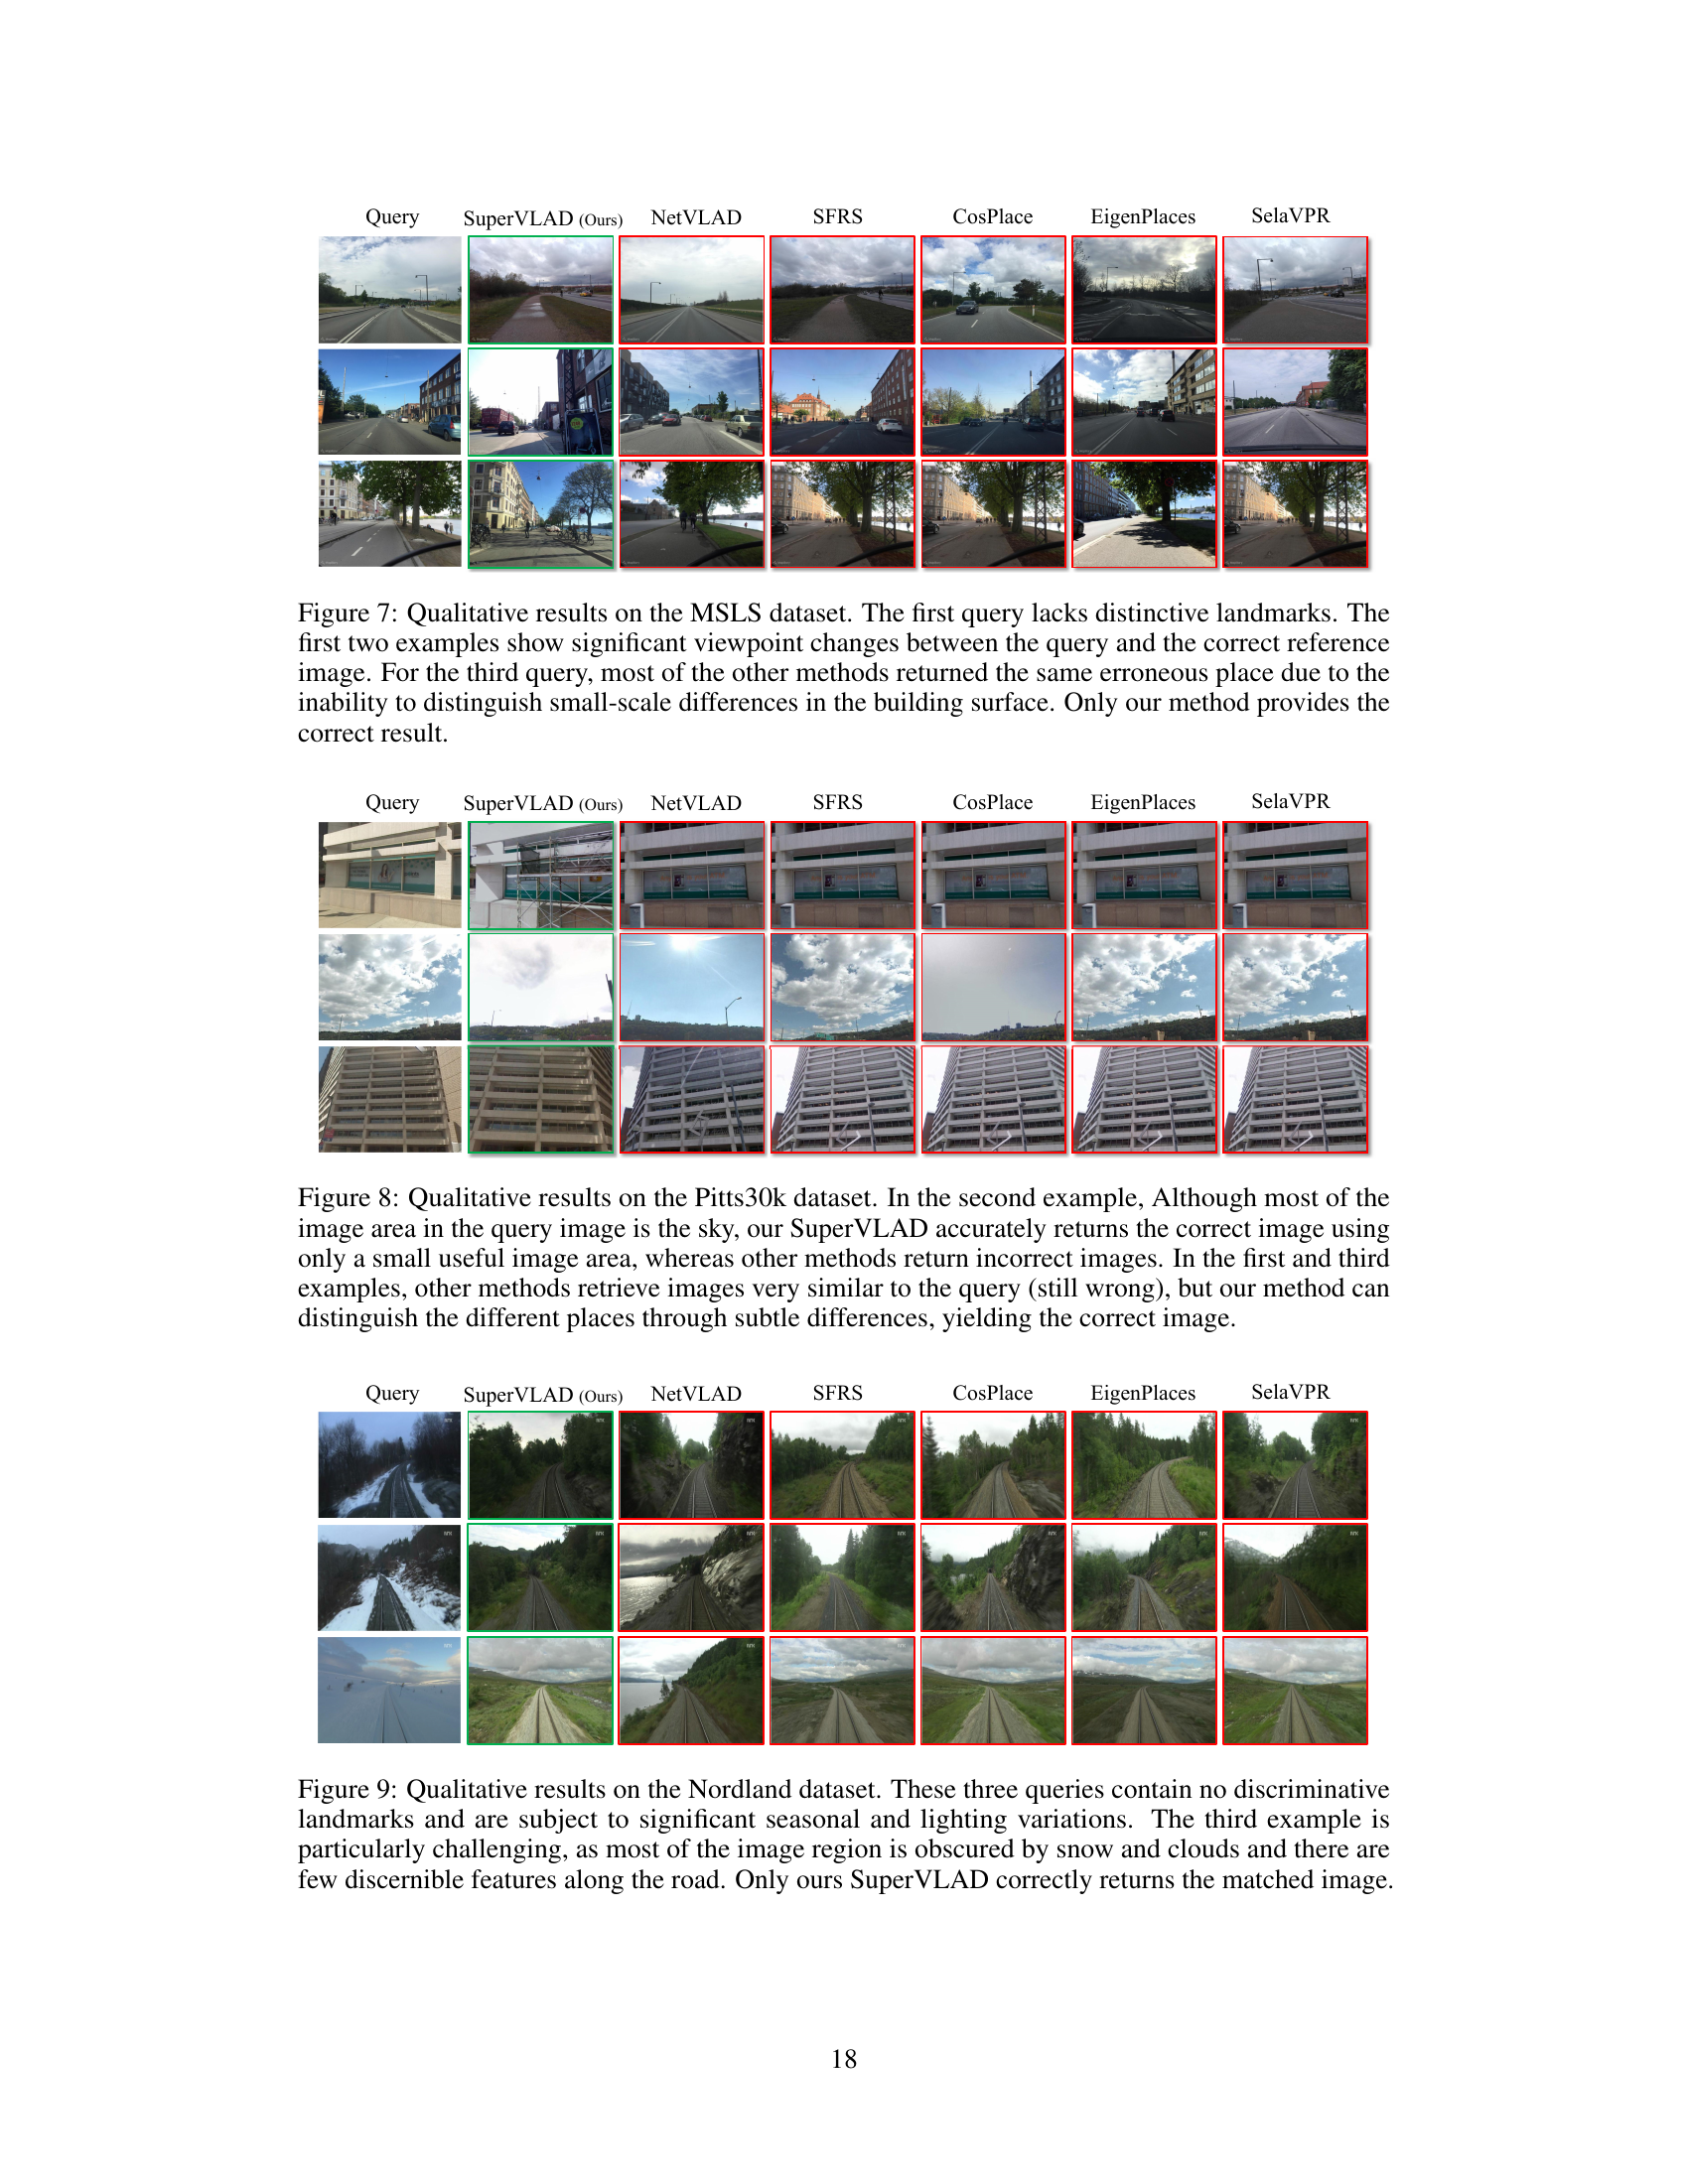
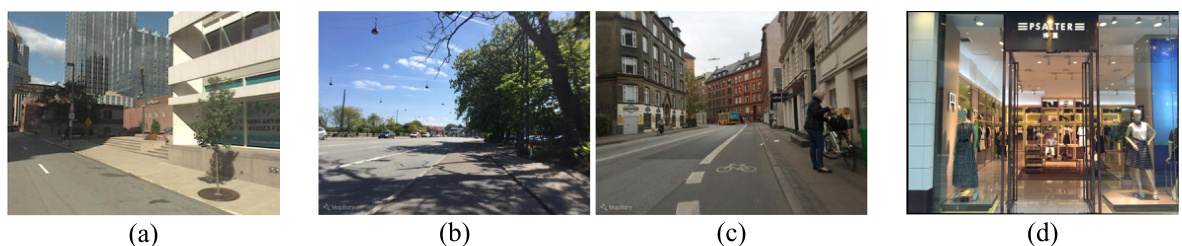
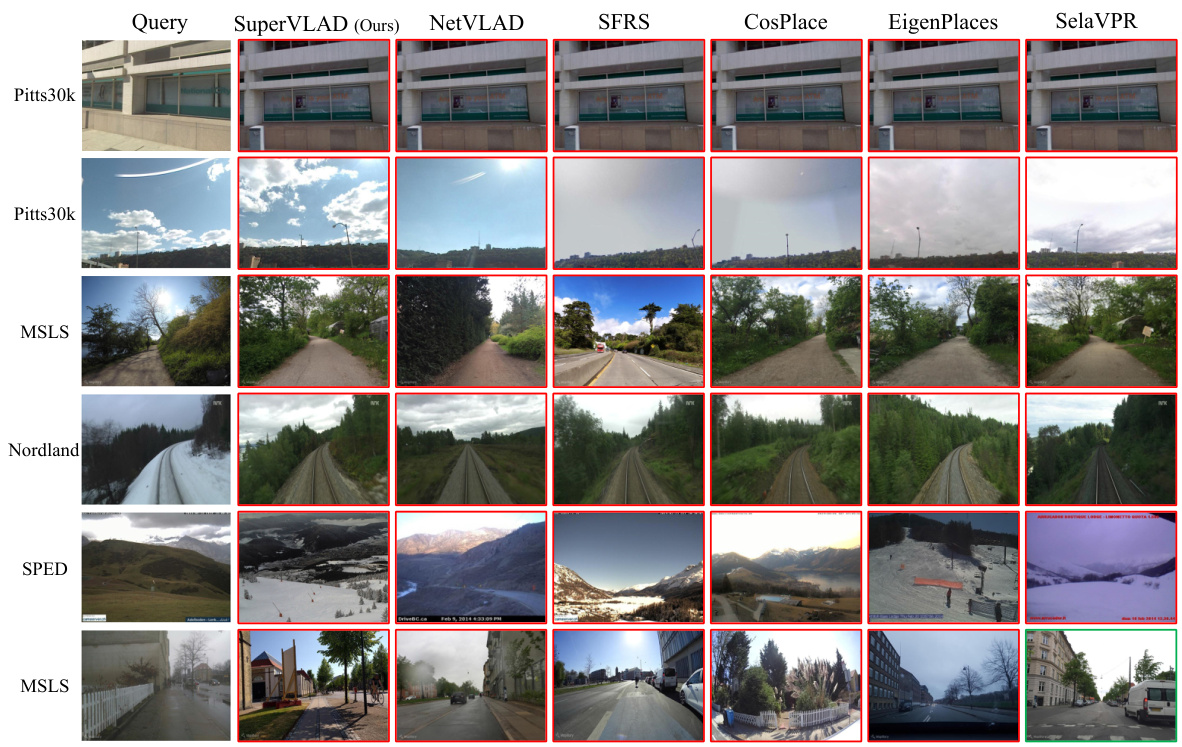
🔼 This figure shows three qualitative examples from the MSLS dataset demonstrating the performance of SuperVLAD against other state-of-the-art methods. The first query image lacks distinctive landmarks, the second shows significant viewpoint differences between the query and correct match, and the third illustrates difficulty in distinguishing subtle differences in building appearance. SuperVLAD is the only method that correctly identifies the place in all three scenarios.
read the caption
Figure 7: Qualitative results on the MSLS dataset. The first query lacks distinctive landmarks. The first two examples show significant viewpoint changes between the query and the correct reference image. For the third query, most of the other methods returned the same erroneous place due to the inability to distinguish small-scale differences in the building surface. Only our method provides the correct result.
🔼 This figure shows four examples where the proposed SuperVLAD method successfully retrieves the correct images despite challenging conditions such as viewpoint changes, changing conditions (e.g., lighting, weather), and the presence of dynamic objects. In contrast, other methods fail to retrieve the correct images, highlighting SuperVLAD’s superior robustness.
read the caption
Figure 4: Qualitative results. In these four challenging examples (covering viewpoint variations, condition variations, dynamic objects, etc.), our SuperVLAD successfully retrieves the right database images, while other methods get the wrong results.
🔼 This figure shows four examples where various challenging conditions are present such as viewpoint changes, changes in lighting conditions and the presence of dynamic objects. The results show that SuperVLAD is able to correctly identify the location in each of these four cases, unlike the other methods which mostly fail.
read the caption
Figure 4: Qualitative results. In these four challenging examples (covering viewpoint variations, condition variations, dynamic objects, etc.), our SuperVLAD successfully retrieves the right database images, while other methods get the wrong results.
🔼 This figure showcases qualitative results comparing SuperVLAD against other state-of-the-art methods on four challenging examples. The examples highlight various challenges, such as viewpoint variations, condition variations, and the presence of dynamic objects. SuperVLAD successfully retrieves the correct database images for all four examples, whereas other methods consistently fail to retrieve the correct matches.
read the caption
Figure 4: Qualitative results. In these four challenging examples (covering viewpoint variations, condition variations, dynamic objects, etc.), our SuperVLAD successfully retrieves the right database images, while other methods get the wrong results.
🔼 This figure shows four examples where the proposed SuperVLAD method correctly retrieves the correct database images while other methods (NetVLAD, SFRS, CosPlace, EigenPlaces, and SelaVPR) fail. The examples cover various challenging scenarios, including significant viewpoint changes, different lighting conditions, the presence of dynamic objects, and perceptual aliasing, demonstrating the robustness and superior performance of SuperVLAD.
read the caption
Figure 4: Qualitative results. In these four challenging examples (covering viewpoint variations, condition variations, dynamic objects, etc.), our SuperVLAD successfully retrieves the right database images, while other methods get the wrong results.
More on tables
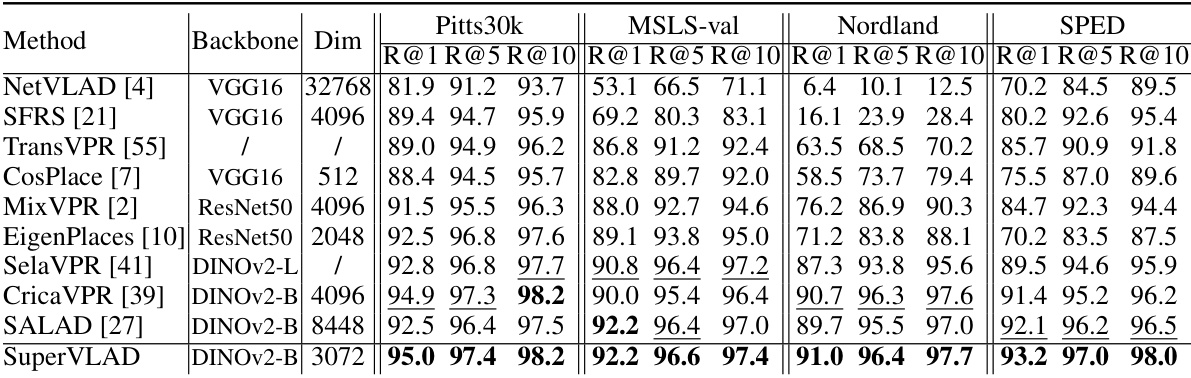
🔼 This table compares the proposed SuperVLAD method with several other state-of-the-art visual place recognition (VPR) methods across four benchmark datasets: Pitts30k, MSLS-val, Nordland, and SPED. The table presents the recall@k (R@k) for k=1, 5, and 10, showcasing the retrieval performance of each method. The backbone network used and the dimensionality of the descriptor are also shown. The best performing method for each dataset and metric is shown in bold, with the second-best result underlined. Note that two-stage methods are excluded from the dimensionality comparison due to their multi-stage nature.
read the caption
Table 2: Comparison to state-of-the-art methods on four VPR benchmark datasets. The best results are highlighted in bold and the second are underlined. The descriptor dimensionalities of two-stage methods are not displayed.
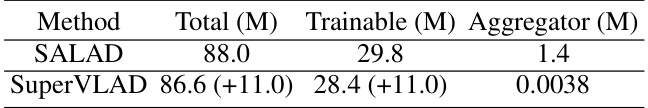
🔼 This table compares the number of parameters in the SALAD and SuperVLAD models, both using the DINOv2-base backbone. It breaks down the total number of parameters, the number of trainable parameters, and the number of parameters specifically in the aggregator part of the model. The values in parentheses for SuperVLAD represent the change in parameters compared to SALAD, showing a significant reduction in the number of parameters in SuperVLAD, especially in the aggregator. The addition of a cross-image encoder is optional and increases the parameters count for both models.
read the caption
Table 3: The number of parameters of SALAD and SuperVLAD that both use the DINOv2-base backbone. The value in parentheses is the number of parameters in the optional cross-image encoder.
🔼 This table compares the proposed SuperVLAD method against several state-of-the-art visual place recognition (VPR) methods across four benchmark datasets (Pitts30k, SPED, MSLS-val, and Nordland). It shows the Recall@1, Recall@5, and Recall@10 for each method on each dataset, highlighting the best and second-best results. The table also specifies the backbone network (e.g., VGG16, ResNet50, DINOv2) and the descriptor dimensionality used by each method. Two-stage methods are excluded from the dimensionality comparison, as their descriptor dimensions are not consistently defined in their respective papers.
read the caption
Table 2: Comparison to state-of-the-art methods on four VPR benchmark datasets. The best results are highlighted in bold and the second are underlined. The descriptor dimensionalities of two-stage methods are not displayed.
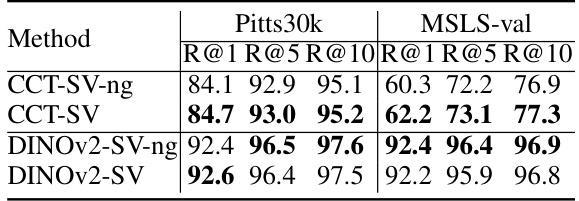
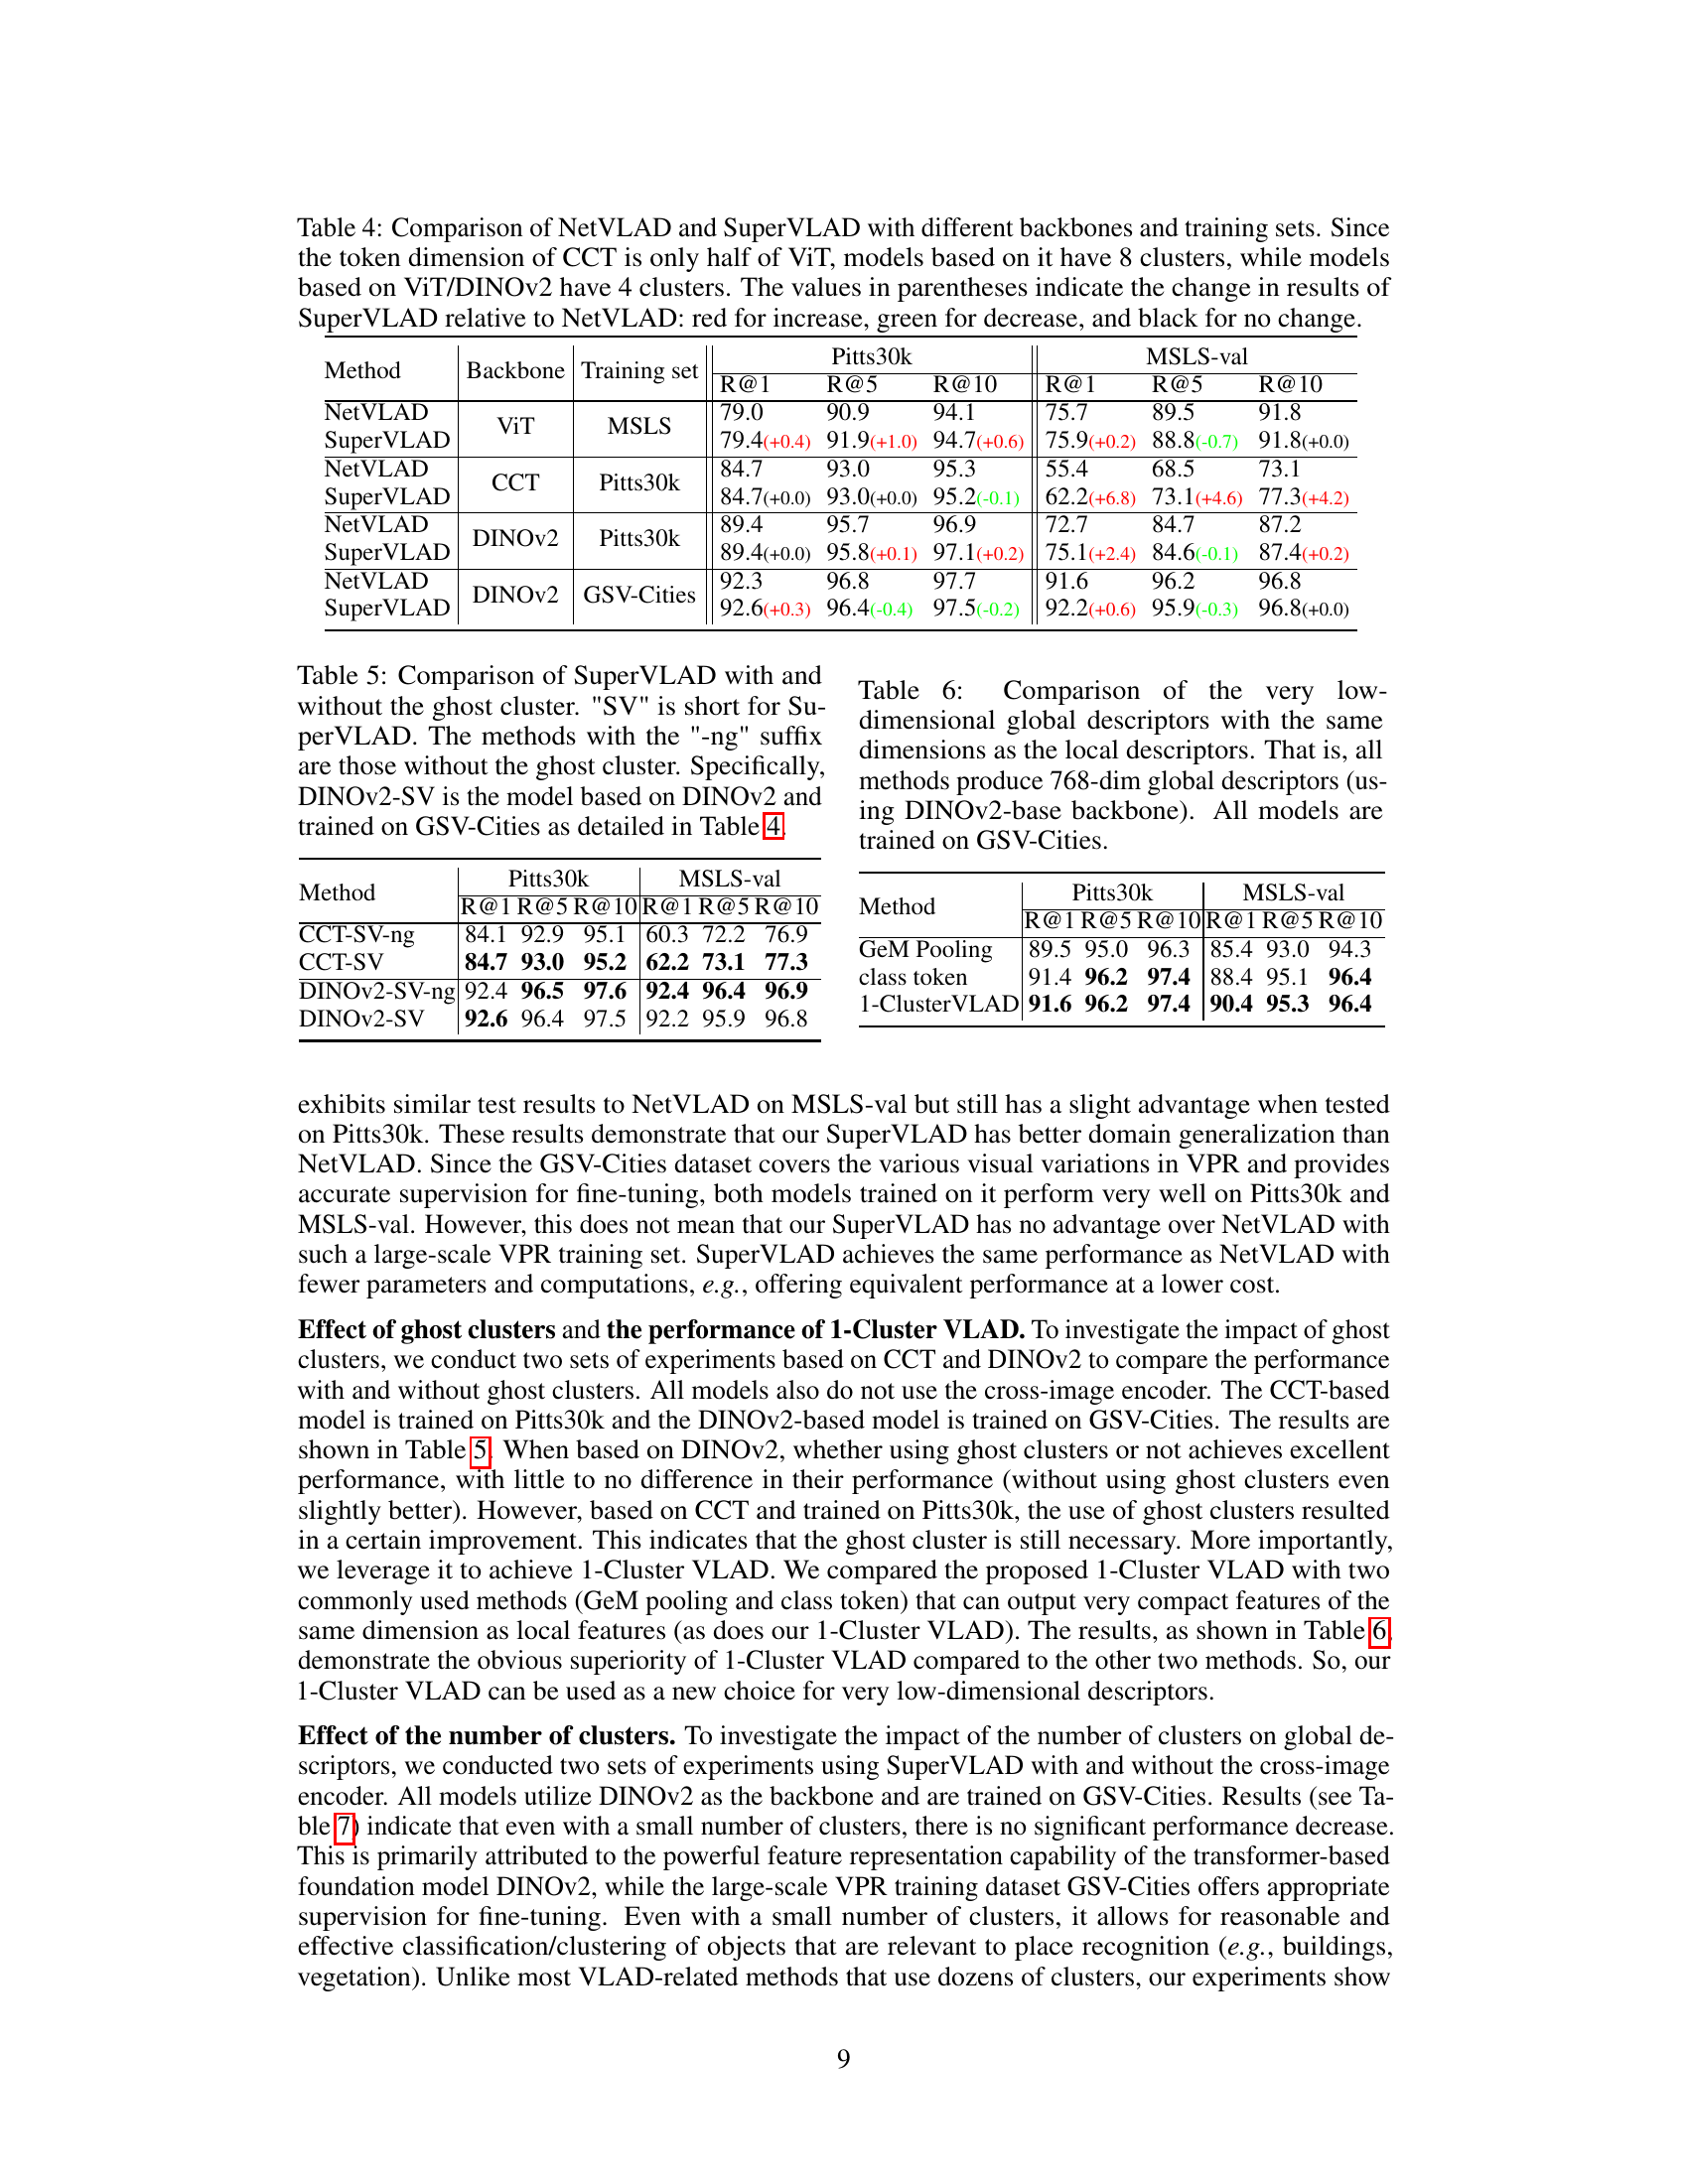
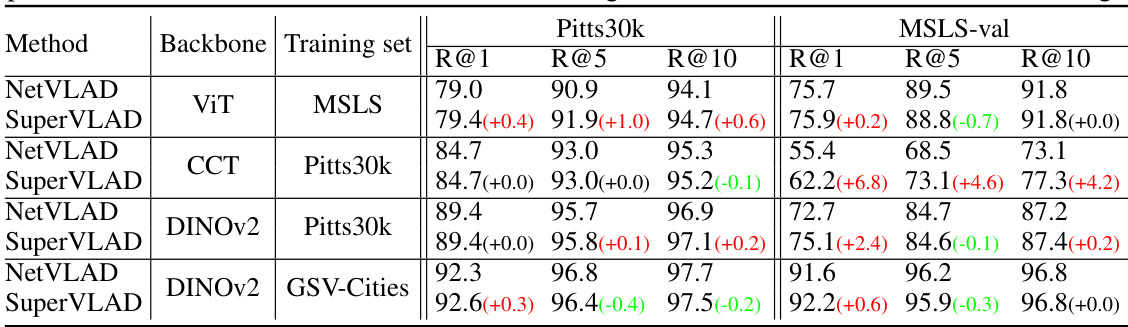
🔼 This table presents the ablation study on the effect of using ghost clusters in the SuperVLAD model. It compares the performance (Recall@1, Recall@5, and Recall@10) of SuperVLAD models trained on GSV-Cities dataset, both with and without the inclusion of a ghost cluster. The comparison is done for both the Pitts30k and MSLS-val datasets, using two different backbones: CCT and DINOv2. The results show that the inclusion of ghost clusters generally does not significantly impact performance, and the difference is minimal in most cases.
read the caption
Table 5: Comparison of SuperVLAD with and without the ghost cluster. 'SV' is short for SuperVLAD. The methods with the '-ng' suffix are those without the ghost cluster. Specifically, DINOv2-SV is the model based on DINOv2 and trained on GSV-Cities as detailed in Table 4.
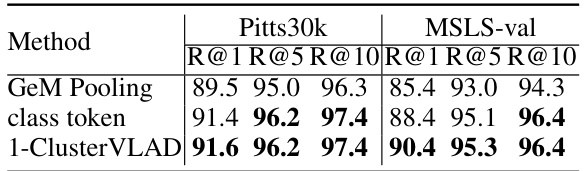
🔼 This table compares three methods for generating 768-dimensional global descriptors from local descriptors using the DINOv2-base backbone pre-trained on the GSV-Cities dataset. The methods compared are GeM pooling, using the class token, and the proposed 1-Cluster VLAD method. The evaluation metrics used are Recall@1, Recall@5, and Recall@10, on the Pitts30k and MSLS-val datasets. The results show that 1-Cluster VLAD outperforms both GeM pooling and using only the class token.
read the caption
Table 6: Comparison of the very low-dimensional global descriptors with the same dimensions as the local descriptors. That is, all methods produce 768-dim global descriptors (using DINOv2-base backbone). All models are trained on GSV-Cities.
🔼 This table compares the proposed SuperVLAD method against seven other state-of-the-art visual place recognition (VPR) methods across four benchmark datasets (Pitts30k, SPED, MSLS-val, and Nordland). Each method’s performance is evaluated using Recall@1, Recall@5, and Recall@10 metrics at different descriptor dimensions. The table highlights the best and second-best performing methods for each dataset and metric, showcasing SuperVLAD’s superior performance in many cases. Two-stage methods are excluded because their descriptor dimensionality is not consistently reported.
read the caption
Table 2: Comparison to state-of-the-art methods on four VPR benchmark datasets. The best results are highlighted in bold and the second are underlined. The descriptor dimensionalities of two-stage methods are not displayed.
🔼 This table compares the proposed SuperVLAD method with several state-of-the-art visual place recognition (VPR) methods across four benchmark datasets: Pitts30k, SPED, MSLS-val, and Nordland. It shows the Recall@1, Recall@5, and Recall@10 for each method, highlighting the best and second-best performance in bold and underlined, respectively. The table also indicates the backbone network and descriptor dimensionality used by each method, excluding two-stage methods for which dimensionality is not provided.
read the caption
Table 2: Comparison to state-of-the-art methods on four VPR benchmark datasets. The best results are highlighted in bold and the second are underlined. The descriptor dimensionalities of two-stage methods are not displayed.
🔼 This table compares the performance of SuperVLAD against other state-of-the-art visual place recognition (VPR) methods across four benchmark datasets (Pitts30k, SPED, MSLS-val, and Nordland). It shows the recall@k (R@k) for k=1, 5, and 10, indicating the percentage of queries where at least one of the top k retrieved images is within a predefined threshold of the ground truth. The table highlights the best and second-best performing methods for each dataset and metric, allowing for easy comparison of SuperVLAD’s performance against various backbones and descriptor dimensions. Two-stage methods are excluded from the descriptor dimensionality comparison.
read the caption
Table 2: Comparison to state-of-the-art methods on four VPR benchmark datasets. The best results are highlighted in bold and the second are underlined. The descriptor dimensionalities of two-stage methods are not displayed.
🔼 This table compares the proposed SuperVLAD method with several state-of-the-art visual place recognition (VPR) methods across four benchmark datasets: Pitts30k, SPED, MSLS-val, and Nordland. Each dataset presents unique challenges in terms of viewpoint changes, environmental conditions, and perceptual aliasing. The table shows the recall@1, recall@5, and recall@10 for each method, indicating the percentage of queries where at least one of the top N retrieved images is within a predefined distance threshold of the ground truth. The descriptor dimensionality of each method is also included, highlighting SuperVLAD’s compactness. Two-stage methods, which typically re-rank initial candidates using local features, are excluded due to their different descriptor dimensions.
read the caption
Table 2: Comparison to state-of-the-art methods on four VPR benchmark datasets. The best results are highlighted in bold and the second are underlined. The descriptor dimensionalities of two-stage methods are not displayed.
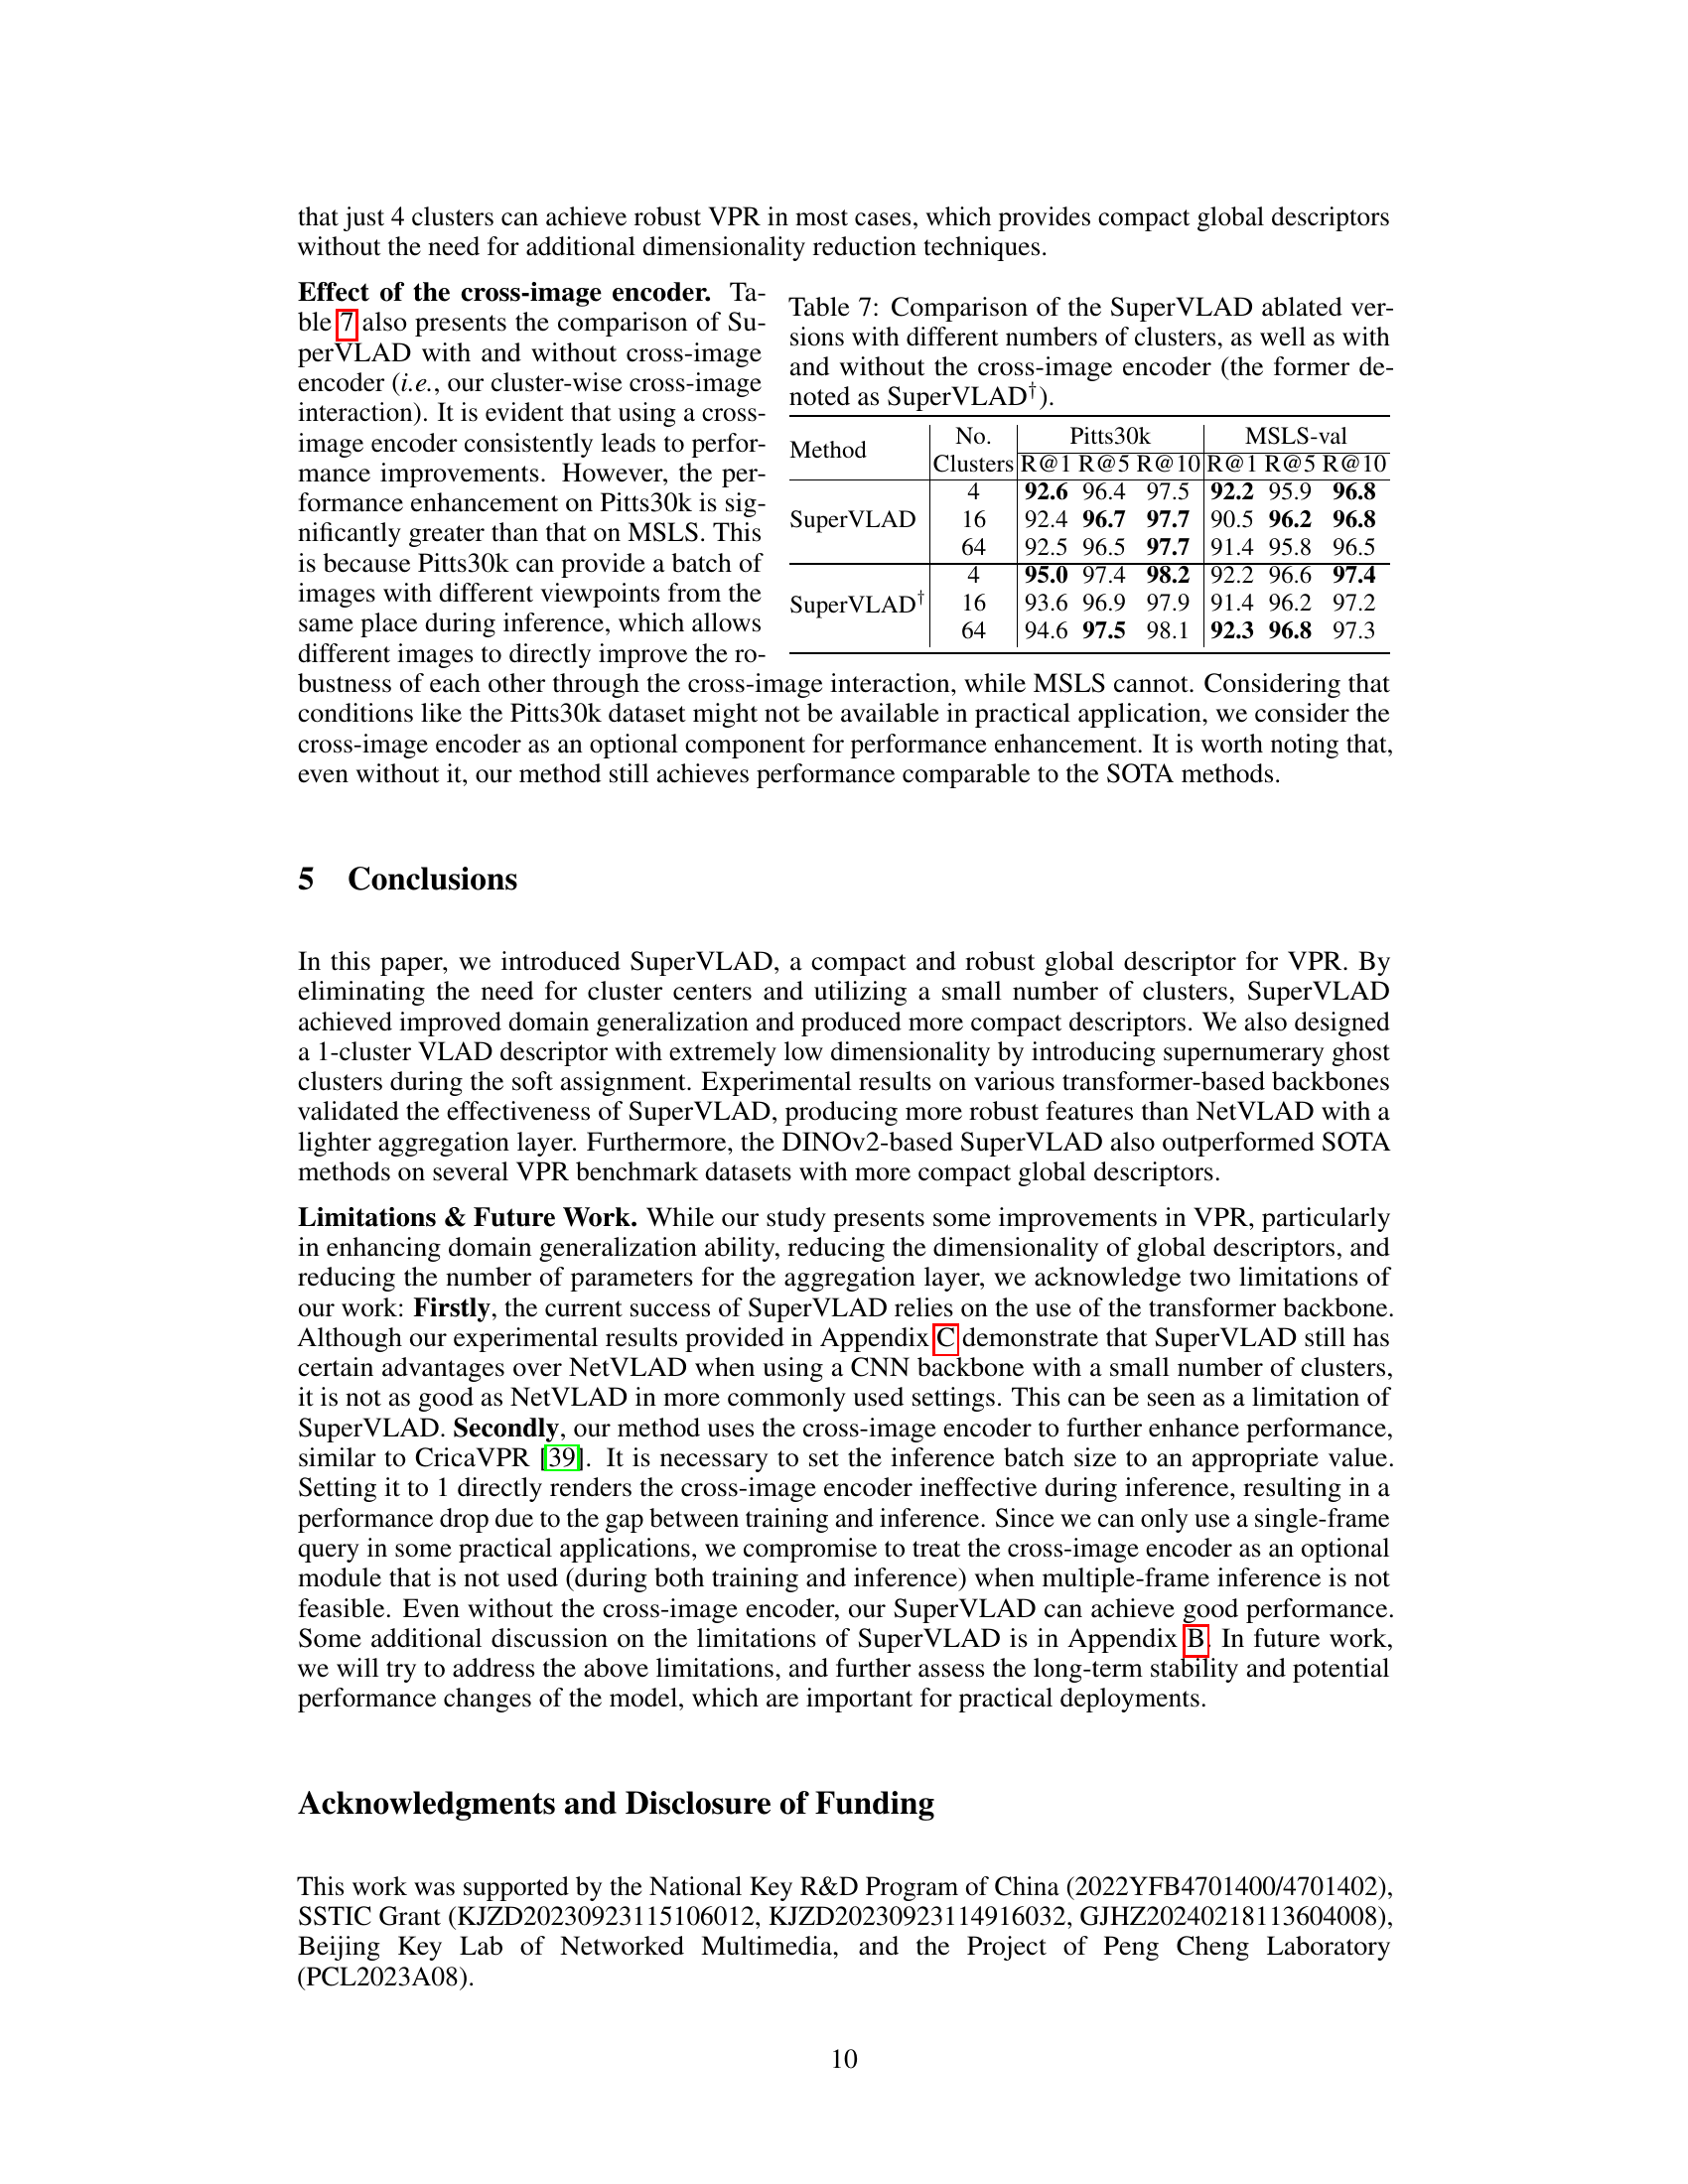
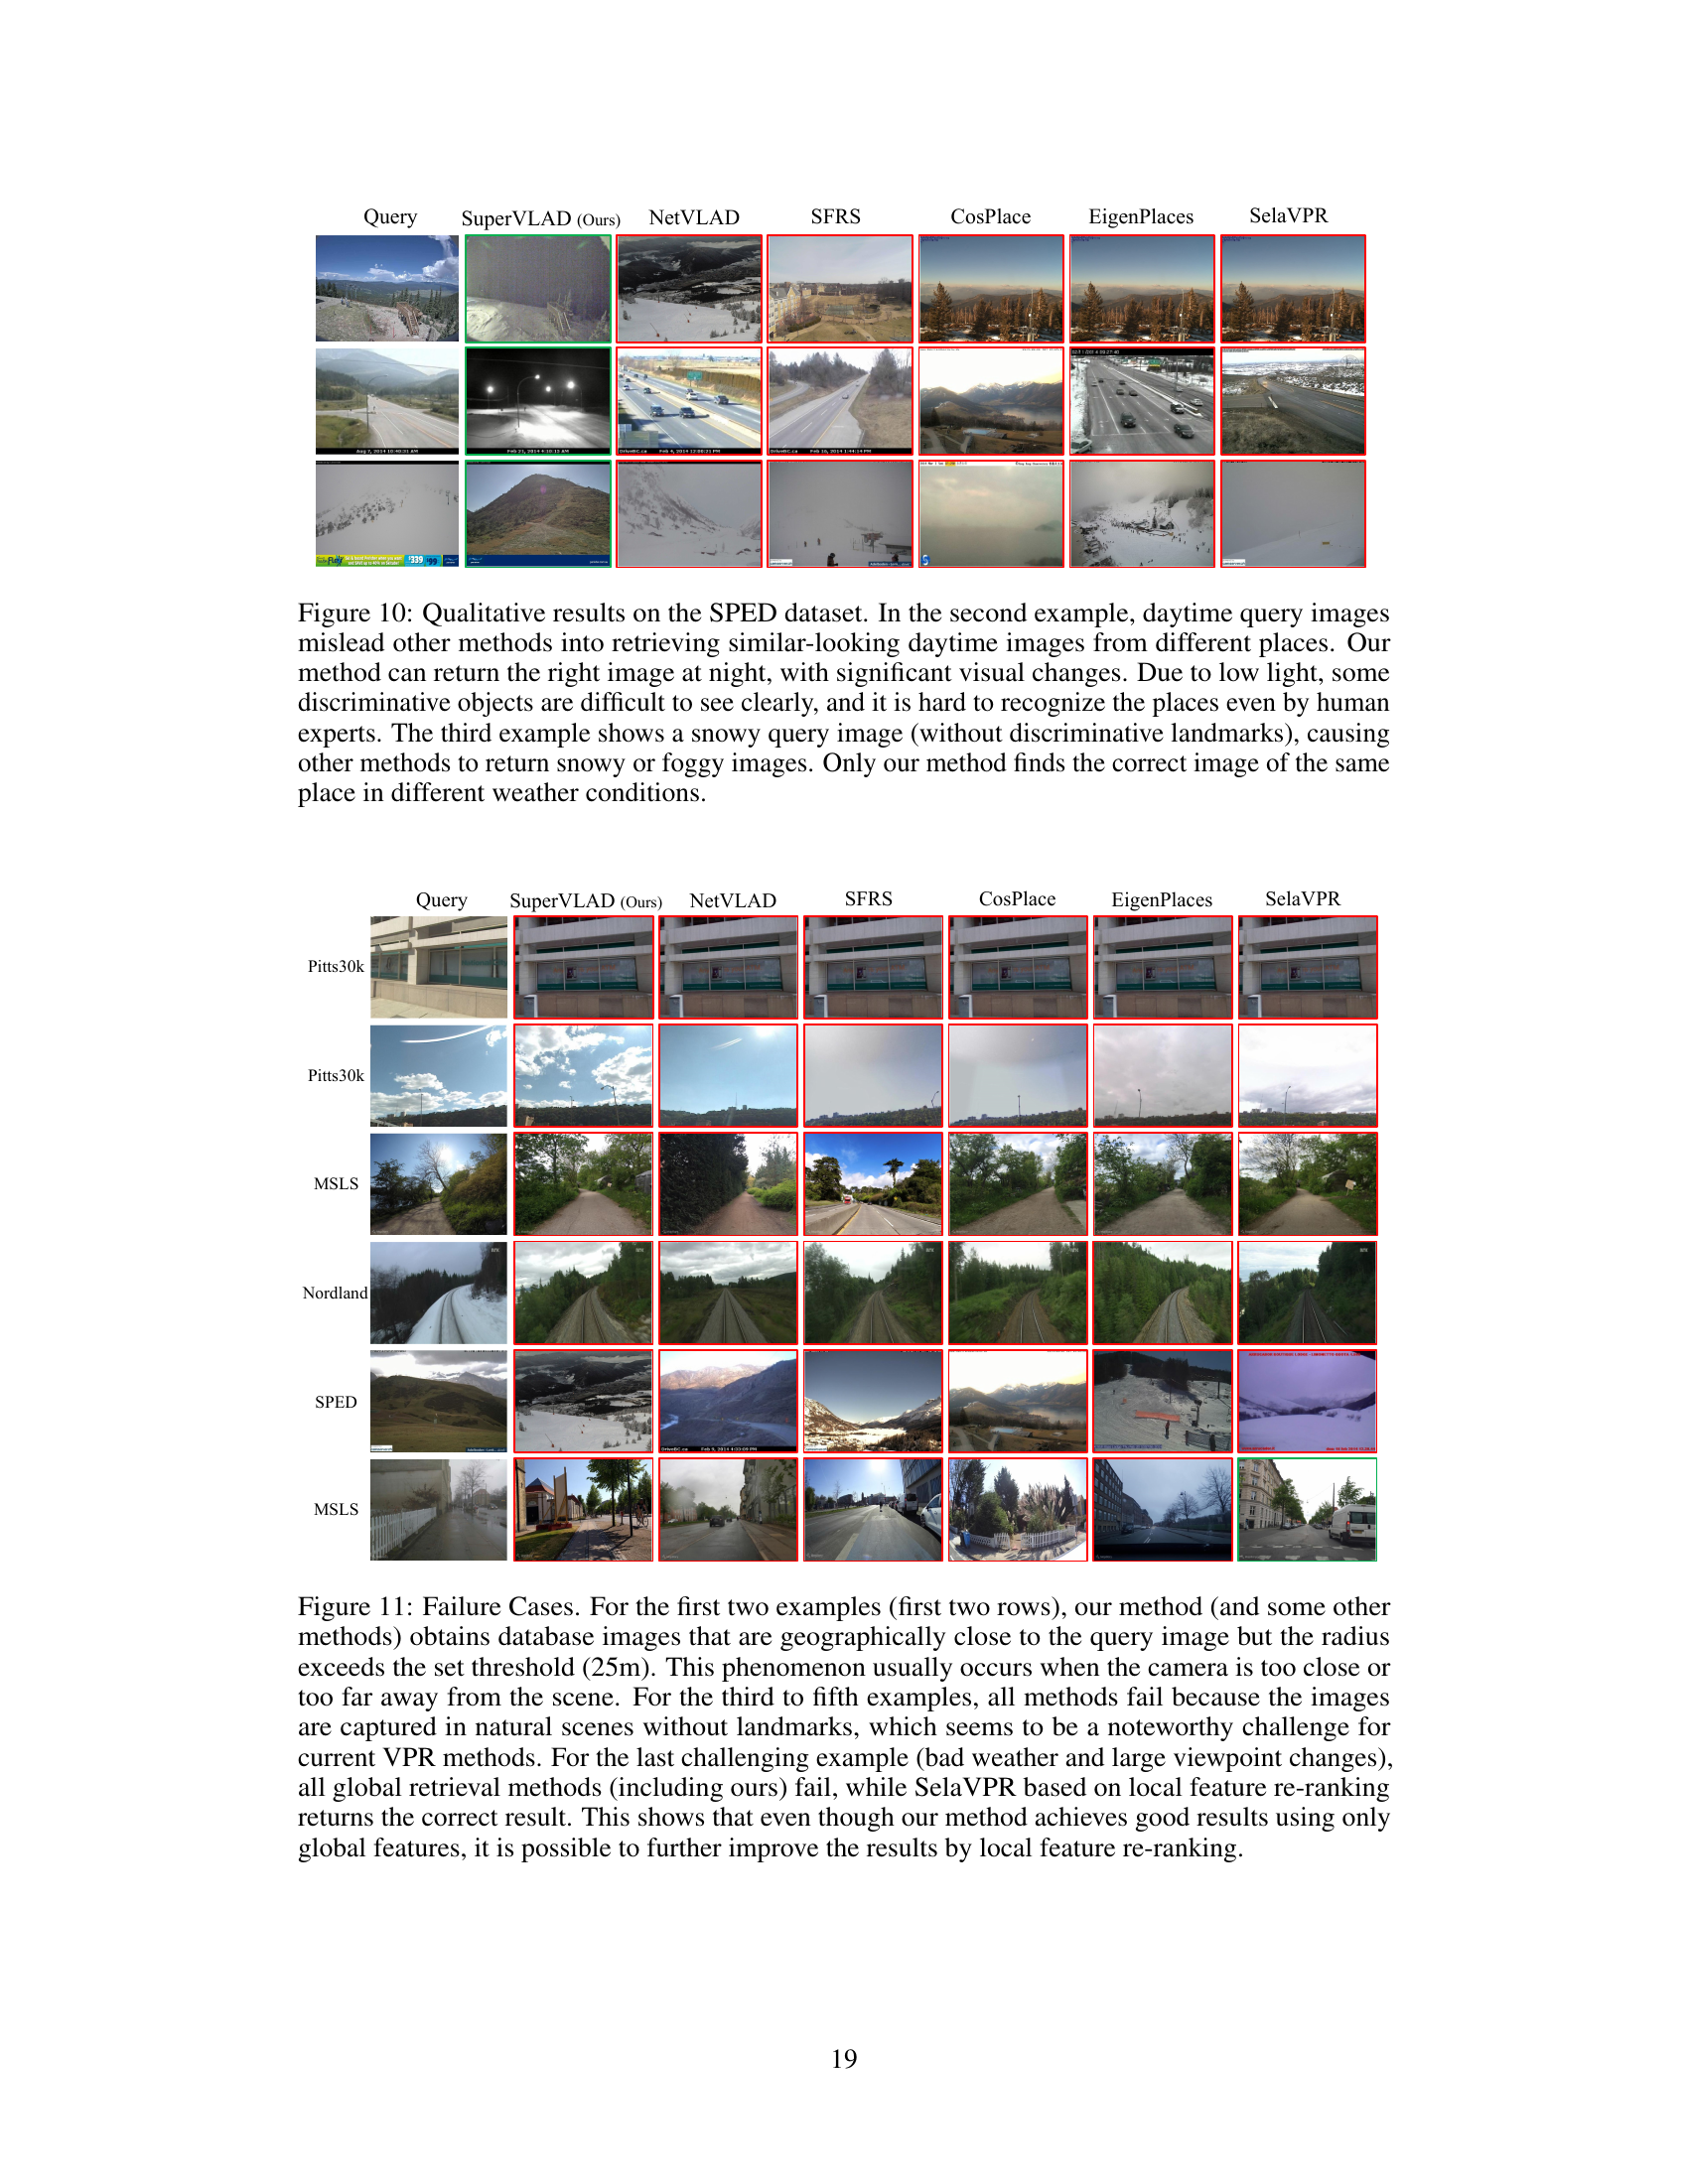
Full paper#