↗ OpenReview ↗ NeurIPS Homepage ↗ Chat
TL;DR#
Hyperparameter optimization (HPO) is crucial for machine learning, but current methods often rely on fixed data splits during model evaluation which can lead to overfitting. This paper introduces a simple yet effective technique called reshuffling, where data splits are randomly reassigned for every hyperparameter configuration evaluated. This approach is shown to improve model generalization, especially with holdout validation, challenging the traditional approach.
The study combines theoretical analysis with extensive simulations and real-world experiments. The theoretical findings connect the benefits of reshuffling to the inherent characteristics of the HPO problem, such as signal-to-noise ratio and the shape of the loss function. The experimental results demonstrate that reshuffling significantly boosts performance, making holdout validation a competitive alternative to cross-validation while reducing computational cost.
Key Takeaways#
Why does it matter?#
This paper is crucial for researchers in hyperparameter optimization (HPO). It challenges the common practice of using fixed data splits, offering a computationally cheaper and often superior alternative that improves model generalization. The theoretical analysis and large-scale experiments provide strong support for adopting reshuffling in HPO workflows, opening new avenues for improving HPO efficiency and effectiveness.
Visual Insights#

This figure shows two examples of how reshuffling affects the empirical loss surface. In the left panel (high signal-to-noise ratio), reshuffling results in a worse minimizer because the empirical loss surface is a very noisy approximation of the true loss surface. In the right panel (low signal-to-noise ratio), reshuffling results in a better minimizer because the empirical loss surface is a less noisy approximation of the true loss surface. The true loss function is shown as a black curve in both panels. The empirical loss functions with and without reshuffling are shown as light blue and dashed light blue curves respectively.

This table shows the parameterizations of the variance (σ²) and correlation (τ²) terms in Equation (1) for different resampling methods. These parameters relate to how reshuffling affects the empirical loss surface in hyperparameter optimization. The table lists values for holdout, reshuffled holdout, M-fold cross-validation, reshuffled M-fold cross-validation, M-fold holdout (subsampling/Monte Carlo CV), and reshuffled M-fold holdout. Appendix E provides detailed derivations of these parameterizations.
In-depth insights#
HPO Generalization#
HPO generalization focuses on improving the ability of hyperparameter optimization (HPO) methods to select hyperparameter configurations that generalize well to unseen data. Standard HPO often overfits to the validation set, leading to poor generalization. This paper investigates the effect of reshuffling resampling splits (train-validation splits or cross-validation folds) during HPO. The key finding is that reshuffling frequently improves the final model’s generalization performance. This is because reshuffling reduces overfitting by decorrelating the validation loss surface, leading to a less noisy and more representative loss landscape. The authors support this claim with theoretical analysis and large-scale experiments. Reshuffling is particularly beneficial for holdout validation, often making it competitive with computationally more expensive cross-validation methods. While the benefits are theoretically linked to low-signal, high-noise optimization problems, empirical results show consistent improvements across a range of settings. The work highlights a simple yet powerful technique to boost HPO’s generalization capability.
Resampling Splits#
The concept of ‘resampling splits’ in hyperparameter optimization (HPO) is crucial for evaluating model performance and guiding the search for optimal hyperparameters. Standard practices often involve fixed splits, such as a single train-validation split or a fixed cross-validation scheme, creating paired resampling. This paper challenges that convention, demonstrating that reshuffling splits for every hyperparameter configuration often improves generalization performance. This unexpected result highlights how fixed splits can inadvertently bias the optimization process, leading to overfitting to specific data partitions. Reshuffling introduces more variability, which helps the optimization algorithm explore a broader range of model behaviors and find solutions that generalize better. The paper provides a theoretical justification that connects the benefits of reshuffling to the noise and signal in the optimization problem. Experimental evidence shows reshuffling’s impact, especially for holdout methods, sometimes making them comparable to more computationally expensive cross-validation techniques.
Theoretical Analysis#
The theoretical analysis section of this research paper appears crucial for validating the claims about reshuffling resampling splits. It likely involves a rigorous mathematical framework to explain how reshuffling affects the asymptotic behavior of the validation loss surface. Key aspects might include deriving bounds on the expected regret, potentially using concepts from probability theory and statistical learning. The analysis likely connects the potential benefits of reshuffling to the characteristics of the underlying optimization problem, such as signal-to-noise ratio and the loss function’s curvature. This rigorous approach provides a theoretical foundation for the empirical findings, enhancing the paper’s overall credibility and impact by establishing a cause-and-effect relationship between reshuffling and improved generalization.
Benchmark Results#
The benchmark results section would ideally present a robust evaluation of the proposed reshuffling technique against existing HPO methods. Key aspects to consider would include comparing generalization performance on unseen data across various datasets, learning algorithms (e.g., random forest, SVM, neural networks), and hyperparameter optimization strategies (e.g., random search, Bayesian optimization). Statistical significance testing should be used to determine if any observed performance gains are significant. The analysis needs to consider the trade-off between the computational cost of reshuffling (more computational cost due to re-shuffling for each hyperparameter configuration) and potential improvements in generalization performance. Crucially, the results should demonstrate whether reshuffling consistently improves generalization, especially for holdout scenarios, and potentially reveals if improvements are algorithm or dataset-dependent. Clear visualizations of performance metrics (e.g., ROC AUC, accuracy, log-loss), error bars, and statistical significance markers (e.g., p-values, confidence intervals) are essential for effective communication. The discussion should also address any limitations, such as potential biases or unexpected behavior under specific conditions, and suggest future research directions based on the findings. Overall, a successful benchmark section must rigorously demonstrate the practical advantages of reshuffling while acknowledging potential drawbacks.
Future Directions#
Future research could explore extending the theoretical analysis to more complex scenarios, such as non-i.i.d data or more complex loss functions, to gain a deeper understanding of how reshuffling impacts generalization performance. Investigating the interaction between reshuffling and different HPO algorithms, beyond random search and Bayesian Optimization, is crucial. Empirically evaluating the technique on a broader range of datasets and learning tasks is needed to confirm its robustness and applicability. Furthermore, researchers could explore adaptive resampling strategies that dynamically adjust the reshuffling rate based on the characteristics of the loss landscape. This could lead to more efficient and effective hyperparameter optimization. Finally, investigating the effect of reshuffling on different performance metrics beyond ROC AUC, such as precision-recall curves or F1-scores, would provide a more holistic understanding of the technique’s impact.
More visual insights#
More on figures

This figure visualizes the results of a simulation study conducted to investigate the effects of reshuffling resampling splits during hyperparameter optimization. The study systematically varied three key parameters: the curvature of the loss surface (m), the correlation strength of the noise (κ), and the extent of reshuffling (τ). The true risk (the generalization error of the model trained using the chosen hyperparameter configuration) is shown for each combination of parameters. The results show that reshuffling is particularly beneficial when the loss surface is flat (small m) and the noise is weakly correlated (large κ).

The figure shows the average test performance over time for different resampling strategies (holdout, 5-fold CV, 5-fold holdout, 5x5-fold CV) with and without reshuffling. The x-axis represents the number of hyperparameter configuration evaluations, and the y-axis represents the negative ROC AUC (a lower value indicates better performance). Shaded areas show the standard error of the mean performance across multiple replications. The figure illustrates how reshuffling can improve the final test performance, especially for holdout.

This figure shows the trade-off between computational cost (number of model fits) and test performance for various resampling strategies. It compares the standard and reshuffled versions of holdout, 5-fold CV, 5-fold holdout, and 5x5-fold CV. The results are averaged across multiple tasks, learning algorithms, and replications for different training/validation set sizes. The shaded areas represent the standard errors, indicating the uncertainty in the measurements. The figure demonstrates that reshuffled holdout often achieves test performance comparable to the more computationally expensive 5-fold CV.

This figure shows the trade-off between computational cost (number of model fits) and the final test performance achieved by different resampling strategies. It compares standard and reshuffled versions of holdout, 5-fold CV, 5-fold holdout, and 5x5-fold CV across different dataset sizes. The results indicate that reshuffled holdout can achieve performance comparable to more computationally expensive 5-fold CV methods.

This figure shows the trade-off between computational cost (number of model fits) and performance (normalized AUC-ROC) for different resampling strategies in hyperparameter optimization using random search. It compares the performance of holdout, 5-fold CV, 5-fold holdout, and 5x5-fold CV, both with and without reshuffling. The results are averaged across multiple tasks, learning algorithms, and replications. The plot reveals the impact of resampling and reshuffling on both computational cost and generalization performance for various training dataset sizes.

The figure shows the mean true risk of the configuration that minimizes the observed objective in a simulation study, systematically varying curvature, correlation strength of noise, and the extent of reshuffling. Lower curvature, lower correlation and more reshuffling generally leads to better true risk. The error bars indicate the standard error of the mean.
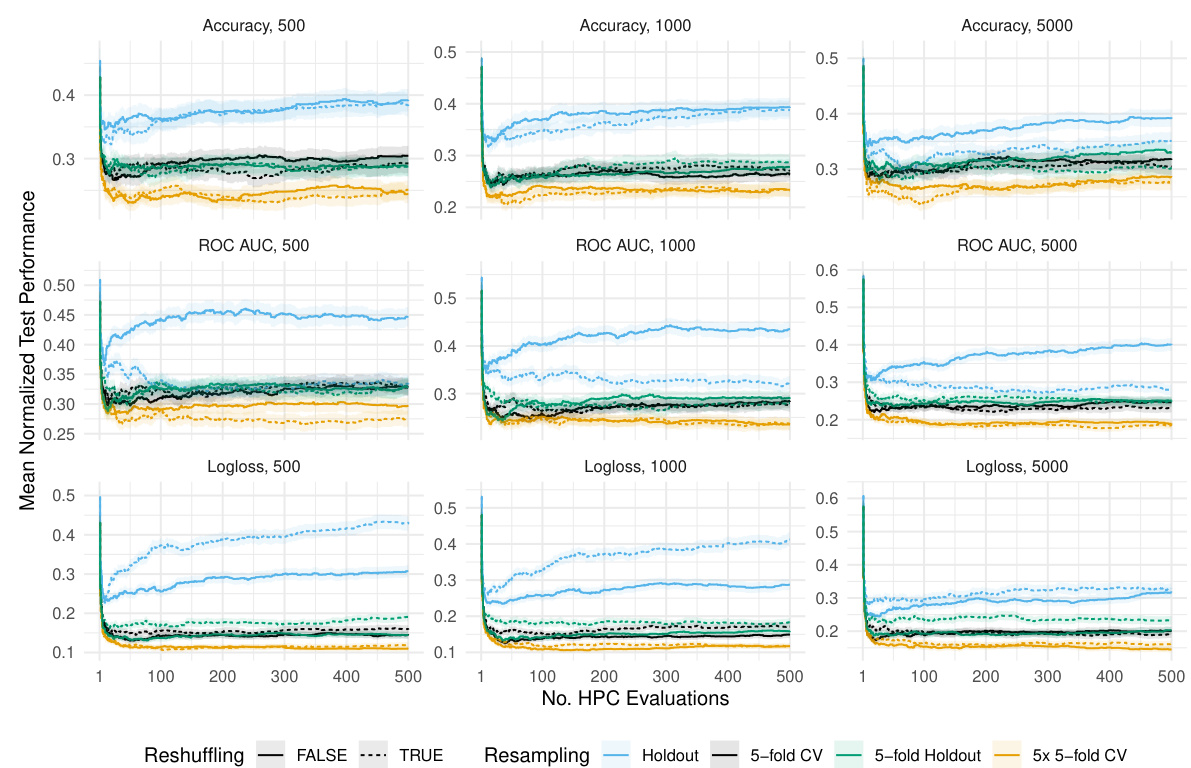
The figure shows how the test performance of the best hyperparameter configuration found so far (incumbent) changes during the hyperparameter optimization process using different resampling strategies. The x-axis represents the number of hyperparameter configurations evaluated, and the y-axis represents the test performance. Each colored line represents a different resampling method, and the shaded area represents the standard error. The figure demonstrates the performance on dataset ‘albert’ for different sizes of the training and validation sets.

This figure displays the results of a simulation study investigating the effects of reshuffling on the true risk of the configuration minimizing the observed objective during hyperparameter optimization. The x-axis represents the reshuffling parameter τ, ranging from 0 to 1 (1 being no reshuffling). The y-axis represents the mean true risk. Different lines and colors represent different combinations of curvature (m) and correlation (κ). The results show that reshuffling can be beneficial for loss surfaces with low curvature when noise is not strongly correlated, confirming the theoretical insights.
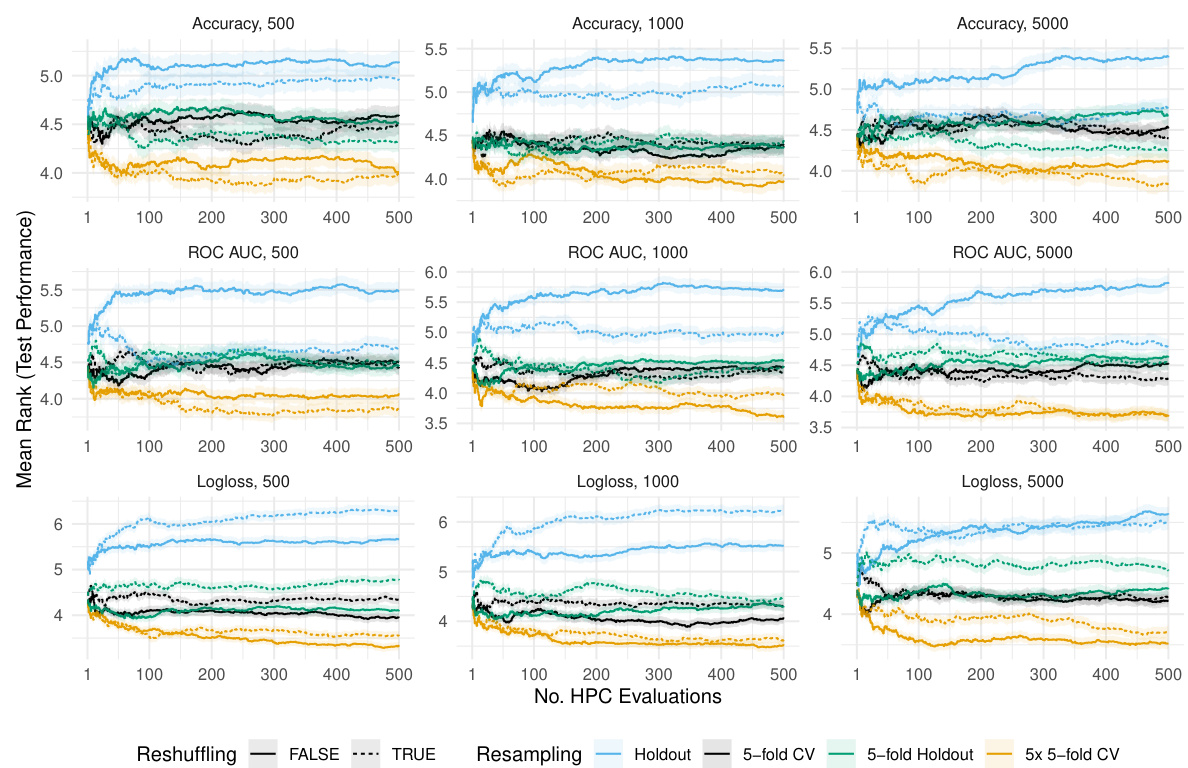
The figure shows the results of a simulation study conducted to test the theoretical understanding of the potential benefits of reshuffling resampling splits during HPO. The mean true risk (lower is better) of the configuration that minimizes the observed objective function is plotted against the reshuffling parameter (τ). The study systematically varied the curvature of the loss surface (m), the correlation strength of the noise (κ), and the extent of reshuffling (τ). The results show that, for a loss surface with low curvature, reshuffling is beneficial as long as the noise process is not too correlated. As the noise process becomes more strongly correlated, reshuffling starts to hurt the optimization performance. When the loss surface has high curvature, reshuffling starts to hurt optimization performance when correlation in the noise is weaker.

This figure shows the relationship between the number of model fits and the test performance for various resampling strategies with and without reshuffling. The results are averaged over different tasks, learning algorithms, and replications, and are shown separately for different train-validation set sizes. It illustrates the trade-off between computational cost and performance. Notably, the reshuffled holdout achieves a test performance close to that of the more expensive 5-fold CV.

This figure displays the average test performance, measured using negative ROC AUC, of the best-performing hyperparameter configuration found so far (the incumbent) during the hyperparameter optimization process. The optimization was performed using XGBoost on the ‘albert’ dataset. The x-axis shows the number of hyperparameter configurations evaluated, and the y-axis represents the average test performance. Separate lines are shown for different train-validation set sizes (n): 500, 1000, and 5000. Shaded areas indicate standard errors, providing a measure of the variability in the performance results. The figure illustrates how test performance changes over time and across different train/validation data sizes, and whether reshuffling the train-validation split affects the results. It shows that the reshuffling does not have a strong impact for large train-validation data sizes.

This figure shows how the average test performance (measured by negative ROC AUC) of the best hyperparameter configuration found so far changes over the course of hyperparameter optimization (HPO) for the XGBoost algorithm on the ‘albert’ dataset. The x-axis represents the number of hyperparameter configurations evaluated, and the y-axis represents the average test performance. The figure is broken down into three columns, each representing a different size of training data used in the HPO (n = 500, 1000, and 5000). Each column shows two lines, one for when resampling splits were reshuffled during HPO (TRUE) and one for when they were not (FALSE). The shaded regions represent the standard errors associated with the average test performance. The figure illustrates the relative impact of reshuffling and training data size on the test performance.

This figure displays a comparison of different resampling techniques (holdout, 5-fold CV, 5-fold holdout, 5x5-fold CV) in hyperparameter optimization, with and without reshuffling. The x-axis represents the number of model fits required, reflecting computational cost. The y-axis shows the average normalized test performance (AUC-ROC), indicating generalization ability. The figure demonstrates the trade-off between computational cost and performance, showcasing that reshuffling can often improve performance without a significant increase in cost, particularly for holdout.

This figure compares the performance of three different hyperparameter optimization (HPO) algorithms: HEBO, SMAC3, and random search. The algorithms are tested on a holdout validation scheme with different dataset sizes (n). The y-axis shows the average normalized validation performance (ROC AUC), and the x-axis represents the number of hyperparameter configuration evaluations. Shaded regions represent standard errors, indicating the variability of the results.

This figure shows the test performance of XGBoost on the ‘albert’ dataset for different training and validation set sizes (n). It compares the performance of models trained with different hyperparameter optimization (HPO) strategies: holdout, 5-fold cross-validation (CV), 5-fold holdout, and 5x5-fold CV. Both standard and reshuffled versions of each strategy are evaluated. The shaded areas indicate standard errors. The key takeaway is that the reshuffled strategies often lead to more stable and comparable test performance across different training sizes. There is an improvement in the reshuffled holdout test performance compared to the standard holdout, demonstrating the practical benefit of reshuffling.

This figure shows the relative improvement in test ROC AUC performance when using different resampling techniques compared to the standard 5-fold cross-validation (CV). The improvement is shown separately for different training/validation dataset sizes (n). It illustrates how much better test performance is achieved using various resampling methods, including reshuffled versions of holdout, 5-fold CV, and 5-fold holdout, against the standard 5-fold CV. Shaded regions represent the standard errors, showing the variability of the results.

This figure shows the trade-off between computational cost (number of model fits) and performance (AUC-ROC). It compares different resampling strategies (holdout, 5-fold CV, 5-fold holdout, 5x5-fold CV), both with and without reshuffling. The results are averaged across multiple tasks, learning algorithms, and replications, and are shown separately for different training data sizes (n). The plot reveals that reshuffled holdout can achieve performance comparable to more computationally expensive methods like 5-fold CV.

This figure shows the results of a simulation study designed to test the theoretical understanding of reshuffling’s effects during hyperparameter optimization. The simulation uses a univariate quadratic loss surface with added noise, allowing systematic investigation of how curvature, noise correlation, and reshuffling affect optimization performance. The results show that for loss surfaces with low curvature, reshuffling is beneficial as long as the noise is not highly correlated. High curvature surfaces show that reshuffling hurts optimization performance. This simulation supports the theory that reshuffling is most beneficial when the loss surface is flat and the noise is not strongly correlated.

This figure shows the results of a simulation study on the effect of reshuffling on hyperparameter optimization. The true risk (the generalization error of the best hyperparameter configuration found by the algorithm) is plotted against the reshuffling parameter (τ). The curvature of the loss surface (m) and the correlation strength of the noise (κ) are also varied, demonstrating how different factors affect the usefulness of reshuffling. Lower values of true risk are better, indicating that reshuffling can significantly improve the performance of hyperparameter optimization, especially when the loss surface is relatively flat and the noise is weakly correlated.

This figure shows the trade-off between the computational cost (number of model fits) and the test performance for various resampling strategies. It compares the performance of holdout, 5-fold CV, 5-fold holdout, and 5x5-fold CV, both with and without reshuffling. The results are averaged across different tasks, learning algorithms, and replications, and are shown for different training/validation set sizes (n). Shaded regions represent standard errors, illustrating variability in the results. The key takeaway is that reshuffled holdout often achieves performance comparable to more expensive methods like 5-fold CV but with a significantly lower computational cost.

This figure shows the trade-off between computational cost (number of model fits) and test performance for various resampling methods. It compares standard and reshuffled versions of holdout, 5-fold CV, 5-fold holdout and 5x5-fold CV, across different training set sizes. The results suggest that reshuffled holdout can achieve similar test performance to 5-fold CV but with significantly fewer model fits, highlighting its computational efficiency.

This figure compares the performance of three hyperparameter optimization (HPO) algorithms: HEBO, SMAC3, and random search, when using a holdout validation strategy. The performance is measured using the area under the ROC curve (AUC) and is averaged across various tasks, learners, and replications. The results are shown separately for different training and validation dataset sizes (n). Shaded regions in the figure represent standard errors, indicating the uncertainty in the performance estimates.

This figure shows the trade-off between computational cost (number of model fits) and test performance for various resampling strategies in hyperparameter optimization using random search. It compares fixed and reshuffled versions of holdout, 5-fold CV, 5-fold holdout, and 5x5-fold CV across different training dataset sizes. The results indicate that reshuffled holdout often achieves test performance comparable to more computationally expensive methods like 5-fold CV.

This figure shows the test performance (negative ROC AUC) over time, for the best model found so far (incumbent), trained on different training set sizes (500, 1000, 5000). It compares the standard 5-fold cross-validation (CV) approach to holdout, 5-fold holdout, and 5x5-fold CV, both with and without reshuffling the data splits for each hyperparameter configuration. The shaded areas represent the standard errors, showing the variability in performance.

This figure displays the test performance of the best hyperparameter configuration found so far during hyperparameter optimization (HPO) over the number of HPO iterations. The experiment uses the XGBoost algorithm on the ‘albert’ dataset, with varying training dataset sizes (n = 500, 1000, 5000). The plot compares two different resampling strategies: standard 5-fold cross-validation (CV) and reshuffled 5-fold CV. The shaded areas represent the standard error, indicating the variability of the results across multiple runs of the HPO process. The results suggest that reshuffling the splits slightly improves performance, particularly noticeable at higher training set sizes.

This figure shows the result of the random search algorithm. The y-axis represents the mean normalized validation performance for three different metrics: Accuracy, ROC AUC, and Logloss. The x-axis represents the number of hyperparameter configurations (HPCs) evaluated. The figure is divided into three panels based on the training and validation data size (n). Each panel further shows results for different resampling methods (Holdout, 1-fold, 2-fold, 3-fold, 4-fold, and 5-fold), with each resampling method shown with and without reshuffling. The shaded areas represent standard errors. This visual helps illustrate how reshuffling and varying the number of folds in resampling affect the validation performance in different settings.
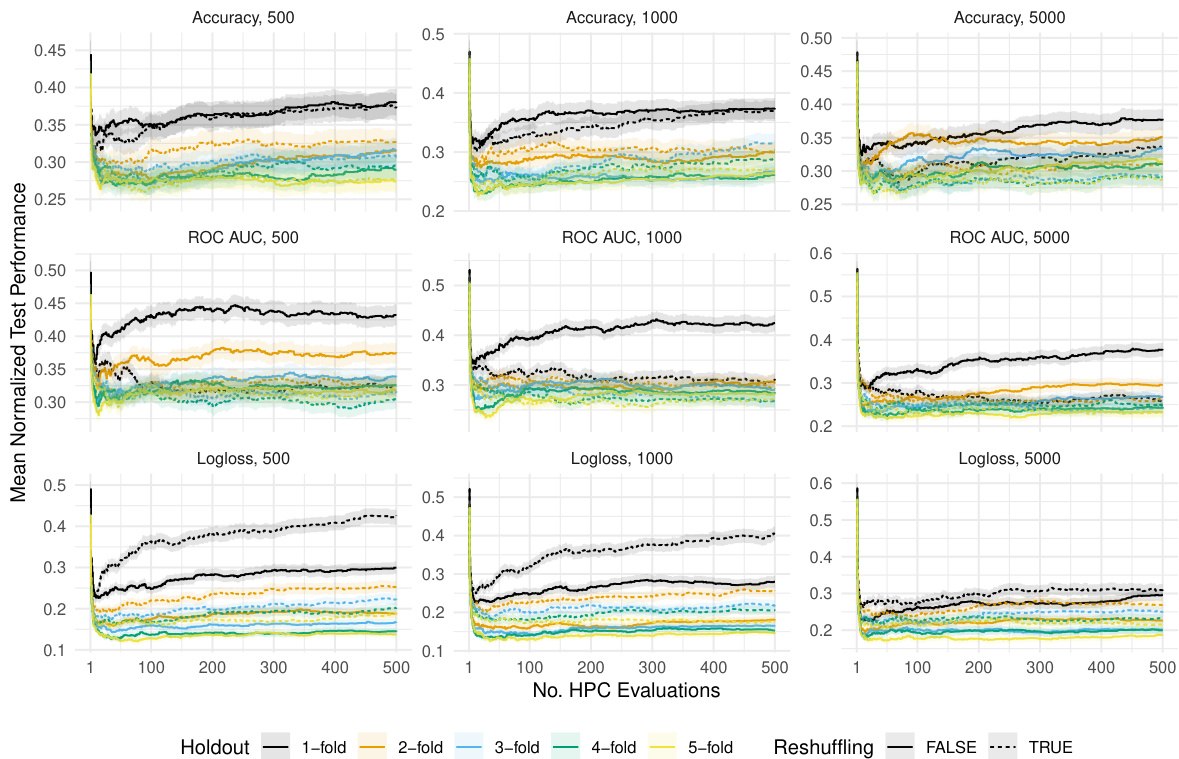
This figure displays the results of a simulation study exploring the impact of reshuffling on hyperparameter optimization performance. The mean true risk of the selected configuration is plotted against the reshuffling parameter (τ), for various levels of loss surface curvature (m) and noise correlation (κ). Lower curvature and weaker correlation generally benefit from reshuffling, while the opposite is true for high curvature and strong correlation. Error bars represent the standard error of the mean.
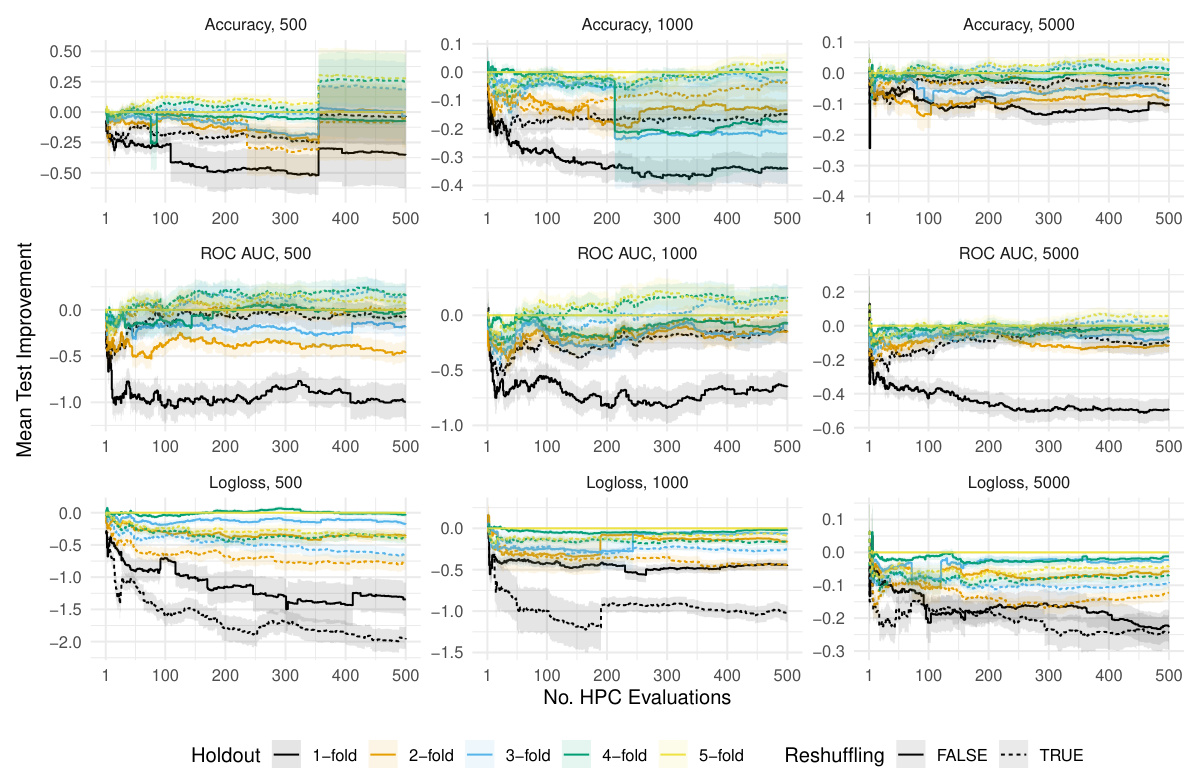
This figure shows the results of a simulation study designed to test the theoretical understanding of the potential benefits of reshuffling resampling splits during hyperparameter optimization. The study used a univariate quadratic loss surface function with added noise, varying parameters controlling curvature (m), noise correlation (κ), and the extent of reshuffling (τ). The plot shows the mean true risk (lower is better) of the configuration that minimizes the observed objective for different combinations of these parameters. Lower values of τ indicate more reshuffling, and the results demonstrate how reshuffling can be beneficial in scenarios of low curvature and weak correlation.
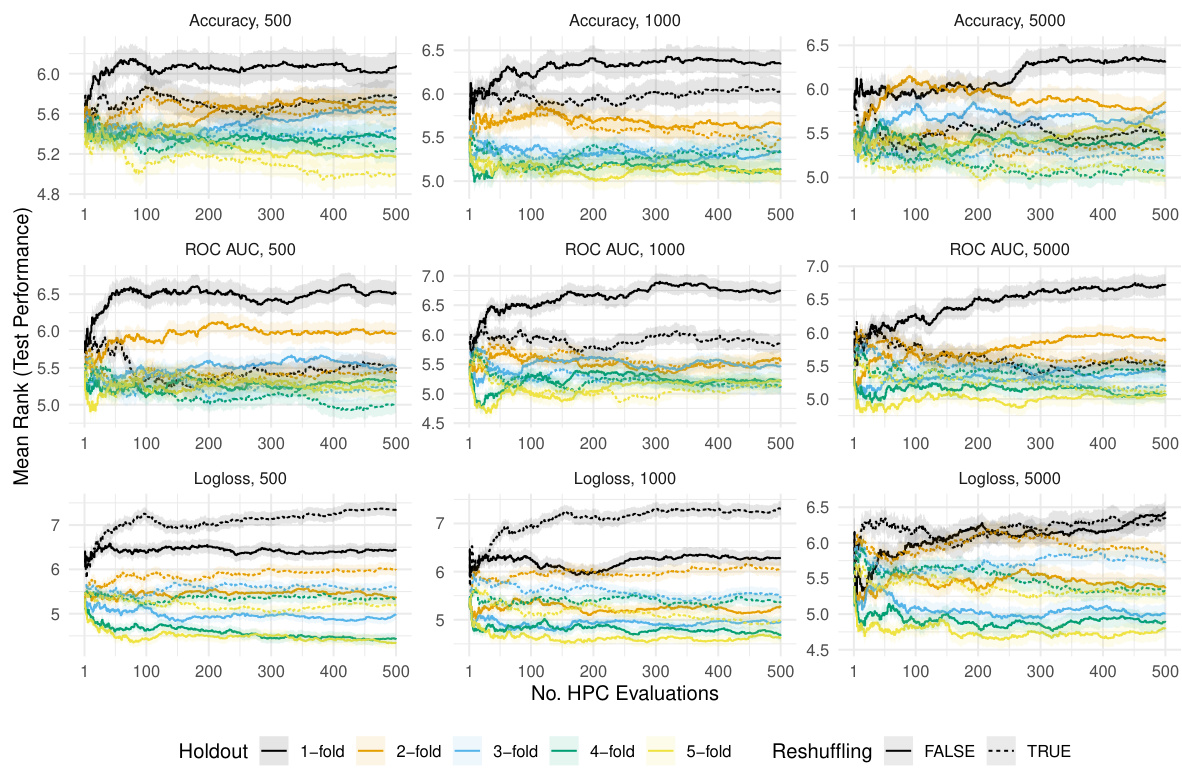
This figure shows the results of the random search algorithm for different train-validation sizes (500, 1000, 5000). It compares the performance of different resampling strategies (holdout, 1-fold to 5-fold) both with and without reshuffling, against the standard 5-fold holdout strategy. The improvement in test performance (Accuracy, ROC AUC, and Logloss) is shown with respect to the standard 5-fold holdout. Shaded areas represent standard errors, illustrating the variability of the results.
More on tables

This table shows exemplary parameterizations for the equation (1) that is used to calculate the resampling-related component of the validation loss covariance. It presents values for σ² (increase in variance) and τ² (decrease in correlation) for different resampling methods (holdout, reshuffled holdout, M-fold CV, reshuffled M-fold CV, M-fold holdout, reshuffled M-fold holdout). The parameters σ² and τ² describe the behavior of the loss surface affected by reshuffling, and a precise computation is provided in the appendix.

This table summarizes how resampling is handled in various popular HPO libraries and software. It indicates whether each library uses reshuffling (a technique where the training and validation splits are changed for each hyperparameter configuration) or uses fixed resampling splits. A checkmark indicates that reshuffling is explicitly used in the core functionality or examples, a question mark denotes ambiguity or inconsistency across examples and core functionality, and an ‘X’ represents the absence of reshuffling. The table highlights the overall lack of attention to reshuffling techniques in common HPO tools.

This table lists the ten datasets used in the benchmark experiments of the paper. Each dataset is identified by its OpenML ID, name, and size (number of instances x number of features). These datasets represent a variety of classification tasks and are used to evaluate the performance of different hyperparameter optimization strategies. The table provides a summary of the characteristics of each dataset, allowing for a better understanding of the experimental context and the potential challenges posed by each.

This table presents the search space used for hyperparameter optimization (HPO) of a funnel-shaped Multilayer Perceptron (MLP) classifier. It lists each hyperparameter, its data type (integer or numerical), the range of values it can take, and whether a logarithmic scale was used for the search.

This table shows exemplary parametrizations used in Equation (1) for various resampling methods. Each method (holdout, reshuffled holdout, M-fold CV, reshuffled M-fold CV, M-fold holdout, reshuffled M-fold holdout) is characterized by its σ² and τ² values, which quantify the variance increase and correlation decrease in the loss surface due to the resampling strategy. Appendix E provides more details on the derivation of these parameters.
This table shows exemplary parametrizations for Equation (1) in the paper, which describes how reshuffling affects the loss surface in hyperparameter optimization. It provides values for σ², τ², and 1/α for different resampling methods (holdout, reshuffled holdout, M-fold CV, reshuffled M-fold CV, M-fold holdout, and reshuffled M-fold holdout). These parameters quantify the increase in variance and the decrease in correlation of the loss surface due to reshuffling, which are important factors influencing the effectiveness of the reshuffling technique. Details of the calculations are provided in Appendix E.

This table presents the hyperparameter search space used for the CatBoost classifier in the benchmark experiments. It lists three hyperparameters: learning_rate, depth, and l2_leaf_reg, along with their data type (numerical or integer), range of values, and whether a logarithmic scale was used for the range.
Full paper#


