TL;DR#
Unsupervised domain adaptation (UDA) is crucial for time series analysis, but existing methods often struggle to fully exploit both temporal and frequency information. The challenge lies in the inherent differences between these feature types: frequency features exhibit better discriminative power within a specific domain, while temporal features demonstrate greater transferability across domains. This makes it challenging to develop a robust model that can accurately generalize across different time series datasets.
To overcome this limitation, the researchers propose Adversarial CO-learning Networks (ACON). ACON employs a three-pronged strategy: multi-period frequency feature learning to enhance the discriminative power of frequency features, temporal-frequency domain mutual learning to improve the discriminability of temporal features and transferability of frequency features, and domain adversarial learning within a correlation subspace to further enhance feature transferability. Extensive experiments demonstrate that ACON outperforms existing methods, achieving state-of-the-art results.
Key Takeaways#
Why does it matter?#
This paper is important because it addresses a critical challenge in time series domain adaptation by proposing a novel method (ACON) that effectively leverages both temporal and frequency features. ACON’s superior performance on various datasets and applications demonstrates its practical value and opens new avenues for research in transferable representation learning. This is highly relevant to researchers working with real-world time series data, which often suffers from domain shift issues.
Visual Insights#

🔼 This figure shows the discriminative power of frequency features compared to temporal features. Panel (a) displays EEG data and its frequency transform for two sleep stages (Wake and REM), highlighting the clearer separation in the frequency domain. Panel (b) demonstrates higher classification accuracy using frequency features on the source domain. Finally, Panel (c) compares source-only and DANN approaches in both domains on the target domain, indicating superior transferability of temporal features.
read the caption
Figure 1: Discriminability of frequency feature: (a) The Electroencephalography (EEG) signal and corresponding frequency data of two classes in the CAP dataset: Wake and Rapid Eye Movement (REM). (b) Classification on the source domain: Temporal domain vs. Frequency domain. (c) Source-only and DANN: Temporal domain vs. Frequency domain.

🔼 This table presents the average accuracy achieved by different domain adaptation methods across eight datasets and five applications. The methods compared include several state-of-the-art unsupervised domain adaptation (UDA) techniques for time series, as well as some general UDA methods. The results show the performance of each method on various time series classification tasks, providing a comprehensive comparison of their effectiveness.
read the caption
Table 1: Average Accuracy (%) on Eight Datasets and Five Applications for UDA.
In-depth insights#
Freq-Temp Feature Xfer#
The heading ‘Freq-Temp Feature Xfer’ suggests a method for transferring knowledge between frequency and temporal domains in time series analysis. This likely involves a collaborative learning strategy where each domain’s strengths are leveraged to enhance the other’s performance. Frequency features, known for high discriminative power within a specific domain, might be used to improve the discriminability of temporal features, which are typically better at transferring knowledge across different domains. Conversely, the robustness of temporal features across domains could boost the frequency features’ transferability. The core idea is a mutual learning process, making the features more robust and generalizable for time series classification tasks. This approach is likely more effective than simply treating both feature types equally, which is a key improvement over prior methods. The success of this method hinges on the specific implementation of this information transfer, which may involve advanced techniques like adversarial learning or knowledge distillation.
ACON Model Details#
An ACON model, designed for time series domain adaptation, would likely involve a multi-stage architecture. Multi-period frequency feature learning would be a crucial initial step, segmenting the time series based on dominant periodicities to enhance frequency feature discriminability. Subsequently, a temporal-frequency domain mutual learning module would foster collaboration between the two feature types. This module might utilize knowledge distillation, transferring knowledge from the more discriminative frequency features to the more transferable temporal features in the source domain, and vice-versa in the target domain. Finally, a domain adversarial learning component would operate within the correlation subspaces of the temporal and frequency features, rather than the raw feature spaces, to improve the transferability of learned representations. The choice of backbones (e.g., CNNs, LSTMs, or transformers) for feature extraction within each domain would depend on the specific characteristics of the time series data. The effectiveness of ACON hinges on its ability to effectively leverage both temporal and frequency information, resulting in enhanced discriminability and transferability.
Multi-periodicity Focus#
The concept of ‘Multi-periodicity Focus’ in time series analysis highlights the importance of considering the multiple periodic components present within a time series. Instead of treating a time series as having a single dominant frequency, a multi-periodicity approach acknowledges that real-world time series often exhibit complex patterns with multiple recurring cycles at various frequencies and time scales. This approach is crucial because ignoring these multiple periodicities can lead to inaccurate modeling and suboptimal results. A multi-periodicity focus necessitates techniques that can effectively identify and represent these multiple cycles, enhancing the accuracy and interpretability of the analysis. Advanced signal processing methods, such as wavelet transforms or other time-frequency analysis techniques, are often required to capture these nuanced periodic structures. By disentangling and analyzing these different periodic patterns, researchers can gain a deeper understanding of the underlying dynamics of a time series, leading to more effective forecasting and anomaly detection. Furthermore, domain adaptation techniques could be improved by accounting for varying degrees of multi-periodicity across different domains. This would necessitate specialized methods capable of transferring knowledge while preserving these domain-specific periodic characteristics.
UDA Time Series#
Unsupervised domain adaptation (UDA) applied to time series data presents unique challenges and opportunities. Time series’ sequential nature and the presence of both temporal and frequency features require sophisticated techniques to effectively transfer knowledge from a labeled source domain to an unlabeled target domain. A key challenge lies in leveraging the distinct properties of these features: temporal features often exhibit better transferability across domains while frequency features tend to be more discriminative within a specific domain. Successful UDA methods for time series must therefore carefully consider how to combine these feature types to maximize both transferability and discriminability. Adversarial learning and other techniques that address the distribution shift between domains are crucial. The performance of UDA time series methods depends greatly on the choice of feature extractor and classifier architectures, as well as the specific techniques employed for aligning feature representations across domains. Evaluation metrics, beyond simple accuracy, need to account for the unique properties of time series data.
ACON Limitations#
The section ‘ACON Limitations’ would critically analyze the shortcomings of the proposed Adversarial CO-learning Networks (ACON) for time series domain adaptation. A key limitation might be its performance variability in datasets with high variance; ACON’s effectiveness could be significantly impacted by noisy or highly irregular time series data. Another limitation could stem from its computational complexity. The integration of multi-period frequency feature learning, temporal-frequency mutual learning, and domain adversarial learning in the correlation subspace can demand substantial computational resources, particularly when dealing with large datasets or long time series. The discussion should acknowledge the trade-offs between accuracy, transferability, and discriminability, and whether ACON sufficiently balances these competing objectives. Finally, the ‘ACON Limitations’ section should discuss the generalizability of ACON’s approach to various time series datasets and real-world application scenarios, identifying potential areas where performance may be less robust. This thorough analysis of limitations would enhance the paper’s overall credibility and impact.
More visual insights#
More on figures

🔼 The figure illustrates the architecture of the Adversarial CO-learning Networks (ACON) proposed in the paper. It shows how ACON processes both temporal and frequency data simultaneously to enhance transferability and discriminability. The left part details the multi-period frequency feature learning, segmenting the time series into different periods to improve the discriminative ability of frequency features. The middle part showcases the domain adversarial learning in the temporal-frequency correlation subspace, aiming to learn domain-invariant representations. Finally, the right part illustrates the temporal-frequency domain mutual learning, using knowledge distillation between the two domains to boost the performance of each. Overall, the diagram clearly depicts the collaborative learning mechanism of ACON.
read the caption
Figure 2: The architecture of ACON. ACON models temporal data (blue) and frequency data (green) simultaneously. Left part: Segment raw frequency data by period to capture different discriminative patterns. Middle part: Align distributions in temporal-frequency correlation subspace via adversarial training. Right part: Mutual learning between the temporal domain and frequency domain.

🔼 This figure demonstrates the discriminative power of frequency features compared to temporal features in time series data. Subfigure (a) shows an EEG signal and its frequency representation for two classes (Wake and REM), highlighting the distinct frequency patterns. Subfigure (b) presents classification accuracy on the source domain using only temporal and only frequency features, showing higher accuracy with frequency features. Subfigure (c) compares the performance of temporal and frequency features in a domain adaptation setting (using DANN), showing that frequency features’ superior discriminability in the source domain does not translate to better performance in the target domain.
read the caption
Figure 1: Discriminability of frequency feature: (a) The Electroencephalography (EEG) signal and corresponding frequency data of two classes in the CAP dataset: Wake and Rapid Eye Movement (REM). (b) Classification on the source domain: Temporal domain vs. Frequency domain. (c) Source-only and DANN: Temporal domain vs. Frequency domain.
More on tables

🔼 This table presents the average accuracy achieved by different unsupervised domain adaptation (UDA) methods across eight datasets and five applications. It compares the performance of the proposed ACON method against several baselines, including source-only, CDAN, DeepCoral, AdaMatch, HoMM, DIRT-T, CLUDA, AdvSKM, CODATS, and RAINCOAT. The results show the average accuracy across various datasets and tasks, highlighting the superior performance of ACON in most cases.
read the caption
Table 1: Average Accuracy (%) on Eight Datasets and Five Applications for UDA.
🔼 This table presents the average accuracy achieved by different unsupervised domain adaptation (UDA) methods across eight different datasets and five applications. The methods include various state-of-the-art techniques and a proposed method (Ours). The table shows the performance of each method on each dataset for each task, allowing for a comparison of their effectiveness across different scenarios. The ‘Improve(%) row shows the percentage improvement of the proposed method over the best baseline.
read the caption
Table 1: Average Accuracy (%) on Eight Datasets and Five Applications for UDA.

🔼 This table presents the results of ablation studies conducted on three datasets: UCIHAR, HHAR-P, and WISDM. The purpose is to evaluate the individual contribution of each component of the proposed ACON model. Each row represents a different configuration of the model, indicating which components (multi-period frequency feature learning, temporal-frequency domain mutual learning, and domain adversarial learning) were included. The table shows the average accuracy achieved by each configuration across 10 source-target domain pairs for each dataset.
read the caption
Table 4: Ablation studies: Average Accuracy (%) on UCIHAR, HHAR-P and WISDM.
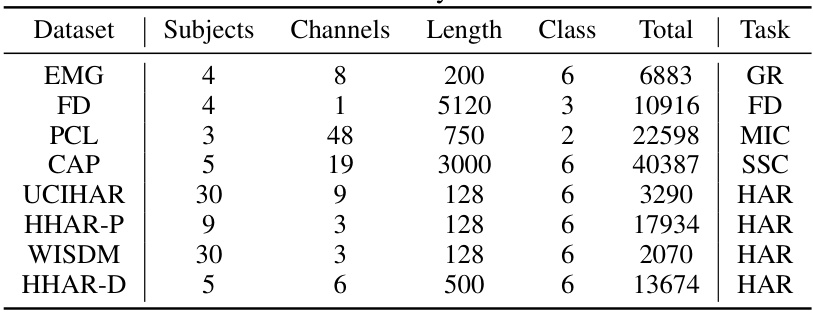
🔼 This table presents a summary of the eight datasets used in the paper’s experiments. For each dataset, it lists the number of subjects, channels, the length of each time series sample, the number of classes, the total number of samples, and the task (GR: Gesture Recognition, FD: Machine Fault Diagnosis, MIC: Motor Imagery Classification, SSC: Sleep Stage Classification, HAR: Human Activity Recognition) associated with the dataset.
read the caption
Table 5: Summary of datasets.

🔼 This table shows the key hyperparameters used for the Adversarial CO-learning Networks (ACON) model across eight different datasets. The hyperparameters include the number of epochs for training, the batch size, and the learning rate. Each dataset has a specific set of hyperparameters optimized for its characteristics.
read the caption
Table 6: Key hyperparameters for ACON.

🔼 This table presents the classification accuracy results obtained using only the source domain data for both temporal and frequency features, across five different datasets (UCIHAR, HHAR-P, WISDM, CAP, FD). It demonstrates the discriminative power of frequency features compared to temporal features within the same domain.
read the caption
Table 7: Classification Accuracy (%) in the source domain: Temporal domain vs. Frequency domain.

🔼 This table presents the classification accuracy results on the target domain for four different methods: Source-only-T, Source-only-F, DANN-T, and DANN-F. Source-only-T and Source-only-F represent models trained only on the source domain’s temporal and frequency features respectively, without domain adaptation. DANN-T and DANN-F employ domain adversarial learning on the temporal and frequency domains respectively, aiming to learn domain-invariant features. The results across various datasets (UCIHAR, HHAR-P, WISDM, CAP, and FD) illustrate the relative effectiveness of utilizing temporal versus frequency features, and the impact of adversarial domain adaptation on each feature type.
read the caption
Table 8: Classification Accuracy (%) in the target domain: Temporal domain vs. Frequency domain.

🔼 This table presents the ablation study results on three datasets (UCIHAR, HHAR-P, and WISDM) to evaluate the effectiveness of each module in the ACON model. The rows represent different configurations of the model, showing which modules (multi-period frequency feature learning, temporal-frequency domain mutual learning, and domain adversarial learning) are enabled or disabled. The columns represent the datasets and the average accuracy across the datasets. This helps to understand the individual and combined contributions of each component to the model’s overall performance.
read the caption
Table 9: Ablation study on different modules: Average Accuracy (%) on UCIHAR, HHAR-P and WISDM.

🔼 This table presents the ablation study results on three datasets (UCIHAR, HHAR-P, and WISDM) to evaluate the effectiveness of different modules in the proposed ACON model. Each row represents a variation of the ACON model with one or more modules removed or altered. The columns show different combinations of modules included in each model variation, resulting in different accuracies on each of the three datasets. The results demonstrate the contributions of each module (multi-period frequency feature learning, temporal-frequency domain mutual learning, and domain adversarial learning in temporal-frequency correlation subspace) to the overall performance.
read the caption
Table 9: Ablation study on different modules: Average Accuracy (%) on UCIHAR, HHAR-P and WISDM.

🔼 This table presents the average accuracy achieved by different unsupervised domain adaptation (UDA) methods across eight datasets and five applications. The methods include several state-of-the-art baselines as well as the proposed ACON method. The datasets represent a range of time series classification tasks, including gesture recognition (GR), motor imagery classification (MIC), sleep stage classification (SSC), human activity recognition (HAR), and machine fault diagnosis (MFD). Each dataset has various source-target domain pairs, and the results are averaged for each task.
read the caption
Table 1: Average Accuracy (%) on Eight Datasets and Five Applications for UDA.

🔼 This table presents the average accuracy achieved by different unsupervised domain adaptation (UDA) methods across eight different datasets and five common applications. The ‘Source-only’ row shows the performance of a model trained only on the source domain without domain adaptation, providing a baseline. Other rows represent various UDA methods, including those specifically designed for time-series data, and the ‘Ours’ row indicates the performance of the proposed ACON method. The table allows for comparison of the effectiveness of different UDA techniques across diverse datasets and tasks. Improvement percentages compared to the baseline are also given.
read the caption
Table 1: Average Accuracy (%) on Eight Datasets and Five Applications for UDA.

🔼 This table presents the average accuracy achieved by various Unsupervised Domain Adaptation (UDA) methods and a proposed method (ACON) across eight different datasets and five application tasks. The results showcase the performance of ACON in comparison to existing state-of-the-art UDA techniques.
read the caption
Table 1: Average Accuracy (%) on Eight Datasets and Five Applications for UDA.
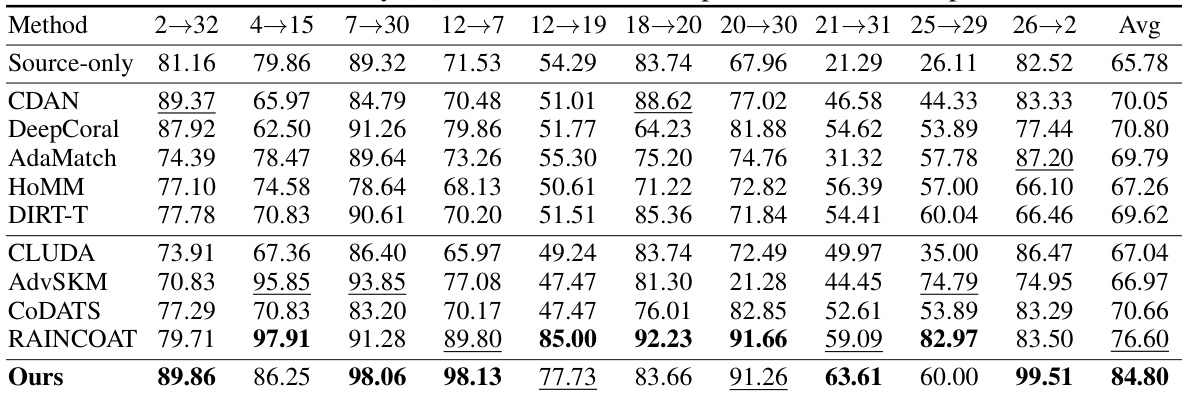
🔼 This table presents the average accuracy achieved by the proposed ACON model and several baseline methods across eight different time series datasets and five common applications (gesture recognition, sleep stage classification, motor imagery classification, human activity recognition, and machine fault diagnosis). It demonstrates the superior performance of ACON in unsupervised domain adaptation (UDA) tasks by comparing its accuracy against other state-of-the-art UDA and general domain adaptation methods.
read the caption
Table 1: Average Accuracy (%) on Eight Datasets and Five Applications for UDA.
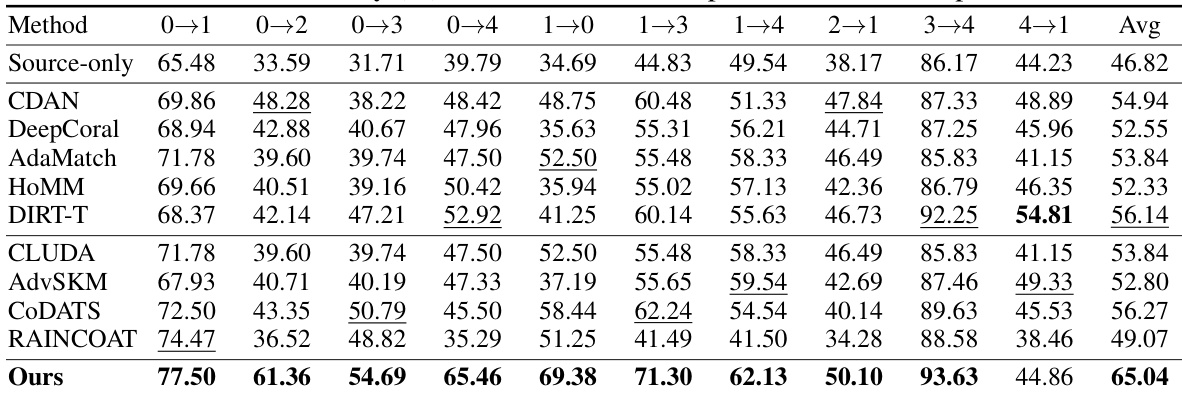
🔼 This table presents the average accuracy achieved by different unsupervised domain adaptation (UDA) methods across eight datasets and five application tasks. The ‘Source-only’ row shows the performance of a model trained only on the source domain without domain adaptation. The other rows represent various UDA approaches, including the proposed ACON method. The table compares the performance of different methods across different datasets and tasks, highlighting the effectiveness of the ACON method in improving accuracy on various time-series classification tasks.
read the caption
Table 1: Average Accuracy (%) on Eight Datasets and Five Applications for UDA.

🔼 This table presents the average accuracy achieved by different unsupervised domain adaptation (UDA) methods across eight datasets and five applications. The methods compared include several state-of-the-art baselines for UDA in time series, as well as some general UDA methods. The results show the performance of each method on various tasks like gesture recognition, sleep stage classification, and human activity recognition. The ‘Source-only’ row indicates the accuracy achieved without using any domain adaptation techniques, providing a baseline for comparison. The table highlights the superior performance of the proposed ACON method across most datasets and applications.
read the caption
Table 1: Average Accuracy (%) on Eight Datasets and Five Applications for UDA.
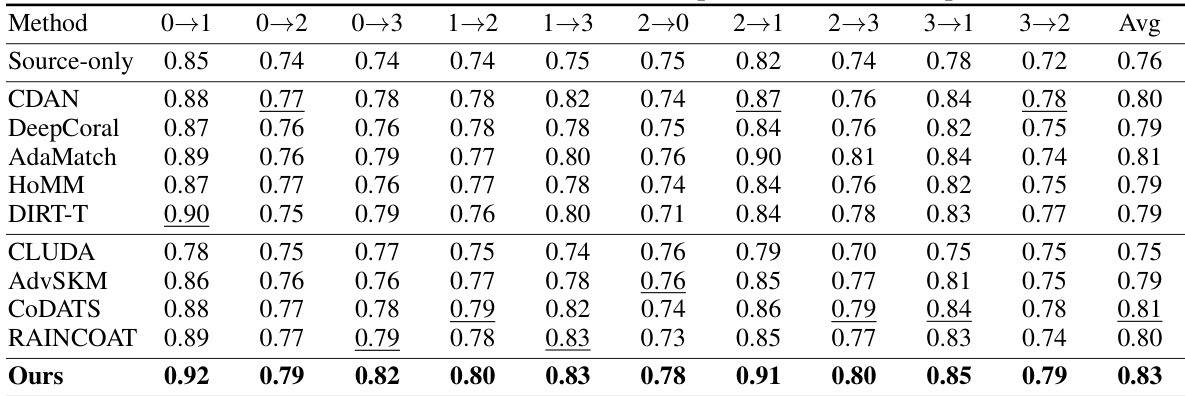
🔼 This table shows the average macro-F1 scores achieved by different domain adaptation methods across eight datasets and five applications. It provides a comprehensive comparison of the performance of various methods (Source-only, CDAN, DeepCoral, AdaMatch, HoMM, DIRT-T, CLUDA, AdvSKM, CODATS, RAINCOAT, and the authors’ proposed ACON method) on different tasks such as Gesture Recognition (GR), Motor Imagery Classification (MIC), Sleep Stage Classification (SSC), Human Activity Recognition (HAR), and Machine Fault Diagnosis (MFD). The results are presented for several datasets: EMG, FD, PCL, UCIHAR, HHAR-P, WISDM, HHAR-D, and CAP. The macro-F1 score is a useful metric for evaluating the performance of a classification model, particularly when dealing with imbalanced datasets.
read the caption
Table 17: Average Macro-F1 Score on Eight Datasets and Five Applications for UDA.

🔼 This table presents the average accuracy achieved by different unsupervised domain adaptation (UDA) methods across eight time series datasets and five applications. The datasets represent various tasks like gesture recognition, sleep stage classification, human activity recognition, motor imagery classification, and machine fault diagnosis. The table compares the proposed ACON method against several state-of-the-art baselines, both general-purpose domain adaptation methods and methods specifically designed for time series data. The results demonstrate the superior performance of the ACON method in most scenarios.
read the caption
Table 1: Average Accuracy (%) on Eight Datasets and Five Applications for UDA.

🔼 This table presents the average accuracy achieved by various unsupervised domain adaptation (UDA) methods across eight different time series datasets and five distinct applications. The methods are compared against a baseline (Source-only) that doesn’t utilize domain adaptation techniques. The five applications include gesture recognition (GR), motor imagery classification (MIC), human activity recognition (HAR), sleep stage classification (SSC), and machine fault diagnosis (MFD). The results highlight the performance improvement achieved by incorporating domain adaptation techniques, particularly the proposed ACON method.
read the caption
Table 1: Average Accuracy (%) on Eight Datasets and Five Applications for UDA.

🔼 This table presents the average accuracy achieved by different Unsupervised Domain Adaptation (UDA) methods across eight diverse time series datasets and five common applications. It compares the performance of ACON against several state-of-the-art baselines and general UDA methods, highlighting the superior performance of ACON in various time series classification tasks.
read the caption
Table 1: Average Accuracy (%) on Eight Datasets and Five Applications for UDA.

🔼 This table shows the average Macro-F1 scores achieved by different domain adaptation methods (including the proposed ACON) across eight benchmark time series datasets and five common applications. The results provide a comprehensive evaluation of the methods’ performance in various real-world scenarios, comparing the proposed ACON against state-of-the-art baselines.
read the caption
Table 17: Average Macro-F1 Score on Eight Datasets and Five Applications for UDA.
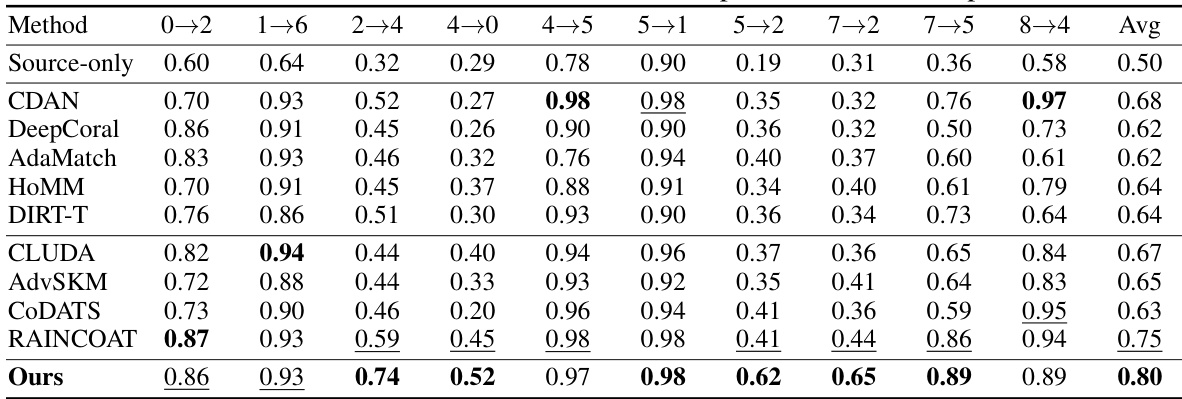
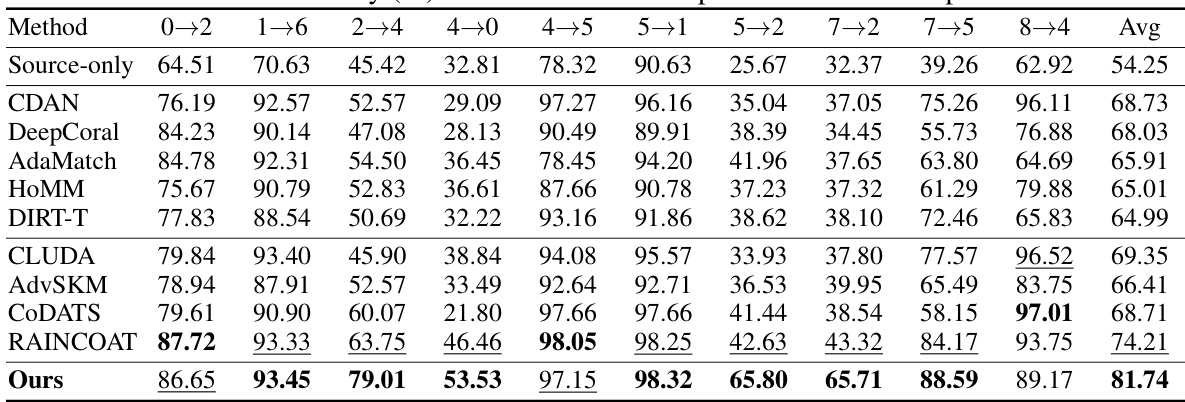
🔼 This table presents the accuracy results of different domain adaptation methods on the HHAR-P dataset. The rows represent different methods (Source-only, CDAN, DeepCoral, AdaMatch, HoMM, DIRT-T, CLUDA, AdvSKM, CODATS, RAINCOAT, and the proposed ACON method), and the columns represent different source-target domain pairs (0-2, 1-6, 2-4, 4-0, 4-5, 5-1, 5-2, 7-2, 7-5, 8-4). The ‘Avg’ column shows the average accuracy across all domain pairs for each method. The table demonstrates the performance of ACON compared to other state-of-the-art domain adaptation methods for time series data.
read the caption
Table 3: Accuracy (%) on HHAR-P for unsupervised domain adaptation.
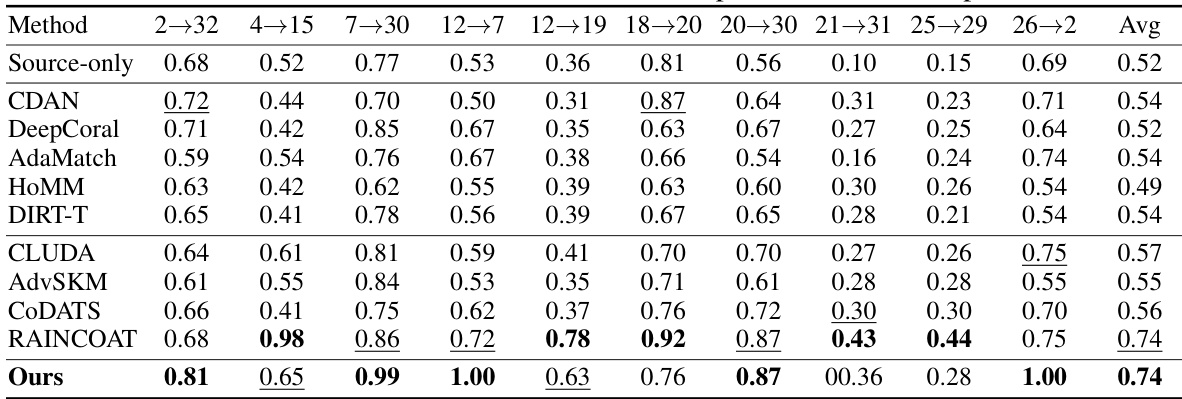
🔼 This table presents the Macro-F1 scores achieved by different domain adaptation methods on the HHAR-D dataset for unsupervised domain adaptation. The rows represent different methods (Source-only, CDAN, DeepCoral, AdaMatch, HOMM, DIRT-T, CLUDA, AdvSKM, CODATS, RAINCOAT, and the proposed ACON method). The columns represent the Macro-F1 scores for various source-target domain pairs. The average Macro-F1 score across all domain pairs is provided in the final column. This table allows for a comparison of the performance of various methods on a specific dataset and task.
read the caption
Table 25: Macro-F1 Score on HHAR-D for unsupervised domain adaptation.

🔼 This table presents the average accuracy achieved by different unsupervised domain adaptation (UDA) methods across eight diverse time series datasets and five distinct applications. The ‘Source-only’ row shows the performance of a model trained only on the source domain data, providing a baseline for comparison. The remaining rows display the performance of various UDA methods, including the proposed ACON model. The final row, ‘Improve(%)’, indicates the percentage improvement of the proposed ACON method over the best performing baseline method.
read the caption
Table 1: Average Accuracy (%) on Eight Datasets and Five Applications for UDA.
Full paper#


