↗ OpenReview ↗ NeurIPS Homepage ↗ Chat
TL;DR#
Recovering the true order of preferences from many individuals is challenging. Existing methods like Condorcet’s Jury Theorem often fail when the majority is misinformed. The Surprisingly Popular (SP) algorithm provides a solution but requires complete preference information, making it impractical for large datasets. This limits its use in many real-world problems involving crowdsourcing and preference aggregation.
This research introduces two new versions of the SP algorithm, Aggregated-SP and Partial-SP, that only need partial preference data. They demonstrate superior performance in recovering ground truth rankings compared to traditional methods via large-scale crowdsourced experiments. Furthermore, the study provides theoretical analysis offering sample complexity bounds, showcasing the methods’ efficiency and practical applicability. These contributions make a significant advance toward efficient and robust preference aggregation in various domains.
Key Takeaways#
Why does it matter?#
This paper is important because it presents scalable alternatives to the Surprisingly Popular (SP) voting algorithm, which is crucial for recovering ground truth rankings from large datasets with partial preferences. The novel algorithms and theoretical analysis significantly improve the accuracy and efficiency of preference aggregation, impacting various fields dealing with crowdsourced data or subjective assessments.
Visual Insights#

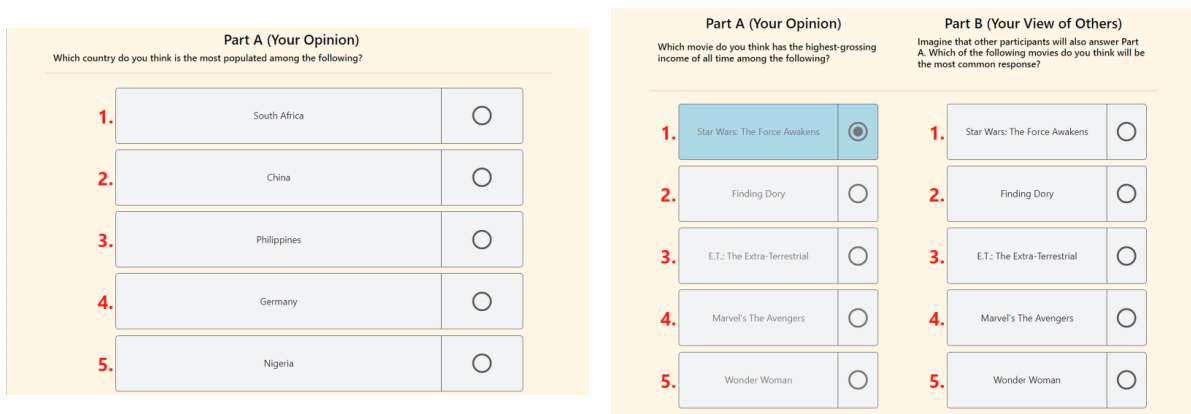
This figure shows the workflow of a participant in the study. Participants first provide consent and preview the experiment before completing a tutorial. They then answer six questions using elicitation format 1, followed by a review and six more questions using the same format. Then they submit their answers and take a quiz before proceeding with elicitation format 2. The process is repeated with six questions, review, and then a second tutorial.

This table presents a sample preference profile used to illustrate common voting rules. It shows four different preference orderings (A>B>C>D, B>C>D>A, C>D>B>A, and D>C>B>A) held by varying numbers of voters (44, 24, 18, and 14 respectively). This data is used in the paper to demonstrate the application and outcomes of the various voting aggregation methods, including Borda count, Copeland method, Maximin method, and Schulze method.
In-depth insights#
SP Voting: Partial Prefs#
The heading “SP Voting: Partial Prefs” suggests a focus on adapting the Surprisingly Popular (SP) voting algorithm to handle situations where voters provide only partial preference rankings instead of complete rankings. This is a significant advancement because eliciting complete rankings can be impractical, especially when dealing with a large number of alternatives. The core idea is to leverage the wisdom of the crowd by incorporating both votes and predictions about other voters’ votes, even with incomplete information. This approach likely explores different ways to elicit partial preferences (e.g., top-k choices, pairwise comparisons, approval sets), and investigates how to effectively aggregate this partial information to recover the underlying ground truth ranking. The effectiveness of the method is crucial, especially when a majority of voters might be misinformed. The study will probably compare the performance of different aggregation strategies for partial preferences against the original SP and traditional voting methods, likely using metrics like Kendall-Tau distance or Spearman’s rho. The research likely also examines the sample complexity required to achieve accurate results under the partial preference setting. Scalability is also a key concern, as the original SP algorithm doesn’t scale well to many alternatives, so this work probably addresses that issue. Overall, this research aims to make SP voting more practical for real-world applications by handling the limitations of obtaining complete rankings from voters.
MTurk Experiment#
The MTurk experiment section of the research paper is crucial for validating the claims about the effectiveness of the proposed SP voting algorithms. It details the large-scale crowdsourcing effort conducted on Amazon Mechanical Turk, involving numerous participants who provided both votes and prediction information regarding different datasets (geography, movies, paintings). The methodology and setup are key elements for assessing the validity and reliability of the results, including how participants were recruited, compensated, and instructed. The description should clearly state elicitation formats used (Top, Approval(t), Rank), which affect the complexity and cognitive load on the participants. The analysis of the collected data includes the assessment of different metrics (Kendall-Tau, Spearman’s correlation, Pairwise/Top-t hit rates) comparing SP algorithms to traditional methods and highlighting the statistical significance of the findings. Finally, the discussion of participant behavior, including the proportion of experts and their influence on the results, is important, especially when related to models of voter behavior. The quality and depth of this section significantly impacts the credibility and overall contribution of the research.
Mallows Model Fit#
A Mallows model fit, in the context of rank aggregation, assesses how well the model’s parameters capture the observed voting patterns. A good fit indicates that the model accurately represents the voters’ preferences. This is crucial because it validates the model’s assumptions and justifies its subsequent use in tasks like ground truth recovery or preference prediction. Key aspects of evaluating a Mallows model fit include assessing its likelihood, examining residual errors, and comparing it to alternative models. Model parameters, such as the dispersion parameter, reveal the level of noise in the voting data. A low dispersion indicates highly consistent preferences, while high dispersion suggests significant variability. Further analysis involves comparing the model’s predictions to actual rankings using metrics such as Kendall’s tau or Spearman’s rho, which measure the rank correlation between predicted and actual rankings. A high correlation signifies a better fit. The concentric mixtures of Mallows model, often used to accommodate both expert and non-expert voters, adds complexity to the fitting process. Evaluating its fit requires considering the contribution of each mixture component to the overall likelihood and assessing the separation between expert and non-expert distributions. Ultimately, successful Mallows model fitting enables the development of robust rank aggregation algorithms providing theoretical guarantees and accurate predictions, which are particularly important when dealing with partial or noisy preference data.
Sample Complexity#
The section on Sample Complexity provides theoretical guarantees for the Surprisingly Popular (SP) voting algorithms, particularly focusing on their scalability with partial preferences. It delves into the number of samples needed to reliably recover the true ranking, a crucial aspect for practical applications. The analysis likely involves intricate probabilistic models, potentially utilizing a concentric mixtures of Mallows model, to represent voter behavior and the noise inherent in partial rankings. Key to understanding the sample complexity is the interplay between the proportion of expert voters (those with accurate information), noise levels (the dispersion in non-expert votes), and the size of the sampled subsets of alternatives. Theoretical bounds are derived to provide insights into the relationship between these factors and the number of samples required for accurate ranking recovery. This analysis helps determine the feasibility and efficiency of the SP algorithms in large-scale applications with limited data or partial information.
Future Directions#
Future research could explore extending the Surprisingly Popular (SP) voting framework beyond the binary expert/non-expert categorization to encompass more nuanced scenarios such as informed but not expert voters or the presence of malicious actors. Investigating the impact of different preference elicitation methods on the efficiency and accuracy of SP voting under various conditions (e.g., varying levels of noise, different group sizes) would be valuable. Theoretical analysis to determine sample complexity under alternative probabilistic models could also refine understanding and provide stronger theoretical guarantees. Finally, applying the SP algorithm to high-stakes real-world problems such as election polling or online content moderation, while carefully considering ethical implications, could demonstrate its practical efficacy and reveal valuable insights.
More visual insights#
More on figures

This figure compares the performance of different elicitation formats (Top-Top, Top-App(3), Top-Rank, Rank-Top, App(2)-App(2), App(3)-Rank, and Rank-Rank) in predicting ground-truth rankings. The comparison is done using two metrics: Kendall-Tau correlation and Spearman’s ρ correlation. Higher values on both metrics indicate better agreement with the ground truth. All results shown in the figure use the Copeland aggregation rule.

This figure compares the performance of the Partial-SP algorithm against Copeland (a standard voting method without prediction information). The comparison is done using two metrics: pairwise hit rate and Top-t hit rate. Both metrics measure how well the algorithms recover the ground truth ranking. The elicitation format used for the votes and predictions in this experiment is Approval(2)-Approval(2), meaning voters select their top 2 most preferred alternatives and predict the top 2 choices others will make.

This figure compares the performance of different elicitation formats (ways of collecting votes and predictions from voters) in predicting the true ranking of items. It uses two metrics, Kendall-Tau and Spearman’s ρ, to measure the correlation between the predicted ranking and the actual ranking. Copeland, a specific voting rule, was used for aggregation in all cases. Higher values indicate better performance.

This figure compares the posterior distributions of the parameters of a concentric mixture of Mallows models fitted to both real and synthetic data. The model is used to simulate voter behavior, distinguishing between experts and non-experts. The plot shows that experts’ votes are closer to the ground truth, but their predictions are further away. Non-experts show a large dispersion in both votes and predictions. The proportion of experts is less than 20% in both datasets, indicating a minority of experts influencing the overall results.

This figure compares the inferred parameters of the Concentric mixtures of Mallows model, which was used to simulate voter behavior, for both real and synthetic data. The parameters compared include the proportion of experts, the dispersion parameters of expert votes and predictions, and the dispersion parameters of non-expert votes and predictions. The results show that the model accurately reflects the behavior of experts and non-experts in the real data, with experts exhibiting tighter distributions around the ground truth and non-experts demonstrating greater dispersion. The proportion of experts in both datasets was found to be less than 20%.

This figure shows a directed graph representing pairwise comparisons between four alternatives (A, B, C, and D). The weights on the edges indicate the number of voters who preferred one alternative over another. This graph is used in the Schulze voting rule to determine the aggregated ranking of the alternatives based on the strength of preferences.

This figure compares the performance of different elicitation formats in predicting ground truth rankings, using Kendall-Tau and Spearman’s ρ correlations as metrics. The elicitation formats are evaluated across various combinations of vote and prediction types, such as Top-Top, Top-Approval(3), Top-Rank, etc. The results demonstrate the impact of different elicitation strategies on the accuracy of ranking recovery, with higher correlation indicating better performance. Copeland is consistently used as the aggregation rule across all formats.

This figure compares the performance of different elicitation formats in predicting ground-truth rankings using Kendall-Tau and Spearman’s ρ correlations. The higher the correlation, the better the prediction. All results use the Copeland aggregation rule. The x-axis represents the different elicitation formats, while the y-axis shows the correlation values. Error bars are included for statistical significance.

The figure compares the performance of different elicitation formats in recovering the ground-truth ranking using Kendall-Tau and Spearman’s ρ correlations. The results show how well each method’s prediction aligns with the true ranking, with higher correlation indicating better accuracy. All results use Copeland as the aggregation rule for the final ranking generation. The x-axis shows different elicitation formats (combining vote and prediction formats), and the y-axis shows the correlation values.

This figure presents a bar chart illustrating the average time taken by participants to complete tutorials and answer questions for various elicitation formats. It demonstrates that tutorial completion generally required more time than answering the questions themselves. Statistically, only the Approval(3)-Rank format showed a significant difference in question response time, suggesting comparable cognitive load across other formats.

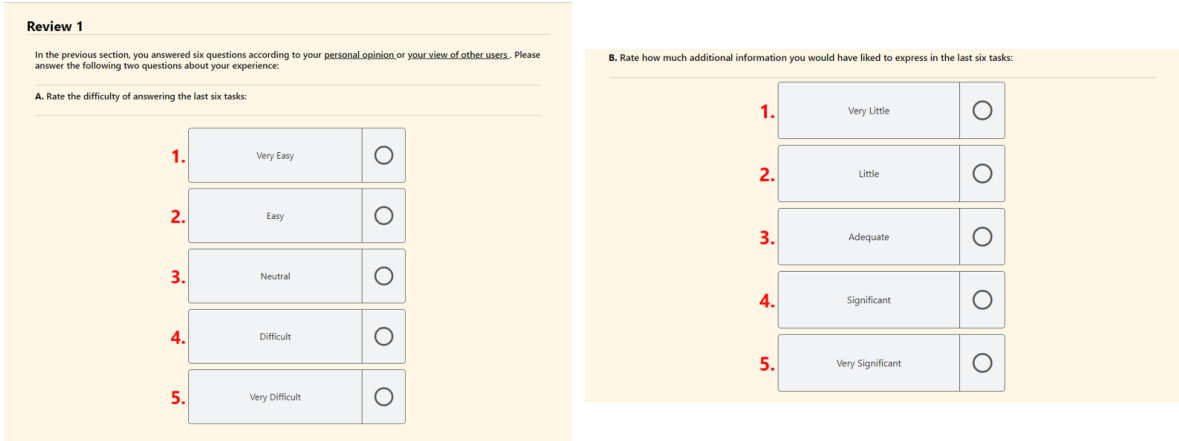
This figure presents the results of a human-subject study evaluating the difficulty and expressiveness of different elicitation formats for gathering partial preferences. Participants rated each format on a scale for both difficulty and how much information they felt they could express. The results show that the participants generally found the tasks relatively easy regardless of the format, and the expressiveness of the formats was also fairly similar, not significantly favoring one over another.

This figure compares the performance of different elicitation formats in predicting ground truth rankings using two correlation metrics: Kendall-Tau and Spearman’s ρ. The x-axis represents the various elicitation formats tested (Top-Top, Top-Approval(3), etc.), while the y-axis shows the correlation scores. Higher scores indicate better prediction accuracy. All results in this figure use the Copeland aggregation rule. The error bars likely represent confidence intervals or standard deviations to help evaluate the reliability of the results.

This figure compares the performance of different elicitation formats (Top-Top, Top-Approval(3), Top-Rank, Approval(2)-Approval(2), Rank-Top, Rank-Rank) in predicting ground-truth rankings. The comparison is done using two metrics: Kendall-Tau correlation and Spearman’s ρ correlation. Higher values for both metrics indicate better performance. All results shown in the figure used Copeland as the aggregation rule.

This figure displays the performance of different elicitation formats in predicting ground truth rankings, measured by Kendall-Tau and Spearman’s ρ correlations. The higher the correlation, the better the performance. All results used the Copeland aggregation rule. The x-axis represents different elicitation formats, and the y-axis represents the correlation values.

This figure compares the performance of the Partial-SP algorithm against the Copeland method (which doesn’t use prediction information). It uses two metrics to assess accuracy: pairwise hit rate (measuring the fraction of correctly ordered pairs at different distances in the ground truth ranking) and top-t hit rate (measuring the fraction of top-t alternatives that are correctly identified). The elicitation format used in this comparison is Approval(2)-Approval(2).
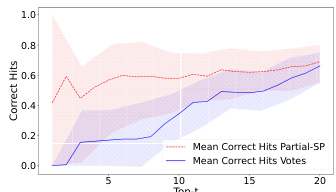
This figure compares the performance of the Partial-SP algorithm against the Copeland method (which does not use prediction information). The comparison is made using two metrics: pairwise hit rate and top-t hit rate. The results show that incorporating prediction information significantly improves the accuracy of the Partial-SP algorithm, especially when the top-t hit rate is considered. The elicitation format used for both methods was Approval(2)-Approval(2).

This figure compares the performance of the Partial-SP algorithm (incorporating prediction information) against the Copeland method (using only votes) in terms of recovering the ground truth ranking. The comparison is shown using two metrics: pairwise hit rate (at varying distances) and Top-t hit rate. The elicitation format used was Approval(2)-Approval(2), meaning voters provided approval sets of size 2 for both their votes and predictions. The figure illustrates the impact of including prediction information on the accuracy of ranking recovery, particularly at increasing distances from the ground truth.

This figure compares the performance of the Partial-SP algorithm with the Copeland method (which doesn’t use prediction information) in terms of accuracy in predicting rankings. Two metrics are used: pairwise hit rate (accuracy of predicting the relative order of pairs of alternatives, at varying distances in the ground truth ranking) and Top-t hit rate (accuracy of predicting the top t alternatives, in any order). The elicitation format used for both methods is Approval(2)-Approval(2), meaning voters provided their top two choices and predicted the top two choices for other voters. The results show that using prediction information (Partial-SP) significantly improves accuracy compared to using only vote information (Copeland).

This figure compares the performance of the Partial-SP algorithm (which incorporates prediction information) against the Copeland method (which uses only votes) in terms of accuracy for recovering the true ranking. It uses two metrics: pairwise hit rate (measuring the proportion of correctly ordered pairs at varying distances from the true ordering) and top-t hit rate (measuring the proportion of top t items correctly identified). The elicitation format employed in this comparison is Approval(2)-Approval(2), where voters provide their top 2 choices (vote) and their prediction of the top 2 choices of others (prediction). The results demonstrate that incorporating prediction data significantly boosts the accuracy of the Partial-SP approach compared to using only votes.
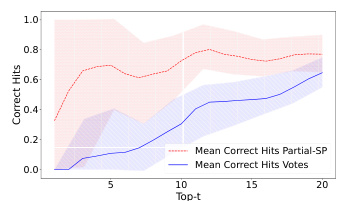
This figure compares the performance of the Partial-SP algorithm with the Copeland method (which doesn’t use prediction information). The comparison is done using two metrics: pairwise hit rate and Top-t hit rate. The results illustrate the impact of incorporating prediction information from voters in improving the accuracy of ranking recovery using the Partial-SP method. The elicitation format used for this comparison is Approval(2)-Approval(2), meaning that voters only provided approval sets of size two for both their vote and their prediction of other voters’ approvals.

This figure compares the performance of the Partial-SP algorithm against the Copeland voting method (without prediction information). The comparison is made using two metrics: pairwise hit rate (at varying distances) and Top-t hit rate. Both metrics evaluate the accuracy of correctly ranking pairs or top-t alternatives. The elicitation format used in this experiment was Approval(2)-Approval(2), where voters provide approvals (2) for votes and approvals(2) for predictions.

This figure compares the performance of different elicitation formats in predicting ground-truth rankings using two correlation metrics: Kendall-Tau and Spearman’s ρ. Higher correlation values indicate better alignment between predicted and actual rankings. The results show that all elicitation formats that use predictions (Partial-SP and Aggregated-SP) significantly outperform Copeland (no prediction information). The x-axis represents the different elicitation formats, and the y-axis represents the correlation values.

The figure shows the Kendall-tau correlation between the rankings obtained using different methods for various elicitation formats across three datasets (Geography, Movies, Paintings). Partial-SP and Aggregated-SP consistently outperform conventional aggregation methods, with performance improving as more information is elicited. The use of different aggregation rules within SP doesn’t significantly affect results.

This figure compares the performance of Copeland-Aggregated Partial-SP and the standard Copeland rule using two different metrics: pairwise hit rate and Top-t hit rate. The comparison is done for real data obtained from the crowdsourcing experiment and simulated data generated using a concentric mixtures of Mallows model. The figure shows that both methods exhibit similar trends across various pairwise distances and top-t metrics, indicating that the simulated model effectively captures the behavior observed in real-world data.

This figure compares the performance of different elicitation formats in predicting ground truth rankings using two metrics: Kendall-Tau and Spearman’s p correlations. Higher correlation values indicate better agreement between predicted and actual rankings. The results shown all use the Copeland aggregation rule.

This figure shows the performance comparison of different elicitation formats in predicting ground-truth rankings using two metrics: Kendall-Tau and Spearman’s ρ. The higher the correlation, the better the prediction. All results presented here used the Copeland aggregation rule.
This figure compares the performance of different elicitation methods (Top-Top, Top-Approval(3), Top-Rank, Approval(2)-Approval(2), Rank-Top, Rank-Rank) in predicting ground truth rankings. The accuracy is measured using Kendall-Tau and Spearman’s ρ correlation coefficients, with higher values indicating better performance. The results demonstrate that elicitation formats including complete ranking information consistently outperform those that only use partial ranking information.

This figure compares the performance of different elicitation formats (Top-Top, Top-Approval(3), Top-Rank, Approval(2)-Approval(2), Rank-Top, Rank-Rank) in predicting ground-truth rankings, using Kendall-Tau and Spearman’s ρ correlations as evaluation metrics. The results show the impact of various elicitation methods on the accuracy of rank prediction, indicating the effectiveness of different methods in recovering ground truth rankings. The Copeland rule is used as the aggregation method for all results.

This figure compares the performance of different elicitation formats (ways of asking participants for their preferences) in predicting the true ranking of items. It uses two metrics: Kendall-Tau and Spearman’s ρ, both measuring the correlation between the predicted and actual rankings. Higher scores indicate better agreement. The results show that all methods using predictions perform better than using only votes. Copeland aggregation was used for all results.

The figure compares the performance of different elicitation formats in predicting ground-truth rankings using Kendall-Tau and Spearman’s ρ correlations. Each bar represents a different elicitation format (e.g., Top-Top, Approval (3)-Rank). The height of the bar indicates the correlation between the predicted ranking and the ground truth ranking. Copeland is used as the aggregation rule. Higher correlations indicate better performance.

This figure compares the performance of different elicitation methods (Top-Top, Top-Approval(3), Top-Rank, etc.) in recovering ground truth rankings using two different correlation metrics: Kendall-Tau and Spearman’s ρ. Copeland is used as the aggregation rule across all methods. The higher the correlation values (closer to 1.0), the better the performance of the elicitation method in recovering the true ranking.
This figure compares the performance of different elicitation methods (Top-Top, Top-Approval(3), Top-Rank, Approval(2)-Approval(2), Rank-Top, Rank-Rank) in predicting ground truth rankings. The accuracy is measured using two metrics: Kendall-Tau correlation and Spearman’s ρ correlation. Higher values indicate better agreement between the predicted and actual rankings. All results shown used the Copeland aggregation rule.
More on tables

This table shows the results of pairwise comparisons between alternatives A, B, C, and D using the Copeland rule. Each row represents a pairwise comparison between two alternatives, and the ‘Winner’ column indicates which alternative won the comparison based on majority preference.

This table shows, for each alternative, its worst pairwise defeat and the margin of that defeat. The margin is calculated as the difference in votes between the alternative and its worst opponent. It is used in the Maximin voting rule to determine the ranking of alternatives.

This table presents the results of pairwise comparisons between alternatives (A, B, C, D) using the Copeland rule. For each pair of alternatives, it indicates which alternative won the pairwise comparison (e.g., A vs B, B won). The table serves as input for calculating the Copeland scores. The Copeland score of an alternative is simply the number of times it wins in these pairwise comparisons. This is then used to produce the final ranking of the alternatives.

This table presents the results of pairwise comparisons between alternatives A, B, C, and D, using the Copeland voting rule. The winner of each pairwise comparison is indicated. This is an intermediate step in the Copeland method, where the final ranking is determined by the total number of pairwise wins for each alternative.
Full paper#


