↗ OpenReview ↗ NeurIPS Homepage ↗ Hugging Face ↗ Chat
TL;DR#
Large language models (LLMs) achieve remarkable results by predicting the next token in a sequence. However, the reasons behind their success remain unclear. This paper explores the hypothesis that the inherent fractal structure of language, exhibiting self-similarity (patterns repeating across scales) and long-range dependence (relationships between distant parts of text), plays a crucial role. Existing research on language’s fractal nature has been limited by computational constraints and simplifying assumptions.
This research uses LLMs themselves to analyze the fractal properties of language, overcoming previous limitations. They demonstrate that language is indeed self-similar and long-range dependent, with quantifiable fractal parameters (Hölder exponent, Hurst parameter, fractal dimension). These parameters show robustness across different LLMs and domains. Importantly, even tiny variations in these parameters improve the accuracy of predicting LLMs’ downstream performance compared to using traditional metrics alone. These findings offer a new way to understand and improve LLMs, moving beyond simple perplexity-based evaluations.
Key Takeaways#
Why does it matter?#
This paper is crucial for researchers working with LLMs because it provides a novel perspective on the mechanisms underlying their success. By introducing the concept of fractal structure in language, it opens new avenues for improving LLM performance and understanding their capabilities. The findings challenge existing metrics and propose new evaluation methods that are more robust and insightful, contributing to the broader advancement of LLM research.
Visual Insights#

This figure demonstrates the concept of self-similarity in time series data. The left panel shows a process (derived from Wikipedia text) exhibiting self-similarity: magnified sections at different scales reveal similar patterns. The right panel shows a contrasting example of a non-self-similar process, where the patterns appear smoother at larger scales.

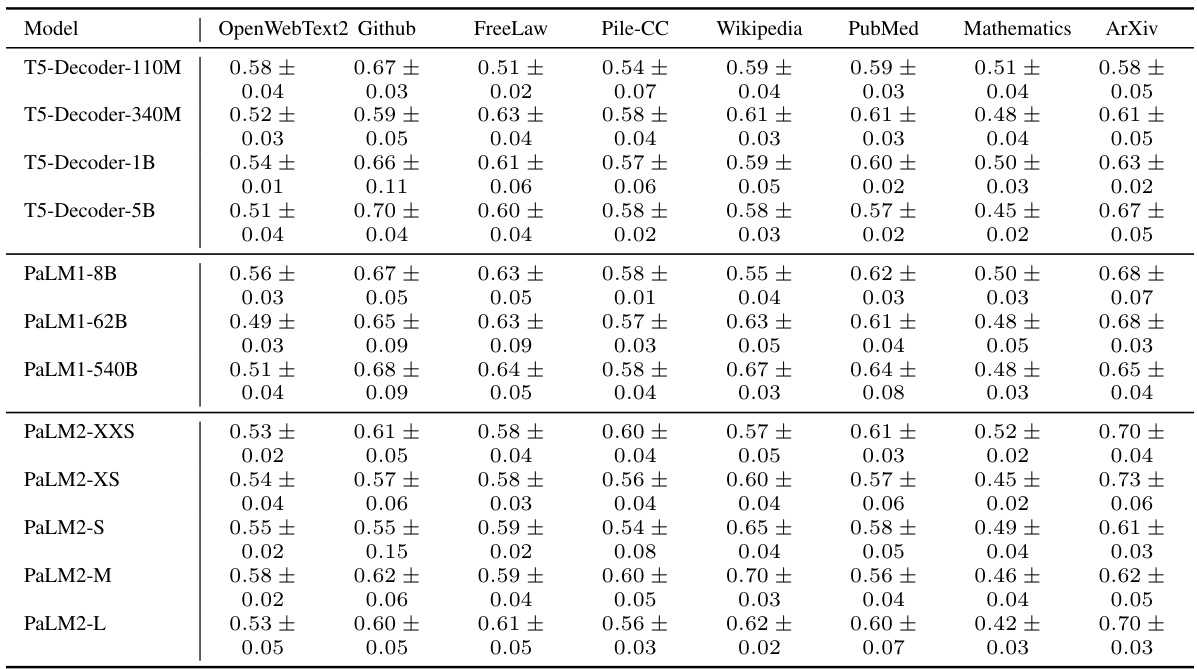
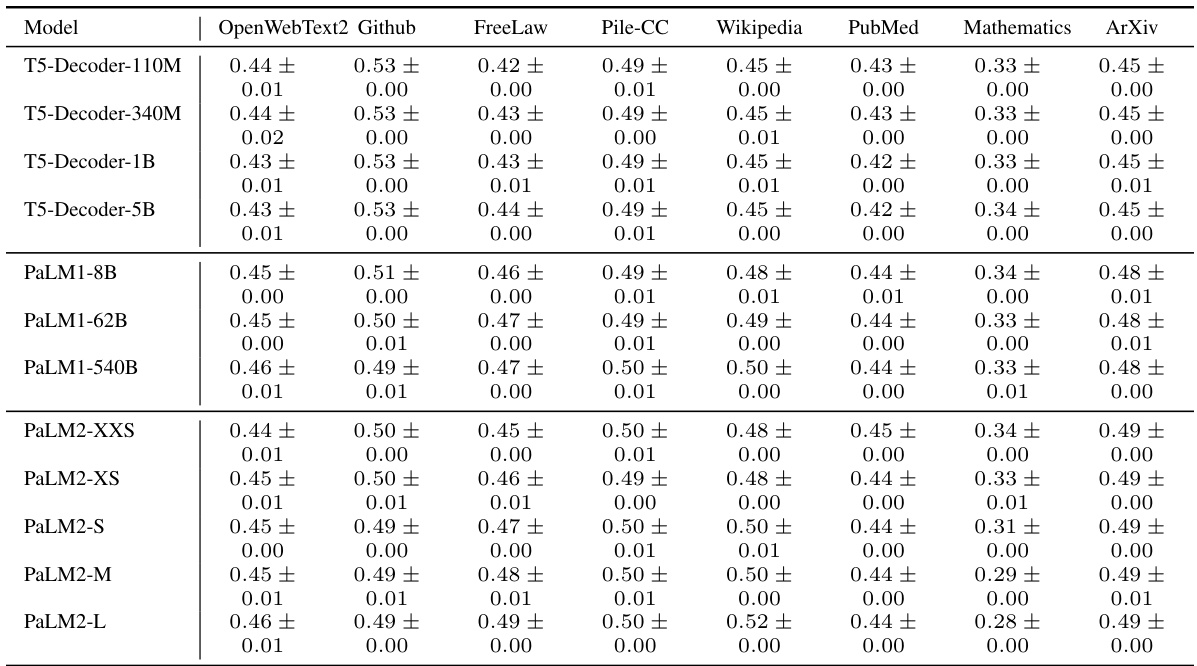
This table compares the self-similarity exponent (S), Hurst exponent (H), and Joseph exponent (J) across eight different domains from the Pile benchmark dataset. Each domain contains over 1000 documents. The DM-Mathematics domain stands out, showing significantly different fractal parameters due to the nature of its data (questions, lacking long-range dependence).
In-depth insights#
Fractal Language#
The concept of “Fractal Language” proposes that language exhibits self-similarity across scales, meaning similar patterns repeat at different levels of granularity, from words and sentences to entire documents. This self-similarity, quantified through fractal parameters such as the Hurst exponent and fractal dimension, suggests a deep, hierarchical structure. The research argues that this fractal nature helps explain the success of next-token prediction models, as the models can leverage patterns at smaller scales to predict larger-scale structures. The study also demonstrates that variations in these fractal parameters, even small ones, correlate with downstream LLM performance, suggesting that fractal properties provide a useful measure of model capability beyond simple perplexity. Robustness of fractal parameters across different domains and architectures is also a key observation.
LLM Success#
The paper explores the intriguing connection between the fractal nature of language and the surprising capabilities of Large Language Models (LLMs). It posits that the success of LLMs in next-token prediction stems from their ability to capture this fractal structure, exhibiting self-similarity across multiple granularities—from words to documents. This self-similarity, combined with long-range dependencies in language, allows LLMs to leverage both short-term and long-term patterns effectively, extending beyond simple memorization. The study provides a precise mathematical formalism to quantify these properties, demonstrating their robustness across different architectures and domains. Tiny variations in fractal parameters, interestingly, are shown to correlate with downstream LLM performance. This novel perspective suggests that a deep understanding of the fractal structure of language is key to unraveling the mysteries of LLM intelligence, challenging previous explanations based solely on “on-the-fly improvisation.”
Fractal Analysis#
Fractal analysis, in the context of language modeling, offers a powerful lens to understand the inherent complexity of language. By viewing language as a fractal, the study reveals its self-similarity across scales, meaning patterns at the word level mirror those at the document level. This self-similarity is not just structural; it also impacts the predictive capabilities of large language models (LLMs). The presence of long-range dependencies highlights the importance of context in understanding and generating text, surpassing the limitations of short-term pattern recognition. Quantifying these properties via metrics like the Hurst exponent and fractal dimension, allows for a more precise understanding of the dynamics and performance of LLMs, going beyond traditional metrics like perplexity. Ultimately, fractal analysis provides a fresh perspective, revealing the subtle yet significant relationship between the intricate structure of language and the remarkable capabilities of LLMs that predict the next token.
Robustness#
The concept of robustness is central to evaluating the reliability and generalizability of the findings. The authors address robustness in several ways. Firstly, they demonstrate the consistency of fractal parameters across a wide range of LLMs, indicating that the observed patterns aren’t artifacts of specific model architectures. Secondly, the robustness is tested across multiple domains of text, showing that the fractal properties of language are not specific to a single dataset or genre. Thirdly, the impact of tiny variations in fractal parameters on downstream performance shows robustness in predictive capability of the model. Although the paper doesn’t explicitly use the term “robustness” as a section heading, the evidence presented strongly suggests a focus on establishing the reliability and generalizability of their fractal-based analysis of language.
Future Research#
The paper’s “Future Research” section would greatly benefit from exploring the cross-linguistic applicability of their findings. Investigating whether the fractal properties of language hold across different languages and cultures is crucial to establishing the universality of their model. A comparative study analyzing languages with varying degrees of syntactic complexity or structural organization could reveal important insights into the relationship between linguistic structure and fractal patterns. Furthermore, future work should explore the integration of semantic information into the fractal analysis. While the paper focuses on syntactic patterns, incorporating semantic meaning could significantly enrich the model, leading to a deeper understanding of the complexity of language. Investigating the potential relationship between fractal parameters and aspects of language processing such as reading time or comprehension would also be a valuable area for exploration. Finally, examining the impact of different training methodologies or architectural designs on the emergence of these fractal patterns within LLMs could deepen our understanding of how LLMs capture and represent the structure of natural language.
More visual insights#
More on figures

This figure shows the results of an experiment to determine the self-similarity exponent (S) of language. The experiment plots the peak probability of the event that the absolute value of the difference between the values of a stochastic process at two different time points, separated by a time interval τ, is less than a small positive constant ϵ against the time interval τ itself. The results show that the peak probability follows a power law relationship with τ, which is indicative of self-similarity. The median self-similarity exponent found was 0.59 ± 0.08.

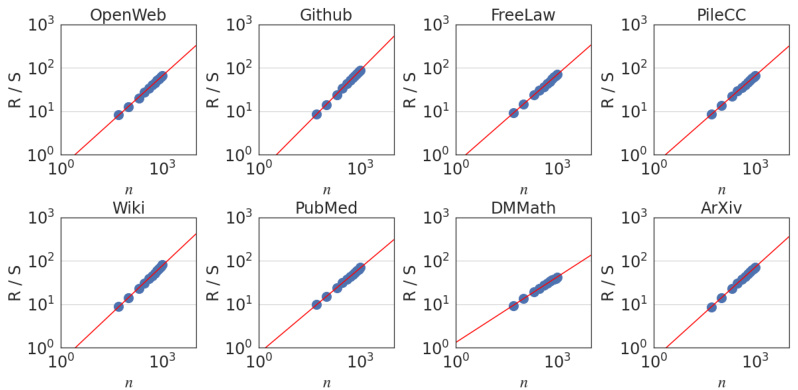
This figure shows the result of rescaled range analysis which is used to estimate the Hurst exponent (H). The plot shows the rescaled range R(n)/S(n) against the number of normalized bits (n) for different text datasets. The power-law relationship observed confirms long-range dependence in language, with an overall Hurst exponent of approximately 0.70.

The figure shows two plots. The left plot demonstrates the robustness of self-similarity exponent (S) estimations across different granularities (ε). The right plot displays the partial autocorrelation function (PACF) for various domains, highlighting the shorter dependence in DM Mathematics compared to other domains, consistent with its Hurst parameter.

This figure shows the relationship between the standard deviation of the τ-increments (Xt+τ - Xt) and the scale τ. The y-axis represents the standard deviation (στ), and the x-axis represents the scale (τ). The data points follow a power law relationship, indicating self-similarity. The exponent of this power law, known as the Joseph exponent (J), is approximately 0.49 ± 0.08. This exponent quantifies the degree of burstiness or clustering in the data, indicating that the process exhibits long-range dependence.

This figure displays the relationship between downstream performance (indicated by bubble size) and the median Hurst exponent and median bits-per-byte (BPB) score across 12 different large language models. The larger the bubble, the better the downstream performance. The plot aims to show whether the fractal parameters (Hurst exponent) offer better prediction of downstream LLM performance than perplexity-based metrics alone.

This figure shows the result of plotting the peak probability against the granularity level for various datasets. The power law relationship observed supports the claim of self-similarity in language, with a median Hölder exponent of 0.59 ± 0.08. Each subplot represents a different dataset, demonstrating the robustness of the finding across various domains.

This figure shows the results of rescaled range analysis which is used to estimate the Hurst exponent (H). The Hurst exponent quantifies the long-range dependence in the data. The plot shows a power-law relationship between the rescaled range and the number of normalized bits, indicating the presence of long-range dependence. The estimated Hurst exponent for the aggregated datasets is 0.70 ± 0.09, suggesting a significant degree of long-range dependence in language.

This figure shows the relationship between the self-similarity exponent (S) and the Hurst exponent (H) and the inference context length. The x-axis represents the inference context length (in words), while the y-axis shows the values of S and H. As the inference context increases, both S and H also increase, indicating a change in the fractal characteristics of the language model’s output as more context is provided.
More on tables

This table compares the median fractal parameters (self-similarity exponent S, Hurst exponent H, and Joseph exponent J) obtained from various large language models (LLMs) across the entire Pile validation split. The results demonstrate that the fractal parameters are relatively robust across different LLMs. However, subtle variations in the median Hurst exponent (H) suggest potential improvements in the model quality.

This table compares the self-similarity exponent (S), Hurst exponent (H), and Joseph exponent (J) across eight different domains within the Pile benchmark dataset. Each domain contains over 1000 documents. The DM-Mathematics domain stands out as having notably different fractal parameters, due to the nature of its documents (questions) which lack long-range dependencies (LRD).

This table presents the adjusted R-squared values, indicating the proportion of variance in downstream performance explained by different predictors (BPB, H, HB). It shows that the combined metric HB (1/BPB + H) is a better predictor than BPB alone. The right section displays downstream performance metrics (BBH, MMLU, GSM8K) for three T5 decoder-only models with different context lengths (2K, 4K, 8K) during training.

This table presents the log-perplexity scores obtained by various large language models (LLMs) on different subsets of the Pile benchmark dataset. The perplexity, a measure of how well a model predicts a text, is calculated for the first 2048 tokens of each document after removing the initial 100 tokens. Only documents with a minimum length of 4000 tokens are included to ensure sufficient data for reliable evaluation. The results show how well each LLM performs on various text types.

This table compares the self-similarity exponent (S), Hurst exponent (H), and Joseph exponent (J) across eight different domains from the Pile benchmark dataset. Each domain contains over 1000 documents. The table highlights the robustness of these fractal parameters across various domains, with the exception of DM-Mathematics, which shows significantly different values due to the unique nature of its data (questions, lacking long-range dependence).

This table compares the self-similarity exponent (S), Hurst exponent (H), and Joseph exponent (J) across eight different domains from the Pile benchmark dataset. Each domain contains over 1000 documents. The table highlights the robustness of these fractal parameters across various domains, with the exception of DM-Mathematics, which shows significantly different values due to the nature of its data (questions, lacking long-range dependence).

This table compares the self-similarity exponent (S), Hurst exponent (H), and Joseph exponent (J) across eight different domains from the Pile benchmark dataset. Each domain contains over 1000 documents. The DM-Mathematics domain shows notably different fractal parameters due to its unique characteristics (documents consist of questions lacking long-range dependence).

This table shows the adjusted R-squared values for several downstream performance metrics (rows) predicted using different combinations of upstream metrics (columns). The adjusted R-squared indicates the proportion of variance in downstream performance explained by the model. The table demonstrates that a combination of bits-per-byte (BPB) and the Hurst exponent (H) is a significantly better predictor than BPB alone. In contrast, the self-similarity exponent (S) and Joseph exponent (J) do not improve the predictions. The right side shows the downstream performance of models trained with different context lengths.

This table presents the adjusted R-squared values showing how well downstream performance (various metrics across different tasks) is predicted by upstream metrics: Bits Per Byte (BPB), Hurst exponent (H), and a combined metric HB (1/BPB + H). It also shows how downstream performance varies with different context lengths (2K, 4K, 8K) during pretraining of T5 models.

This table compares the self-similarity exponent (S), Hurst exponent (H), and Joseph exponent (J) across eight different domains from the Pile benchmark dataset. Each domain contains over 1000 documents. The DM-Mathematics domain shows significantly different results compared to the others, lacking long-range dependence (LRD).
Full paper#


