↗ OpenReview ↗ NeurIPS Homepage ↗ Chat
TL;DR#
Machine learning (ML) models often fail in real-world scenarios despite good overall performance. Current testing methods mainly rely on analyzing held-out data, neglecting valuable contextual information that could pinpoint model weaknesses. This data-only approach suffers from high false positives and false negatives, hindering the identification of impactful model failures.
This research introduces Context-Aware Testing (CAT), a novel paradigm that integrates contextual information into the model testing process. The authors present SMART Testing, a CAT system that uses large language models (LLMs) to hypothesize and evaluate likely failure modes. Through a self-falsification mechanism, SMART efficiently prunes spurious hypotheses, focusing on data slices that expose practically significant model underperformance. Empirical results across diverse settings show SMART significantly outperforms traditional data-only methods in identifying relevant and impactful model failures.
Key Takeaways#
Why does it matter?#
This paper is crucial for researchers in ML and related fields due to its novel approach to model testing. It directly addresses the limitations of existing data-only methods by introducing context-aware testing. This opens new avenues for more reliable and trustworthy ML model deployment by focusing on identifying meaningful failures, even those not easily detected by traditional methods. The use of LLMs for hypothesis generation and the self-falsification mechanism represent significant advancements in the field. Furthermore, the provided open-source code and data allow for easy reproducibility and extension of the research.
Visual Insights#

This figure presents a flowchart illustrating the SMART Testing framework’s four main steps: 1) Hypothesis Generation, where an LLM (Large Language Model) generates hypotheses about potential model failures using contextual information; 2) Operationalization, where these hypotheses are translated into testable forms using either LLM-based or data-driven methods; 3) Self-falsification, a mechanism where LLMs validate the generated hypotheses using available data and a self-falsification mechanism; 4) Reporting, where the results are compiled into a comprehensive model report that provides insights into the identified failures. The process is fully automated by an LLM, making it efficient and scalable.

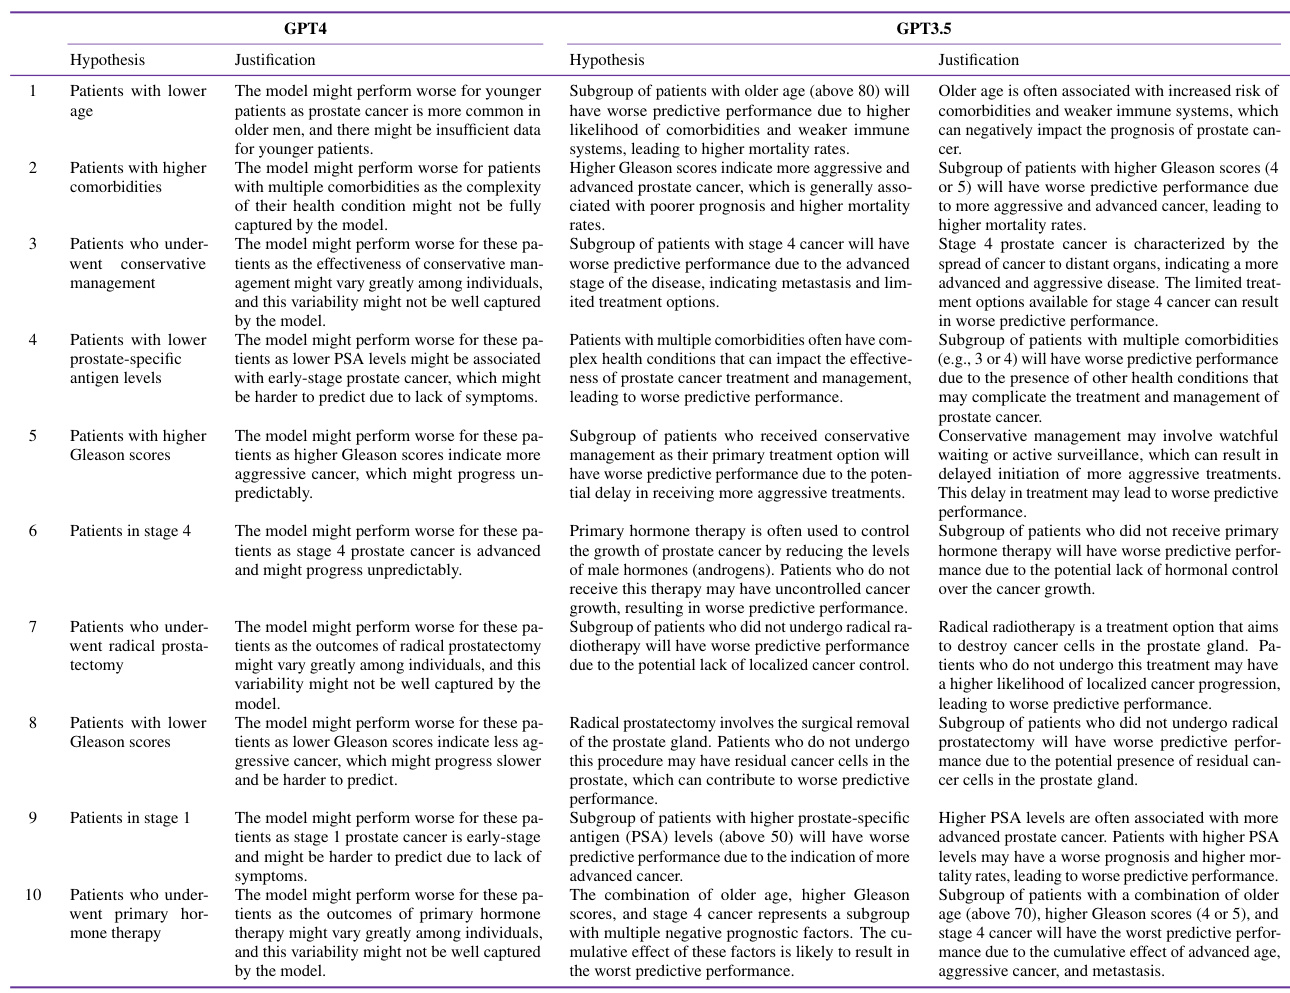
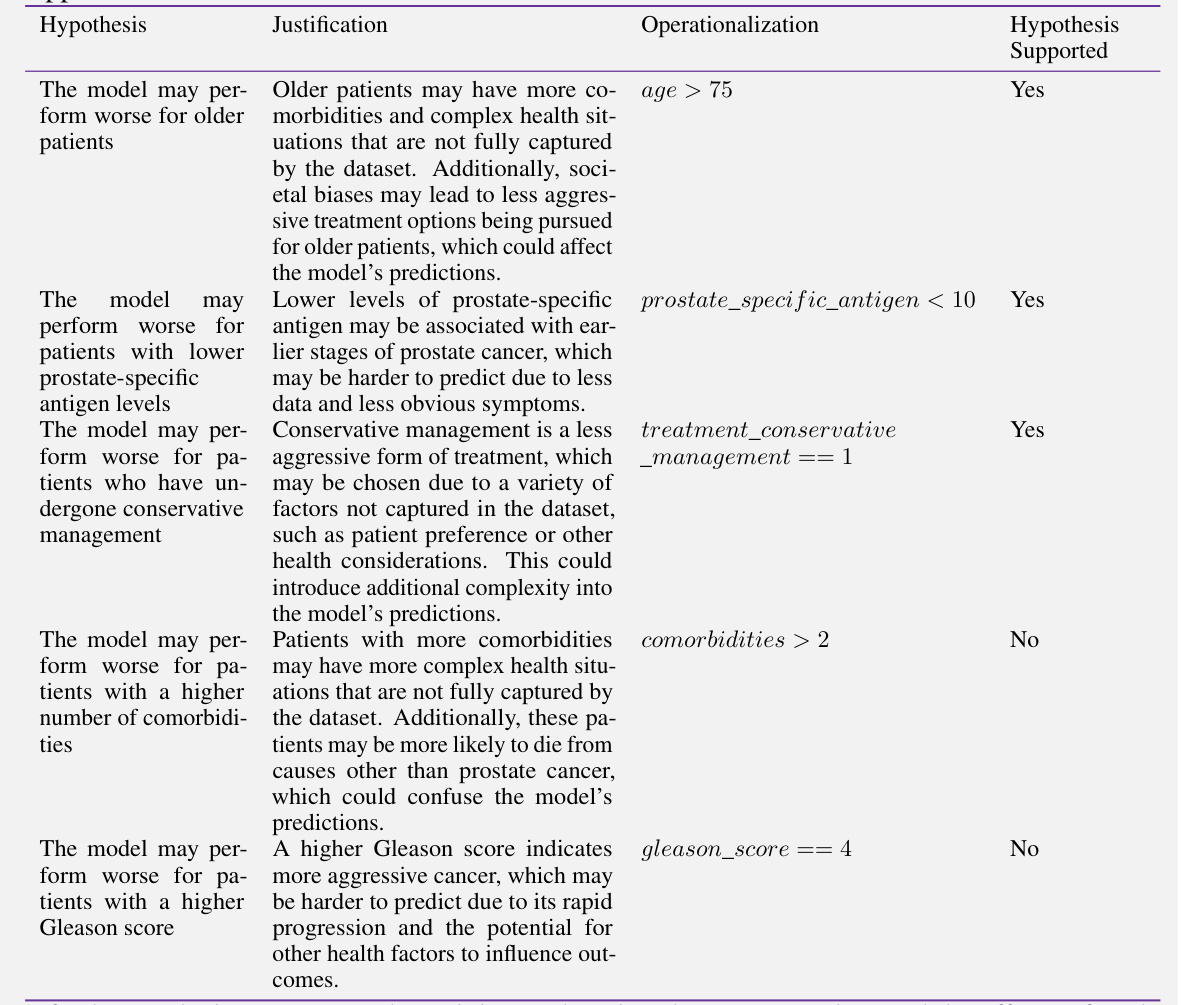
This table provides example hypotheses generated by the SMART testing framework. Each row represents a hypothesis about potential model failures, along with its justification, operationalization (how the hypothesis is tested on the data), p-value (indicating statistical significance of the failure), effect size (|∆Acc|), and whether the hypothesis is supported by the data. The examples demonstrate the framework’s capability to generate contextually relevant hypotheses and to test them using a self-falsification mechanism. This helps in identifying meaningful model failures.
In-depth insights#
Context-Aware Testing#
The concept of Context-Aware Testing (CAT) offers a paradigm shift in evaluating machine learning (ML) models. Traditional methods often rely solely on aggregate metrics from held-out data, neglecting valuable contextual information that could reveal crucial model weaknesses. CAT leverages this context—prior knowledge, domain expertise, and relevant features—as an inductive bias to guide the testing process. This approach significantly improves efficiency by prioritizing potentially meaningful model failures, reducing false positives and negatives commonly associated with exhaustive data-only testing. The use of large language models (LLMs) is particularly compelling as they can generate relevant failure hypotheses based on contextual cues, thus automating the testing process. SMART Testing, an instantiation of CAT, exemplifies this approach, demonstrating improved detection of impactful failures while avoiding spurious results. By emphasizing the interplay of data and context, CAT offers a more effective and reliable approach to ML model evaluation.
SMART Testing System#
The SMART Testing system is a novel approach to evaluating machine learning models, particularly focusing on identifying meaningful failures. It leverages large language models (LLMs) to generate hypotheses about potential model weaknesses, which are then empirically tested. This contrasts with traditional data-only methods by incorporating contextual information to guide the testing process, resulting in more relevant and impactful failure detection. A key strength is the self-falsification mechanism, allowing for automated validation of hypotheses and filtering of spurious findings. The system’s modular design and automated workflow make it highly efficient and scalable, offering a significant improvement over existing techniques. SMART also prioritizes practically meaningful failures, reducing the prevalence of false positives and negatives often observed in data-only methods. Finally, the system generates comprehensive model reports, providing valuable insights into identified failure modes and potential root causes.
LLM-driven Hypothesis#
The concept of “LLM-driven Hypothesis” in the context of model testing is innovative and powerful. It leverages the capabilities of large language models (LLMs) to generate hypotheses about potential model failure modes, moving beyond traditional data-driven approaches. This is particularly beneficial because LLMs can incorporate external knowledge and context, leading to more targeted and relevant hypotheses. Instead of exhaustively searching for potential failures, LLMs can focus the search, potentially reducing false positives and improving efficiency. A key challenge lies in ensuring the quality and relevance of the LLM-generated hypotheses, which requires careful prompting and validation mechanisms to avoid spurious or meaningless suggestions. The self-falsification process described in the paper is crucial in this respect, providing a mechanism to empirically evaluate and refine LLM-generated hypotheses using available data. This iterative process ultimately enhances the reliability and effectiveness of the model testing approach.
Bias & Generalization#
The heading ‘Bias & Generalization’ in a machine learning research paper would likely explore how biases in training data affect model performance across different datasets. It would analyze the generalizability of the model—its ability to perform well on unseen data that differs from the training set. A key aspect would be identifying and quantifying various biases, such as representation bias (inadequate representation of certain groups) and measurement bias (inconsistent or inaccurate data collection). The analysis should investigate how these biases lead to performance disparities between different subgroups. Furthermore, techniques to mitigate bias and enhance generalization would be discussed, such as data augmentation, algorithmic adjustments, or adversarial training. The paper likely examines the trade-off between achieving high accuracy on the training data and maintaining robustness and fairness when encountering biased or out-of-distribution data. Finally, empirical results demonstrating the effect of bias mitigation strategies on both training and test set performance would be essential to support the paper’s claims.
Future of ML Testing#
The future of ML testing hinges on addressing the limitations of current data-centric approaches. Context-aware testing (CAT), which leverages external knowledge to guide the search for meaningful model failures, presents a promising paradigm shift. This requires advancements in techniques that effectively integrate contextual information, potentially via large language models (LLMs), to hypothesize likely failure modes. Automated and scalable CAT systems are crucial for practical application, and should produce comprehensive model reports which highlight failures and their impacts. Furthermore, robust methods are needed to address the challenges of multiple hypothesis testing, mitigating both high false positives and false negatives. Ultimately, the future of ML testing lies in balancing automated rigor with contextual understanding, creating efficient methods to identify impactful failures that go beyond simple aggregate metrics and that consider the real-world implications of model flaws.
More visual insights#
More on figures
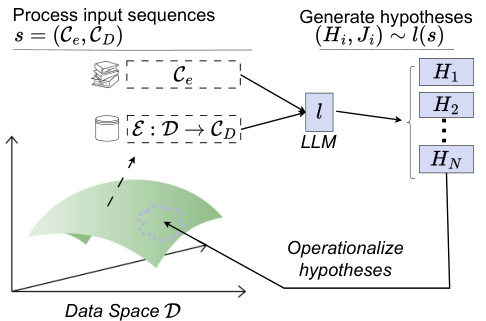
This figure illustrates the SMART testing framework’s hypothesis generation step. It shows how a large language model (LLM) uses both external context (Ce) and dataset context (Dc) to generate relevant and likely failure hypotheses (H1…HN) about the model’s performance. This contrasts with data-only testing methods, which perform an exhaustive search across all possible subgroups without considering context, thus highlighting SMART’s context-aware approach.

This figure illustrates the self-falsification module of the SMART testing framework. The module starts by generating hypotheses and justifications using a large language model (LLM). These hypotheses are then operationalized, meaning they are translated into testable conditions using a function gᵢ. The operationalized hypotheses are evaluated on the data to determine if they hold true (p < α/n) or are false (p > α/n). Those that are falsified are rejected, while those that are not falsified (and meet specified criteria) represent potential model failures.

This figure shows the robustness of SMART and other data-only methods to false positives when dealing with irrelevant features. The x-axis represents the increasing number of irrelevant features added to the datasets, while the y-axis shows the percentage of irrelevant features included in the slices identified by each method. The results demonstrate that SMART consistently avoids irrelevant features and its performance remains largely unaffected by the number of irrelevant features added, unlike data-only methods which demonstrate sensitivity to the number of irrelevant features, indicating that the contextual awareness embedded in SMART helps mitigate the issue of false positives.

This figure compares different ML model testing paradigms based on two axes: Testing Relevance and Automation & Adaptability. Testing Relevance refers to how well the testing approach considers requirements and contextual factors, with higher relevance indicating a more principled search for meaningful model failures. Automation & Adaptability describes how easily and automatically the testing method can be deployed and scaled to address various testing situations. The figure highlights that existing methods fall short in fully addressing both relevance and automation, while the proposed context-aware testing (CAT) aims to achieve both.

This figure illustrates the three main steps in the ML testing pipeline: test search, operationalization, and evaluation. The ‘Test search’ step focuses on identifying what aspects of the model to test, which can be done through hypothesis generation (as in SMART Testing) or by searching for data-only divergences. The ‘Operationalize’ step describes how to translate the tests into actions performed on the data. This involves either utilizing sufficient data (as in SMART) or employing behavioral testing methods when data is scarce. Finally, the ‘Evaluation report’ step focuses on assessing the model’s performance, using the SMART Testing framework to generate comprehensive reports.

This figure illustrates the key components and workflow of the SMART Testing framework. It highlights the four main steps: contextual understanding, requirement-driven testing, automation, and contextual failure output. The diagram shows how contextual knowledge and requirements guide the testing process, ensuring that the evaluation framework focuses on identifying meaningful model failures. The automation aspect reduces manual intervention, and the contextual failure output provides a clear summary report focusing on identified issues. This figure emphasizes the importance of incorporating external context and automating the testing process for more effective model evaluation.

This figure shows a flowchart of the SMART testing framework. The framework consists of four main steps: 1) Hypothesis Generation, where an LLM generates potential model failures based on provided context and dataset information; 2) Operationalization, where the hypotheses are translated into testable conditions on the dataset; 3) Evaluation, where the model’s performance under the operationalized conditions is evaluated; and 4) Reporting, where a comprehensive report summarizing the findings is generated. The figure highlights that all steps are automated by an LLM, reflecting the system’s efficiency and automation.

The figure illustrates the SMART testing framework, which is a four-step process: 1) Hypothesis Generation: This step uses an LLM to generate hypotheses regarding model failures based on the provided context and data. 2) Operationalization: This step transforms the natural language hypotheses into operational steps that can be executed using the training data. 3) Evaluation: This step evaluates the model’s performance on the operationalized hypotheses, using a self-falsification mechanism to validate whether they are truly indicative of model failures. 4) Reporting: SMART generates a comprehensive report on the model’s performance, including potential failures, their impact, and root causes. All steps are automated using an LLM.

The figure provides a flowchart representation of the SMART testing framework. It consists of four main stages: 1. Hypothesis generation, where large language models (LLMs) are used to create hypotheses about potential model failures; 2. Operationalization, which translates these hypotheses into testable conditions; 3. Evaluation, where the hypotheses are evaluated on the data using a self-falsification mechanism; and 4. Reporting, where a comprehensive report on the model’s performance and the identified failure modes is generated. The process is fully automated, with each stage relying on the capabilities of LLMs.

This figure shows the number of significant groups (out of 10) discovered by different methods (Autostrat, PSG_A, PSG_B, Divexplorer, Sliceline, SMART_NSF, and SMART) across various training dataset sizes (10, 20, 50, 100, 200, 500). The results are shown separately for UK and US datasets. The upward-pointing arrow indicates that a higher number is better. The figure demonstrates that SMART consistently outperforms other methods in identifying significant failures, particularly with larger sample sizes. The self-falsification mechanism in SMART requires a sufficient sample size, as the number of significant groups identified by SMART_NSF (without self-falsification) is higher than SMART for smaller datasets, while SMART surpasses it at larger sample sizes. This highlights the benefit of self-falsification for greater accuracy but also suggests the need for larger samples in applying it.

This figure demonstrates the robustness of SMART and data-only methods to false positives (FPs) when dealing with irrelevant features. The experiment involves adding varying numbers of irrelevant, synthetically generated features to real-world datasets. SMART consistently maintains a low proportion of irrelevant features in its identified slices, while the FP rates of data-only methods increase significantly as the number of irrelevant features grows. This shows that SMART’s contextual awareness effectively mitigates the risk of identifying spurious failures due to the presence of irrelevant features.

This figure compares SMART with several data-only methods in terms of robustness to false positives in model testing. The x-axis represents the number of irrelevant features added to the datasets. The y-axis represents the percentage of irrelevant features included in the slices identified by each method. The results show that SMART consistently avoids selecting slices containing irrelevant features, unlike data-only methods whose tendency to include irrelevant features increases dramatically as more are added. This demonstrates the advantage of using contextual information to guide the selection process.
More on tables

This table summarizes the various experiments conducted in the paper to evaluate SMART Testing and its properties. Each row represents a specific experiment, highlighting the goal (e.g., assessing robustness to irrelevant features, measuring the false negative rate), the section in which it is described, and a concise takeaway summarizing the key findings. The table demonstrates the breadth of evaluations performed to validate SMART’s effectiveness and robustness across different scenarios and datasets.

This table presents the results of an experiment designed to evaluate the generalizability of identified model failures across different machine learning models. The study uses four different classifiers (Logistic Regression, SVM, XGBoost, and MLP) to identify slices (subgroups) within a dataset where the model’s performance significantly differs from its average performance. The table shows the absolute difference in accuracy (|∆Acc|) between the top-performing slice (the slice with the largest performance discrepancy) and the overall average performance for each of the four classifiers, averaged across five independent runs. The results highlight the extent to which the discovered failures are consistent and generalizable across various model types.

This table presents the false negative rates (FNR) for various methods under different scenarios. The scenarios involve introducing synthetic underperformance into one, two, or three subgroups within a simulated dataset for a recidivism prediction task. The FNR represents the rate at which a testing method fails to identify these underperforming subgroups. Lower values indicate better performance.

This table presents the results of an experiment designed to evaluate the robustness of SMART to potential LLM biases, specifically focusing on ethnicity-related biases. The experiment simulates a dataset with a predictor function where performance is intentionally corrupted for a proportion (τ) of a minority subgroup (either ‘white’ or ‘black’). The table shows the proportion of times (averaged over 20 runs and 5 seeds) that SMART correctly identifies the corrupted minority subgroup as the top underperforming subgroup for different values of τ. The results demonstrate SMART’s ability to identify model underperformance even when LLMs exhibit inherent biases from training data.

This table compares different ML testing paradigms, including average testing, behavioral testing, data-only testing, and the proposed SMART testing method. It evaluates each paradigm based on its objective, how tests are defined, whether it incorporates context and requirements into the search space, its susceptibility to the multiple testing problem, the degree of automation in the testing process, and the type of outputs generated. The table highlights the strengths and weaknesses of each paradigm in terms of its ability to comprehensively and efficiently assess the reliability and performance of machine learning models.

This table compares SMART testing with two other software testing approaches: Christakis et al. [18] and Sharma et al. [19]. The comparison is made across three criteria: test case generation, the focus of testing, and whether tests are context-aware. For each criterion, the table shows how SMART differs from the other two approaches. SMART uses an LLM for automatic test case generation, while the other two approaches rely on pre-specified dimensions or approximate the black-box model. SMART’s focus is on identifying model failures, whereas the other approaches assess I/O functional correctness or model monotonicity. Finally, SMART uniquely incorporates context awareness into testing, resulting in more realistic assessments.

This table compares several slice discovery methods (SliceFinder, Pysubgroup, DivExplorer, Autostrat) against the proposed SMART Testing method, across various criteria. It highlights SMART’s advantages in incorporating domain knowledge, maintaining consistent discovery times, resisting irrelevant data, capturing rare slices, supporting logical OR operations, and resisting overfitting to training data.

This table summarizes the key experiments conducted in the paper to evaluate the proposed SMART testing framework and its comparison with existing data-only methods. Each row represents a specific experiment designed to assess a particular aspect of SMART, such as its robustness to false positives, ability to identify meaningful failures, generalization capabilities, and sensitivity to LLM biases. The ‘Takeaway’ column provides a concise summary of the key findings from each experiment, highlighting the strengths of SMART compared to other methods.

This table summarizes the characteristics of the seven datasets used in the paper’s experiments. For each dataset, it provides the name, the number of samples (rows of data), the number of features (columns of data), the domain from which the data originates (e.g., Finance, Healthcare), and the specific prediction task performed using that data (e.g., Loan default prediction, Breast cancer diagnosis). The datasets vary in size and domain, reflecting the diversity of real-world applications of machine learning.
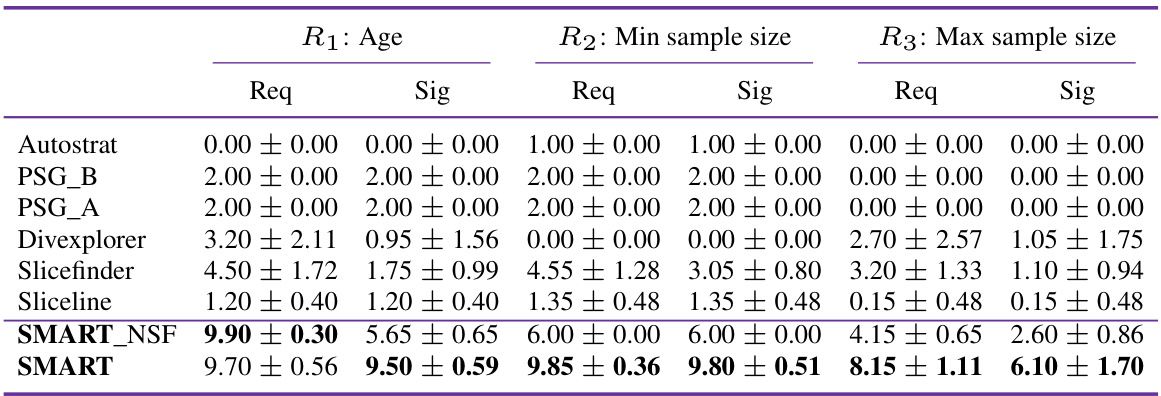
This table presents a quantitative comparison of SMART and several data-only methods (Autostrat, PSG_B, PSG_A, Divexplorer, Slicefinder, Sliceline) in terms of their ability to satisfy three user-defined requirements while identifying statistically significant model failures. The requirements relate to the inclusion of the ‘age’ variable in the top 10 slices, minimum and maximum sample sizes for those slices. For each method and each requirement, the table shows the average number of times (out of a maximum of 10) that the requirement was satisfied and the average number of times (out of a maximum of 10) that the identified slices had statistically significant performance differences compared to the average performance across the dataset.
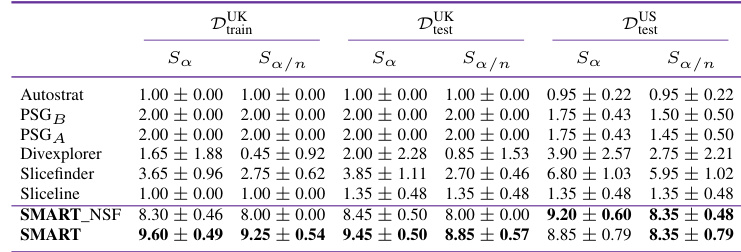
This table presents the results of an experiment evaluating the ability of different methods to identify statistically significant performance discrepancies in model predictions. It compares SMART and several baseline methods across three datasets: the training dataset (DUK_train) and two test datasets (DUK_test and DUS_test). The comparison is done using two metrics: Sa (number of significantly divergent slices at α = 0.05) and Sa/n (number of significantly divergent slices after Bonferroni correction). Higher numbers indicate better performance in identifying meaningful performance discrepancies.

This table presents the results of an experiment evaluating the ability of different methods to identify statistically significant performance discrepancies across various subgroups (slices) of data. It compares the number of significant slices identified by several methods (Autostrat, PSG_B, PSG_A, Divexplorer, Slicefinder, Sliceline, SMART_NSF_GPT4, SMART_GPT4, SMART_NSF_GPT3.5, SMART_GPT3.5) under two conditions: using the training dataset and a separate test dataset, and applying the Bonferroni correction to account for multiple comparisons. The results are shown for different datasets (D_train, D_test, and D_US_test) representing different testing scenarios. A higher number of significant slices indicates a better ability to identify model failures.

This table presents the results of comparing different machine learning models’ ability to identify slices with significant performance discrepancies. The metrics used are the difference in accuracy between the top slice and the average accuracy across all slices, and the associated p-value. Higher accuracy differences and lower p-values indicate better performance. The results are averaged over 5 runs with randomized data splits and seeds.

This table compares the performance of different slice discovery methods in identifying subgroups with significant performance discrepancies for two state-of-the-art deep learning classifiers (TabPFN and TabNet) on the SEER dataset. The values represent the difference in accuracy between the top-performing slice and the average accuracy across all slices. A higher value indicates better performance in identifying meaningful subgroups with large performance discrepancies. The ‘0.00’ entries show cases where a specific method does not support or is not applicable to the corresponding classifier.
This table presents the results of an experiment designed to evaluate the generalizability of identified model failures across different machine learning models. Four different models (Logistic Regression, SVM, XGBoost, and MLP) were used to identify slices with the highest performance discrepancies. The table shows the absolute difference in accuracies (|∆Acc|) between the top-performing slice and the average performance across the four models, averaged over five runs. A higher |∆Acc| indicates a greater discrepancy, suggesting a more significant model failure. The purpose is to demonstrate that SMART can identify model failures that generalize well to different models.

This table presents the results of an experiment designed to evaluate the ability of different methods to identify data slices with significant performance discrepancies. Four different machine learning models (Logistic Regression, SVM, XGBoost, and MLP) were used to analyze a prostate cancer dataset. For each model, the method that identified the slice with the greatest difference in accuracy between the slice and the average performance across the dataset is reported. The table shows the mean accuracy difference and standard deviation across five runs for each method, highlighting which methods performed better in identifying these significant performance differences.

This table compares the performance of four different machine learning models (Logistic Regression, SVM, XGBoost, and MLP) in identifying data slices with significant performance discrepancies. The ‘|∆Acc|’ column represents the absolute difference in accuracy between the top-performing slice and the average performance across all slices, indicating the magnitude of the model’s failure. The p-value indicates the statistical significance of this difference. Higher |∆Acc| values and lower p-values are desirable, indicating more impactful failures. The table shows that SMART consistently identifies slices with substantially larger performance discrepancies than other methods, suggesting its superior ability to locate meaningful model failures.

This table presents the results of an experiment designed to evaluate the performance of different model testing methods in identifying spurious model failures when there is no true underlying relationship between the variables. The experiment used three different data-generating processes to create datasets with varying characteristics. Each method’s performance is assessed by counting the number of slices identified as containing model failures. The lower the number of discovered slices, the better the method’s performance in avoiding false positives.

This table presents the results of an experiment evaluating the number of false positives generated by different model testing methods across three distinct data generation processes. Lower numbers indicate fewer false positives, representing better performance. The methods compared include Autostrat, PSG_B, PSG_A, divexplorer, slicefinder, and SMART. The three data generation processes, Suniform, Sskewed, and Sinteractions, varied in their underlying data distributions and relationships between variables. The SMART method is shown to consistently generate far fewer false positives than the other data-only methods, highlighting its superior performance in this aspect of model testing.

This table summarizes the various experiments conducted in the paper and their key takeaways. Each row represents a specific experiment, detailing its goal (e.g., assessing robustness to false positives, evaluating performance in different deployment environments), the methods used, and the main conclusions drawn from the results. The takeaways highlight key findings such as the effectiveness of the proposed method, SMART, compared to data-only methods in terms of identifying relevant and impactful model failures.

This table summarizes the key experiments conducted in the paper and their respective takeaways. Each row represents a specific experiment designed to evaluate a particular aspect of the SMART Testing framework or to compare it against baseline methods. The ‘Experiment’ column describes the goal of the experiment. The ‘Takeaway’ column concisely summarizes the key finding or conclusion from that experiment. The ‘Sec.’ column references the section of the paper where the experiment and results are discussed in detail.

This table summarizes the various experiments conducted in the paper to evaluate the performance of SMART Testing and its comparison with several data-only baselines across various aspects of ML model testing. Each experiment aims to highlight a specific aspect or limitation of the existing data-only approaches and how SMART addresses them. The table shows the goal of each experiment, the specific evaluation measures used, and the main findings or takeaways obtained from each experiment.
This table presents the results of an experiment evaluating the ability of different methods to identify model failures. The experiment uses four different machine learning models (logistic regression, SVM, XGBoost, and MLP) and compares their performance on a specific ‘slice’ of the data (a subgroup exhibiting the greatest difference in accuracy from average model performance) to their average performance across the entire dataset. The table demonstrates the superior performance of SMART and SMARTNSF (an ablation of SMART without self-falsification) in identifying slices with large performance discrepancies compared to other data-only methods, indicating better generalization and higher accuracy in detecting true model failures.

This table presents the results of an experiment evaluating how well different methods satisfy pre-defined requirements during model testing. It compares SMART against several data-only baselines across three requirements. The first assesses whether the top 10 slices found include the variable ‘age.’ The second and third specify minimum and maximum sample sizes, respectively, for those slices. The table shows the number of times each method satisfied each requirement (Req) and the number of those slices with statistically significant performance differences (Sig) from the average. Higher numbers indicate better performance in fulfilling requirements and detecting meaningful model failures.

This table presents a quantitative comparison of SMART against data-only methods. It evaluates the ability of each method to fulfill three user-specified requirements (Req) while also identifying statistically significant performance differences (Sig) in the generated slices (subgroups within the data where model performance diverges from the average). The maximum score for both Req and Sig is 10, and higher scores indicate better performance. The results show SMART consistently outperforms data-only methods in satisfying requirements and identifying significant performance differences.
Full paper#


