↗ OpenReview ↗ NeurIPS Homepage ↗ Chat
TL;DR#
Graph Neural Networks (GNNs) are widely used in machine learning for analyzing graph-structured data. However, a core issue is understanding their limitations and expressive power. This research investigates the behavior of GNNs as they are applied to larger and larger graphs generated from random graph models, examining how their outputs evolve. The paper addresses the question of whether GNNs can uniformly express complex graph properties and how the outputs change as graph sizes increase.
This research uses a novel approach, analyzing the convergence properties of a wide class of GNNs using a flexible aggregate term language. The key findings demonstrate that many real-valued GNN classifiers unexpectedly converge to a constant function, regardless of the input graph structure. This strong convergence is proven for several graph models, demonstrating a critical limitation in the uniform expressiveness of these GNN architectures. The theoretical results are supported by extensive empirical findings across various GNN architectures and real-world datasets.
Key Takeaways#
Why does it matter?#
This paper is crucial because it reveals fundamental limitations of Graph Neural Networks (GNNs), impacting numerous applications. It challenges existing assumptions about GNN expressiveness, providing valuable insights for model design and interpretation. The study also opens new avenues for research focused on overcoming these limitations, potentially leading to more powerful and reliable GNN architectures.
Visual Insights#
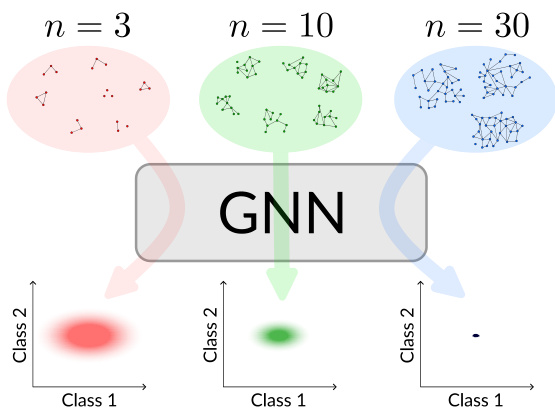
This figure shows how the output of graph neural networks (GNNs) changes as the size of the input graph increases. Three different graph sizes (n=3, n=10, n=30) are shown, each with multiple graphs of that size. The GNN processes each graph and produces a 2D output, represented as a point on a graph with ‘Class 1’ and ‘Class 2’ axes. As the graph size increases, the output points converge to a single point, indicating that the GNN’s output becomes independent of the input graph structure for sufficiently large graphs. This demonstrates the phenomenon of ‘almost sure convergence’ to a constant distribution.
In-depth insights#
GNN Convergence#
The study of GNN convergence reveals fundamental limitations in their expressive power. It demonstrates that, under broad conditions including common aggregation mechanisms and diverse random graph models, many GNN architectures exhibit asymptotic convergence to constant outputs. This means that for sufficiently large graphs, the model’s predictions become independent of the input graph structure, essentially upper-bounding their capacity to discriminate between graphs. This strong convergence phenomenon highlights a critical limitation: GNNs, despite empirical success, are inherently constrained in what they can express uniformly across all graph sizes. The findings provide theoretical support to the observed phenomenon with rigorous proofs for various graph models. Empirical results validate the theory, showcasing rapid convergence on different random graph models. Notably, the study extends beyond the scope of simple graph classification, implying limitations in node and edge classification tasks as well. The research further explores the robustness of convergence across diverse architectural choices, emphasizing the wide applicability of the limitations uncovered. This provides invaluable insights into the capabilities and boundaries of GNNs, guiding future research towards improving their expressive power and generalization abilities.
Expressive Power Limits#
The heading ‘Expressive Power Limits’ suggests an investigation into the boundaries of what graph neural networks (GNNs) can represent and learn. The research likely explores limitations in GNNs’ ability to capture complex graph structures or relationships. This could involve analyzing the expressive power of different GNN architectures, identifying tasks beyond their capabilities, or demonstrating scenarios where GNNs fail to generalize effectively. A key aspect might be the relationship between GNN architecture, the type of graph data used, and the complexity of the learning task. The analysis may involve theoretical proofs or empirical evaluations on benchmark datasets to establish these limits. The findings could highlight the need for improved GNN designs or alternative methods for certain graph-related problems. Another potential focus is on the uniform versus non-uniform expressivity of GNNs, comparing their performance on graphs of varying sizes or complexities. The work may propose new theoretical frameworks for understanding and characterizing these limitations, potentially informing future research on enhancing GNN capabilities or exploring alternative models.
Aggregate Term Language#
The Aggregate Term Language, as presented in the paper, is a formal language designed to represent the computations performed by a wide range of graph neural network architectures. Its core strength lies in its abstraction away from low-level architectural details, enabling the analysis of a broad class of GNNs under a unified framework. The language’s structure centers around recursive definitions of terms, using basic primitives like node features and constants, combined with operators such as weighted mean aggregation and random walk positional encoding. This enables the representation of various GNN components such as layers, attention mechanisms, and pooling operations. A key advantage of this approach is its generality: the same convergence laws can be applied to many seemingly diverse GNN architectures, simplifying the analysis of their expressive power and identifying limitations. Uniform expressiveness, focusing on what functions GNNs can express on uniformly distributed inputs, rather than specific graph structures, is highlighted. This approach moves beyond traditional non-uniform analysis to reveal inherent limitations of GNNs by proving that many models will converge to a constant output given increasingly larger graphs. This leads to impossibility results for certain graph classification tasks, ultimately giving a more nuanced understanding of GNNs’ capabilities and their inherent limitations.
Random Graph Models#
Random graph models are crucial for evaluating the generalization capabilities and inherent limitations of Graph Neural Networks (GNNs). By generating graphs with controlled properties, such as sparsity, density, or community structure, these models enable rigorous analysis of GNN performance beyond real-world datasets which may exhibit unknown biases. The choice of random graph model significantly impacts the observed behavior of GNNs, influencing convergence rates and the expressiveness of different architectures. Sparse models are particularly relevant, as they better reflect the structure of many real-world graphs, although they present greater theoretical challenges. Studies using these models often reveal unexpected convergence patterns, sometimes demonstrating that GNNs converge to a constant output regardless of input, highlighting potential limitations in their ability to capture complex graph features. Ultimately, rigorous analysis with diverse random graph models is essential for developing more robust and theoretically grounded GNNs.
Empirical Validation#
An empirical validation section in a research paper would systematically test the paper’s theoretical claims. This would involve designing experiments using appropriate datasets, graph generation models (e.g., Erdős-Rényi, Barabási-Albert, Stochastic Block Model), and GNN architectures. The experiments would measure key metrics, like the convergence rate of GNN outputs to a constant value as graph size increases, and quantify variations across different architectures and graph generation parameters. Statistical significance testing would be crucial to demonstrate that observed results are not due to random chance. The section should clearly state the experimental setup, dataset details, evaluation metrics, and statistical methods used. Visualization techniques, such as plots showing convergence trends with error bars, help illustrate the findings. Comparisons between different GNN architectures or graph models might also be included to reveal performance differences and identify potential factors driving convergence behavior. Finally, a discussion of the empirical findings in relation to the theoretical predictions, including any discrepancies and possible explanations, is essential for a comprehensive empirical validation.
More visual insights#
More on figures

This figure shows how the output of Graph Neural Networks (GNNs) changes as the size of the input graph increases. The GNNs are applied to graphs of increasing size (n=3, n=10, n=30) drawn from a random graph model. The figure demonstrates that the GNN’s output converges to a constant value, independent of the input graph structure, as the graph size increases. This convergence implies limitations on the expressiveness of these GNN architectures.

This figure shows the convergence of class probabilities for three different Erdős-Rényi random graph models (dense, logarithmic growth, and sparse). Five mean class probabilities are plotted for each model across various graph sizes, along with standard deviations to illustrate the convergence speed. The different colors represent the different class probabilities. It highlights differences in convergence time, standard deviation, and final converged values between the dense, logarithmic growth, and sparse graph models.

This figure shows the standard deviation of the Euclidean distances between the class probabilities and their means across various samples of each graph size for the GPS+RW architecture. It illustrates how the standard deviation changes as the graph size increases for different graph models (ER(n, p(n) = 0.1), SBM, BA(n, m = 5)). The plots demonstrate the convergence of the standard deviation towards zero as graph sizes increase, supporting the paper’s central claim of asymptotic convergence.
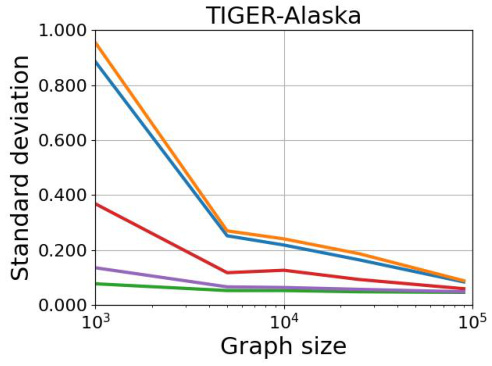
This figure shows the standard deviation of the Euclidean distances between the class probabilities and their respective means. The data is from the TIGER-Alaska dataset and uses the MeanGNN architecture. It empirically demonstrates the convergence of class probabilities on a real-world graph, although at a slower rate than observed for random graphs. The graph shows how the standard deviation decreases as the graph size increases, indicating a convergence towards a constant distribution.
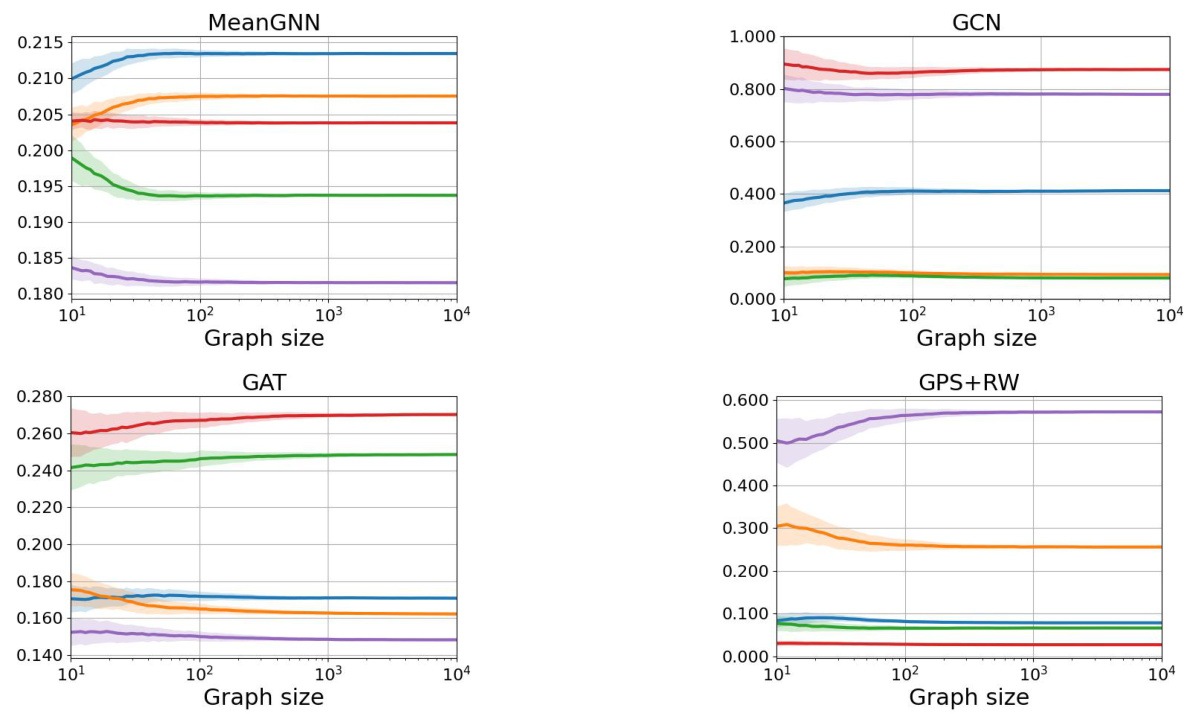
This figure displays the results of three different experiments on the convergence of class probabilities for three variations of the Erdős-Rényi random graph model. Each plot shows five lines representing the probabilities of the five classes over a range of graph sizes. The lines represent the average probabilities across 100 samples for each graph size and the shaded area around each line shows the standard deviation. The three plots correspond to different density regimes for the Erdős-Rényi model. The plots show that as the graph size increases, the class probabilities converge to a constant value in all three cases, thus empirically validating the convergence phenomenon.
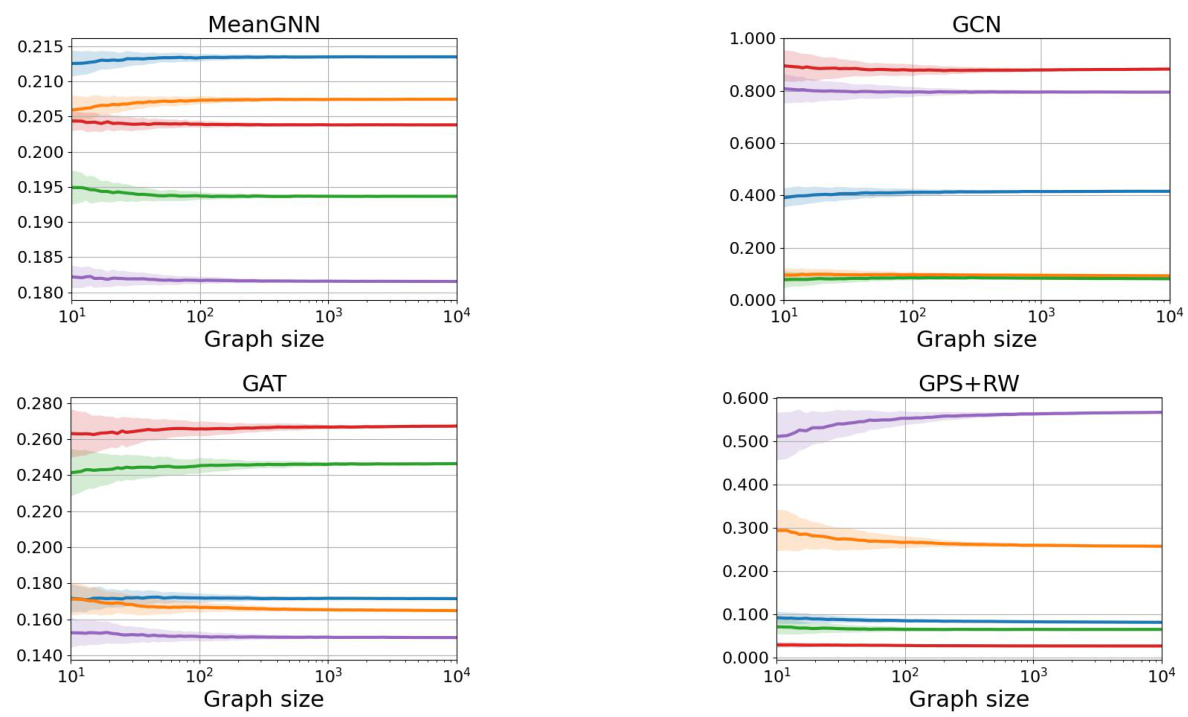
This figure presents the results of an experiment showing the convergence of class probabilities over different graph distributions. The plots display the mean class probabilities (averaged over 100 samples per graph size) for five different classes, along with their standard deviations. Three Erdos-Renyi graph models are considered: dense (p=0.1), logarithmic growth (p=logn), and sparse (p=50/n). The convergence to a constant distribution is clearly observable for all distributions, with varying convergence speeds and standard deviations.
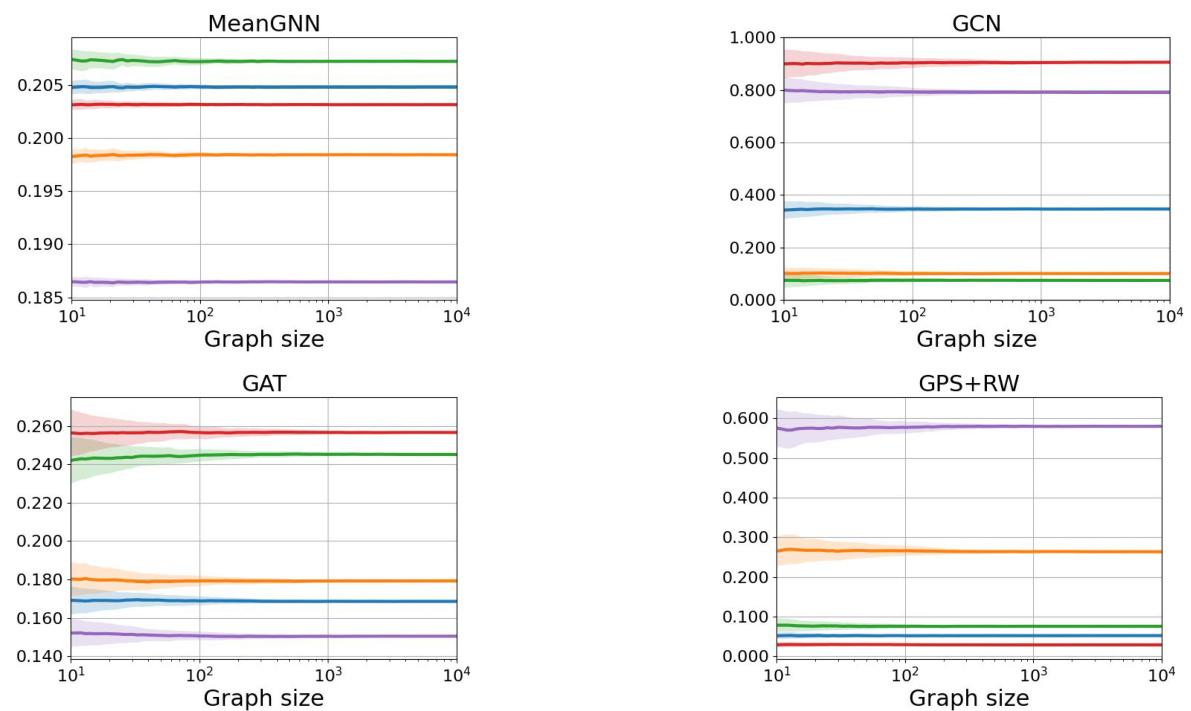
This figure visualizes the convergence of class probabilities for three different Erdos-Renyi random graph models (dense, logarithmic, and sparse) across five model initializations. Each line represents a class probability, and the shaded area shows the standard deviation. The figure demonstrates that the class probabilities converge to a constant value for all models, supporting the authors’ claim of almost sure convergence.
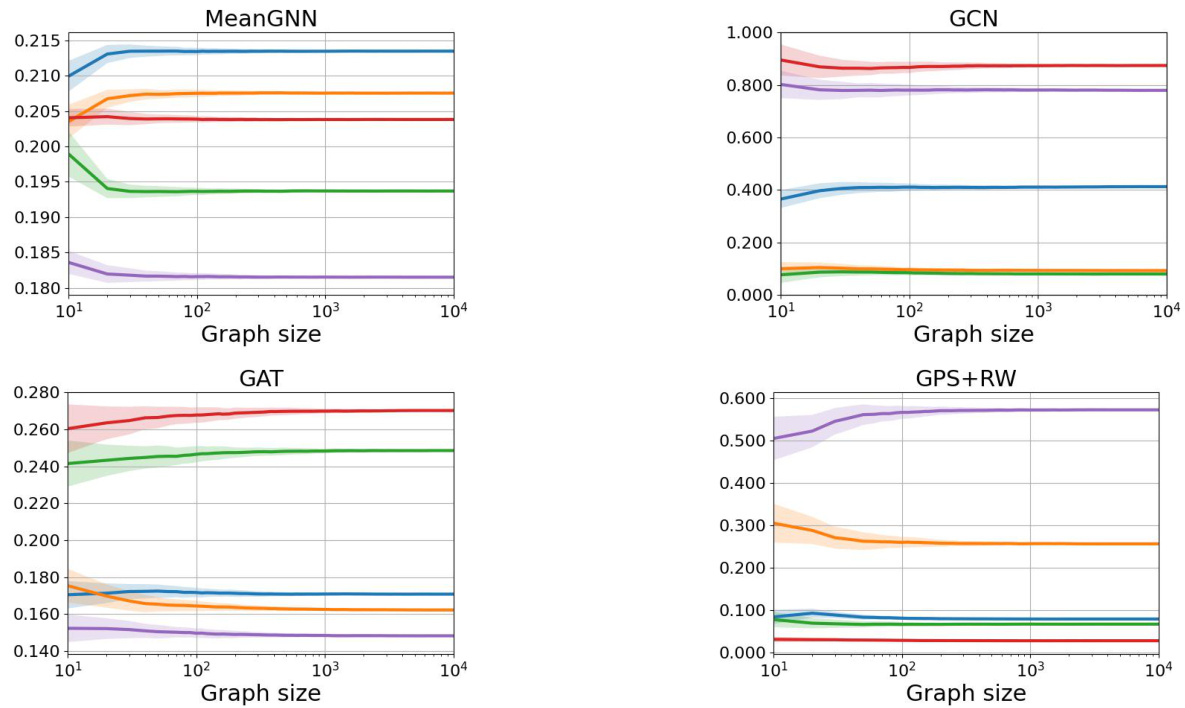
This figure shows the convergence of class probabilities for three different Erdős-Rényi graph models (dense, logarithmic growth, and sparse) across three different GNN architectures (MeanGNN, GAT, and GPS+RW). Each line represents a different class probability, and the shaded area around each line represents the standard deviation. The figure demonstrates that, despite differences in convergence speed and standard deviation, all models converge to a constant class probability distribution for the dense and logarithmic growth models, while the sparse model shows a different convergence pattern.
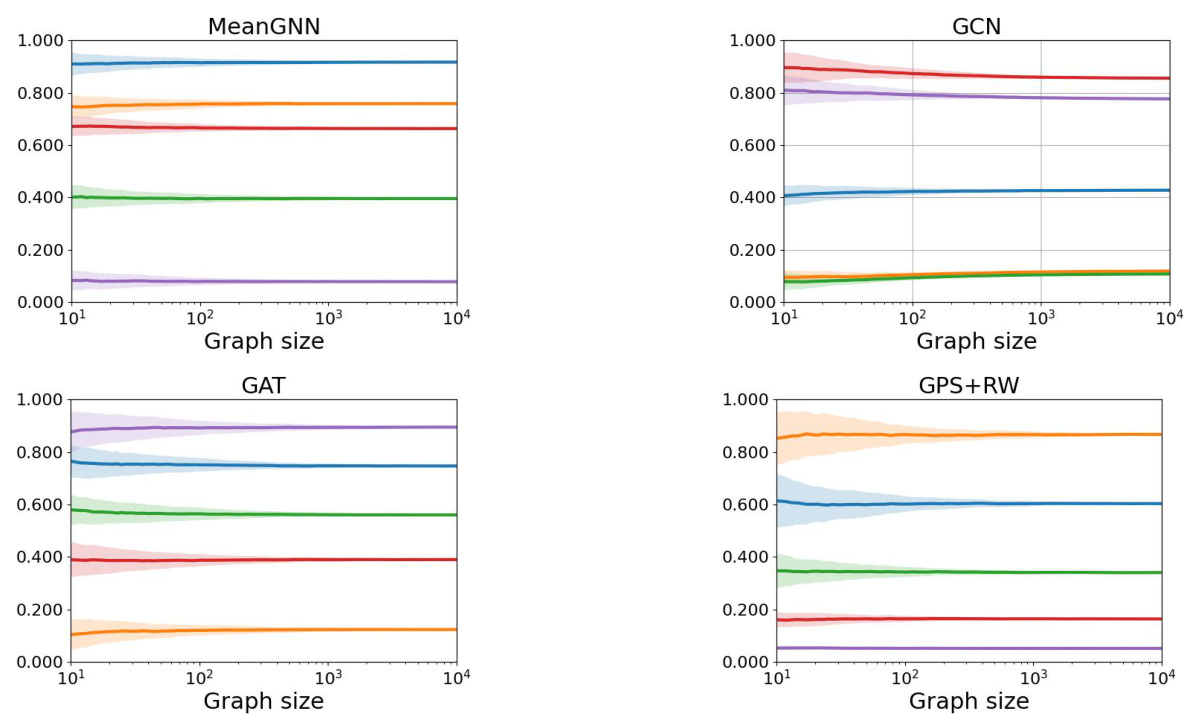
This figure displays the convergence of class probabilities for three different Erdős-Rényi random graph models: dense (p=0.1), logarithmic growth, and sparse (p=50/n). Each plot shows five class probabilities, with error bars representing standard deviations across 100 samples for each graph size. The convergence demonstrates that, as the graph size increases, the GNN’s predictions tend towards a constant distribution. This finding holds for the MeanGNN, GAT, and GPS+RW architectures, illustrating the robustness of the phenomenon.
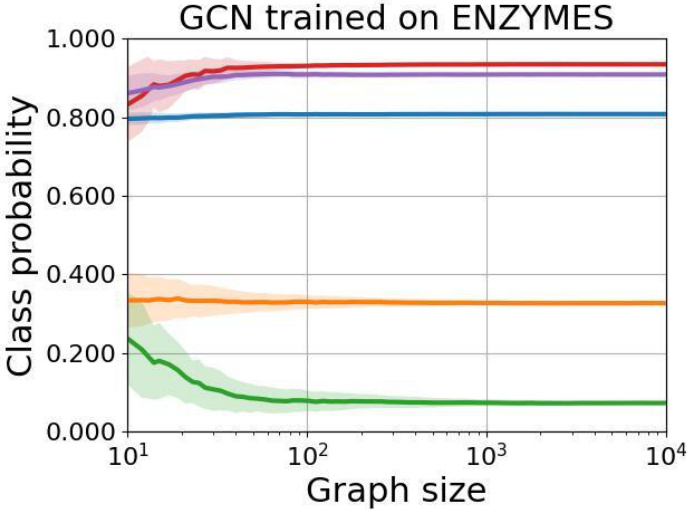
This figure shows the class probabilities of a three-layer Graph Convolutional Network (GCN) trained on the ENZYMES dataset, when tested on Erdős-Rényi random graphs with increasing sizes and a fixed edge probability. The results show the mean class probabilities along with standard deviations, illustrating the convergence of the model’s output to a constant distribution.
Full paper#


