TL;DR#
Accurately detecting lane lines is crucial for autonomous driving, but current computer vision methods struggle with real-world challenges like occlusions and varying lighting. These methods usually rely on fine-scale details, making them vulnerable to these issues. The difficulty is further compounded by the inherent thin and long nature of lane lines, making precise localization challenging.
To address these problems, the researchers developed a novel method called LAne TRansformer (LATR). This approach uses a Siamese Transformer structure with hierarchical refinement, effectively combining global context with fine details. A new Curve-IoU loss function further enhances accuracy by specifically addressing the unique shape of lane lines. Extensive testing showed that LATR outperforms existing methods, demonstrating significant improvement in accuracy and efficiency.
Key Takeaways#
Why does it matter?#
This paper is important because it addresses the challenges of accurate lane detection in complex driving conditions. Current methods often struggle with occlusion and poor lighting. This work’s novel Siamese Transformer with hierarchical refinement and Curve-IoU loss significantly improves accuracy, paving the way for safer and more robust autonomous driving systems. The proposed method is highly efficient, achieving state-of-the-art results on benchmark datasets, making it highly relevant to ongoing research in autonomous driving and computer vision.
Visual Insights#

🔼 The figure illustrates the overall architecture of the proposed lane detection method. It shows a multi-scale backbone (using Swin Transformer) extracting hierarchical features from an input image. These features are then fed into a Siamese Transformer structure called LATR, which integrates both global semantic and finer-scale features. LATR processes a lane query to refine keypoints of lane lines. The output of LATR passes through two feed-forward networks (FFNs): one for curve properties (start point, angle, length) and one for offset calculations. Finally, a Curve-IoU loss function supervises the fitting of predicted lane lines to ground truth, ensuring accuracy.
read the caption
Figure 1: The overall architecture of our proposed method. It includes a multi-scale backbone to extract hierarchical features from the input image, a Siamese Transformer structure named LATR to integrate global semantics information and finer-scale features, and a Curve-IoU loss to supervise the fit of lane lines for model training. Swin level 1-3 denotes the multi-scale backbone using the Swin Transformer. FFN represents a feed-forward network.

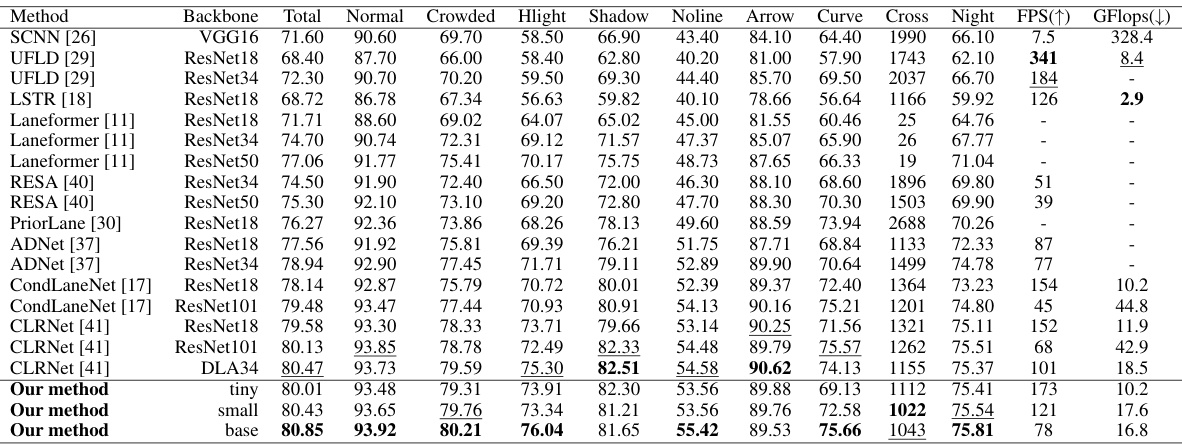
🔼 This table compares the performance of various lane detection methods on the OpenLane dataset. It includes metrics such as F1 score (overall and broken down by scenario), frames per second (FPS), and GFlops. The table highlights the superior performance of the proposed method compared to existing state-of-the-art techniques.
read the caption
Table 1: Comparison results of recent methods and our method on the OpenLane dataset. In order to compare the computation speeds in the same setting, we remeasure FPS on the same machine with an RTX3090 GPU using open-source code (if code is available). The best results in each column are marked as bold and the second best results are underlined.
In-depth insights#
Siamese Transformer#
The concept of a “Siamese Transformer” for lane detection is intriguing and potentially powerful. It leverages the strengths of both Siamese networks, which excel at comparing image pairs to identify similarities or differences, and Transformers, which are adept at capturing long-range dependencies within data. In the context of lane detection, a Siamese architecture could effectively compare feature maps from different parts of the image or even across consecutive frames to improve robustness to occlusions and challenging lighting conditions. This comparison process, done efficiently with the Transformer, could highlight key lane features, enhancing accuracy. The hierarchical refinement aspect mentioned further suggests that the model progressively refines lane detection by combining global semantic information with detailed local features, leading to a more accurate and complete lane map. This approach could address the common challenges of thin, elongated lane markings, which are easily distorted in adverse conditions. The combination of these elements presents a sophisticated technique capable of addressing some limitations of previous methods.
Hierarchical Refinement#
The concept of “Hierarchical Refinement” in the context of lane detection, as described in the research paper, involves a multi-stage process that progressively refines the detection of lane lines. It starts with high-level semantic information, capturing the overall context and structure of the lanes. Then, this global understanding is combined with low-level, fine-grained features to pinpoint lane line keypoints more precisely. This hierarchical approach is crucial because lane lines, being thin and long, require a delicate balance of broad contextual awareness and precise localization. A Siamese Transformer network is employed to integrate these different levels of information effectively. By adopting a high-to-low refinement scheme, the network learns to refine its understanding iteratively, ultimately leading to more accurate and robust lane detection, especially in challenging conditions like poor lighting or heavy occlusion.
Curve-IoU Loss#
The proposed Curve-IoU loss function is a novel approach to address limitations in existing Intersection over Union (IoU) methods for lane detection. Standard IoU struggles with the thin and elongated nature of lane lines, often misjudging the proximity of predicted lines to ground truth, especially when curves are present. Curve-IoU enhances IoU by incorporating a penalty term based on the L1 distance between corresponding points on the predicted and ground truth lane lines. This penalty is particularly effective for handling significant deviations, especially common in curved lane scenarios. The use of a sequence of points with a defined width in the calculation further refines the measure, improving accuracy and addressing cases where standard IoU might fail. This modification makes the loss function more robust and sensitive to positional discrepancies, leading to more accurate lane line regression, particularly beneficial in challenging driving environments.
Ablation Studies#
Ablation studies systematically remove components of a model to assess their individual contributions. In this context, the ablation study would likely involve removing parts of the Siamese Transformer with Hierarchical Refinement (e.g., removing the Siamese component, removing the hierarchical refinement, or altering the Curve-IoU loss) to determine their impact on overall performance. The results would quantify the effect of each component on key metrics like F1 score and accuracy, providing valuable insights into the design choices. For instance, removing the Siamese structure might reveal whether the sharing of parameters significantly improves performance or efficiency. Similarly, isolating the impact of hierarchical refinement would show whether progressive refinement stages are crucial for accuracy in complex scenarios. Finally, testing different loss functions would determine the efficacy of Curve-IoU in handling the unique properties of lane lines. Such analysis is vital for demonstrating the model’s effectiveness and identifying the core components crucial for its success.
Future Directions#
Future research could explore more sophisticated Transformer architectures to further improve accuracy and efficiency. Investigating alternative loss functions beyond Curve-IoU, perhaps incorporating geometric constraints or adversarial training, could enhance lane line fitting. Addressing challenging scenarios, such as heavy rain, fog, or extreme lighting conditions, requires robust feature extraction and representation techniques. The development of a unified model capable of handling various lane types and road conditions, moving beyond the current dataset-specific approaches, is a crucial direction. Finally, exploring integration with other sensor modalities, such as LiDAR or radar, would offer complementary information to improve lane detection robustness in complex environments. This multi-faceted approach promises a step change in autonomous driving safety.
More visual insights#
More on figures

🔼 The figure shows the detailed architecture of the proposed LAne TRansformer (LATR). It uses a high-to-low refinement structure. The input lane query is processed by a feed-forward network (FFN), and then fed into a deformable attention module. This module incorporates hierarchical features which refine the lane query. The refined lane query is further processed by a self-attention mechanism before being outputted.
read the caption
Figure 2: The detailed structure of our proposed LAne TRansformer (LATR). We employ a high-to-low refinement structure in which the input lane query is refined by higher-scale features.

🔼 Figure 3(a) shows a common limitation of the LIoU loss function where it fails to accurately assess the distance between a ground truth lane line and its predictions when the lane lines have significant curvature. The inability to distinguish between predictions A and B is evident. Figure 3(b) illustrates the comparative performance of LIoU and Curve-IoU (CIoU) loss functions when considering the L1 distance between the ground truth and predictions. This visualization emphasizes that the CIoU loss function provides more accurate distance representations, particularly for significantly curved lane lines. The CIoU loss function enhances the precision of lane line detection in scenarios with notable curvature.
read the caption
Figure 3: (a) a typical failure scenario for LIoU, which cannot measure the distances between Ground Truth and Predictions A and B; (b) the values of LIoU and Curve-IoU.

🔼 This figure displays a comparison of lane detection results from three different methods: CondLaneNet, CLRNet, and the authors’ proposed method. The results are shown side-by-side with the ground truth for easy comparison. Different colors represent different lane lines. The F1 score, a common metric for evaluating lane detection, is displayed in the upper left corner of each image, allowing for a quantitative assessment of performance across various methods. The images depict diverse road conditions and lighting scenarios, illustrating how each approach handles challenges.
read the caption
Figure 5: Visualization results of Ground Truth (GT), CondLaneNet [17] (CondLane), CLRNet [41], and our method on CULane [26]. The results of CondLaneNet and CLRNet are generated with ResNet18 and ours are generated with Swin Transformer tiny. Different lane lines are represented by different colors. The F1 score for each predicted image is labeled in the top left corner of the image.

🔼 This figure shows the attention maps generated by the proposed LAne TRansformer (LATR) at different levels. The high-to-low hierarchical refinement structure of LATR is visualized. Higher levels focus on broader contextual information along the lane, while lower levels increasingly concentrate on the precise location of key points along the lane lines. This demonstrates how LATR integrates global semantics with fine-scale features for accurate lane detection.
read the caption
Figure 4: High-to-low attention maps of our proposed LATR.

🔼 This figure shows a qualitative comparison of lane detection results on the CULane dataset. It compares the ground truth lane markings (GT) with the predictions from CondLaneNet, CLRNet, and the authors’ proposed method. Different colored lines represent different lanes. The F1 score for each image is shown in the top-left corner, providing a quantitative assessment to supplement the visual comparison.
read the caption
Figure 5: Visualization results of Ground Truth (GT), CondLaneNet [17] (CondLane), CLRNet [41], and our method on CULane [26]. The results of CondLaneNet and CLRNet are generated with ResNet18 and ours are generated with Swin Transformer tiny. Different lane lines are represented by different colors. The F1 score for each predicted image is labeled in the top left corner of the image.
More on tables

🔼 This table presents a comparison of the proposed method’s performance against other state-of-the-art lane detection methods on the CULane dataset. The comparison includes various metrics such as F1 score, across different driving scenarios (normal, crowded, highlight, shadow, no-line, arrow, curve, cross, and night). The table also shows the backbone network used for each method, along with the Frames Per Second (FPS) and Giga Floating-point Operations (GFlops) to evaluate efficiency.
read the caption
Table 2: Comparison results of recent methods and our method on the CULane dataset.

🔼 This table presents a comparison of the performance of various lane detection methods on the Tusimple dataset. The metrics used for comparison include F1 score, accuracy, false positive rate (FP), and false negative rate (FN). The table allows for a direct performance comparison between different methods and their associated backbones.
read the caption
Table 3: Comparison results on the Tusimple dataset.

🔼 This table presents the ablation study results focusing on the Lane Transformer (LATR) component of the proposed method. It shows the F1 scores and FPS achieved using different Transformer architectures (ViT, DETR, Deform) and different refinement levels of LATR (p0, p3, and p0→p3). The p0→p3 row indicates the combination of high-to-low refinement, demonstrating the effectiveness of the proposed hierarchical refinement structure.
read the caption
Table 4: Ablation study results of the Lane Transformer on the CULane dataset with the same backbone (Swin Transformer tiny).

🔼 This table demonstrates the impact of different loss functions on the performance of the proposed lane detection method. It compares the F1 scores achieved on the OpenLane and CULane datasets using several loss functions: no loss, smooth L1 loss, RIOU, LIOU, and the proposed Curve-IoU loss. The results show that the Curve-IoU loss consistently outperforms other loss functions, indicating its effectiveness in improving lane line regression accuracy.
read the caption
Table 5: Effect of our proposed Curve-IoU on OpenLane and CULane. 'w/o IoU' denotes optimizing with no IoU loss.

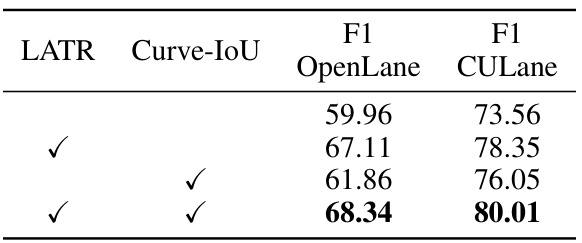
🔼 This ablation study investigates the individual contributions of the LATR (Lane Transformer) and Curve-IoU loss components to the overall model performance. By comparing the F1 scores on the OpenLane and CULane datasets under different configurations (LATR only, Curve-IoU only, and both LATR and Curve-IoU), the table quantifies the performance gains achieved by each component. This helps to understand the relative importance and effectiveness of each part of the proposed model architecture.
read the caption
Table 6: Results of the overall ablation study with the same backbone. We conduct the overall ablation study based on the same baseline LSTR [18].

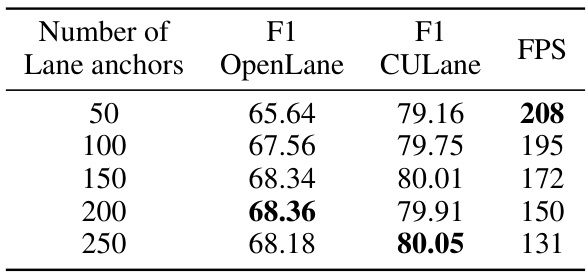
🔼 This table presents the ablation study results focusing on the impact of varying the number of lane anchors on the model’s performance. The study was conducted on the CULane dataset, and the results are reported in terms of F1 scores for both OpenLane and CULane datasets, along with the Frames Per Second (FPS) rate. The table shows that increasing the number of anchors initially improves performance (F1 score), reaching a peak at 200 anchors. However, further increasing the number of anchors beyond this point leads to diminishing returns, indicating that there’s an optimal number of anchors for this specific task and dataset.
read the caption
Table 7: Results of the ablation study on the number of lane anchors. 'FPS' denotes the FPS on the CULane dataset.

🔼 This table presents the results of replacing the backbones of several previous lane detection methods (CondLaneNet and CLRNet) with the Swin Transformer. The goal is to show the impact of the backbone architecture on the performance of different models, comparing their F1 scores on the CULane dataset using both the ’tiny’ and ‘base’ versions of the Swin Transformer backbone. The ‘Ours’ row shows the performance of the proposed method with the Swin Transformer backbone.
read the caption
Table 8: Replace the backbones of previous methods with Swin Transformer.

🔼 This table presents the results of an ablation study on the number of LATR (Lane Transformer) modules used in the model. It shows how the F1 score on the CULane dataset changes as the number of LATR modules is varied (1, 2, or 3). This helps to determine the optimal number of LATR modules for best performance.
read the caption
Table 9: Performance with Different Numbers of LATR Modules.

🔼 This table shows the results of an ablation study on adding LATR modules to different layer levels of the network. It demonstrates the impact of increasing the number of LATR modules on the F1 score of the model on the CULane dataset, and shows a slight improvement when adding modules to both the lowest and second-lowest feature levels. The parameter counts are also provided, showing minimal increase in parameters with the addition of more LATR modules.
read the caption
Table 10: Impact of Adding 2 LATR Modules to lowest and second lowest feature levels
Full paper#


