↗ OpenReview ↗ NeurIPS Homepage ↗ Chat
TL;DR#
Deep learning models, especially Transformers, suffer from the oversmoothing problem where representations across layers become similar, thus hindering performance. This paper proposes a novel solution to oversmoothing by reinterpreting the self-attention mechanism of Transformers as a graph filter and designing a more effective graph filter called Graph Filter-based Self-Attention (GFSA). GFSA enriches self-attention with more diverse frequency information, improving the learning of latent representations and addressing the oversmoothing issue.
GFSA achieves significant performance improvements across various domains, including computer vision, natural language processing, graph-level tasks, speech recognition, and code classification. It demonstrates that GFSA can be integrated with various Transformer architectures without incurring significant computational overhead. The authors also suggest selectively applying GFSA to even-numbered layers to further mitigate the computational overhead. This innovative approach offers a new perspective on attention mechanisms and could lead to more effective Transformer designs.
Key Takeaways#
Why does it matter?#
This paper is crucial because it tackles the oversmoothing problem in Transformers, a significant hurdle in deep learning. By offering a novel approach using graph filters, it improves performance across diverse applications and opens up new avenues for research in efficient and effective Transformer architectures. The insights from graph signal processing offer a fresh perspective on self-attention mechanisms, which could revolutionize other deep learning models.
Visual Insights#

This figure shows the performance improvement achieved by integrating the proposed Graph Filter-based Self-Attention (GFSA) with various Transformer models across different tasks. The improvements are presented as percentages, indicating the increase in performance obtained by adding GFSA compared to the original models. Noteworthy is that these improvements were achieved with the addition of only a small number of parameters (tens to hundreds) to the base Transformers, highlighting the efficiency of the proposed method.

This table presents the results of experiments conducted on the GLUE benchmark, a widely used collection of datasets for evaluating natural language understanding systems. The table compares the performance of three different pre-trained large language models (BERT, ALBERT, and RoBERTa) with and without the proposed Graph Filter-based Self-Attention (GFSA) method. The results are broken down by individual GLUE task (e.g., CoLA, SST-2, MRPC, etc.) and show the average performance across all tasks. It also includes a comparison against a related method called ContraNorm.
In-depth insights#
GFSA: A Graph Filter#
The proposed GFSA (Graph Filter-based Self-Attention) reimagines the self-attention mechanism within transformers as a graph filter. This is a significant conceptual shift, framing the interactions between tokens as a graph signal processing problem. Instead of simply weighting token relationships, GFSA introduces a more sophisticated graph filter, incorporating identity and polynomial terms. This design aims to mitigate the oversmoothing problem often observed in deep transformers, which leads to diminished representational power. The polynomial terms allow GFSA to learn richer, more nuanced interactions, capturing both low-frequency (smoothness) and high-frequency (diversity) aspects of the data. This improved filtering is shown to enhance transformer performance across a variety of tasks, suggesting the broader applicability and effectiveness of this novel approach to self-attention. GFSA’s increased complexity over traditional self-attention is carefully managed, with strategies proposed to limit additional computational cost.
Oversmoothing Effects#
Oversmoothing, a critical issue in deep learning models like Transformers and Graph Neural Networks (GNNs), refers to the phenomenon where node or token representations converge to indistinguishable values across layers. This loss of information significantly hinders performance as the model loses the ability to distinguish between features. The paper addresses this by interpreting self-attention as a graph filter. The central idea is that the original self-attention mechanism acts as a low-pass filter, excessively suppressing high-frequency components crucial for distinguishing tokens. By redesiging self-attention using a graph signal processing perspective and introducing graph filter-based self-attention (GFSA), the paper aims to overcome this limitation. GFSA mitigates oversmoothing by enriching the frequency response of the attention mechanism, allowing the network to retain crucial high-frequency information, thus leading to improved performance. The use of polynomial graph filters of varying complexity are explored, demonstrating the effectiveness of GFSA in various domains. The selective application of GFSA to specific layers further optimizes the tradeoff between accuracy gains and computational overhead.
GSP-Based Self-Attn#
The heading ‘GSP-Based Self-Attn’ suggests a novel approach to self-attention mechanisms in Transformer networks, leveraging principles from Graph Signal Processing (GSP). This framework likely reinterprets the self-attention operation as a form of graph filtering, where tokens are treated as nodes in a graph, and the attention weights represent edge connections. Instead of relying solely on the dot-product based attention, a GSP-based approach would likely incorporate graph convolutional operations or other GSP-inspired filters to aggregate information from neighboring nodes. The resulting self-attention mechanism could potentially mitigate the issue of oversmoothing in deep Transformers, allowing for the preservation of finer-grained information throughout the network’s layers. Furthermore, this approach likely offers opportunities for improved efficiency and generalization capabilities compared to traditional self-attention methods.
Experimental Results#
The ‘Experimental Results’ section of a research paper is crucial for validating the claims and demonstrating the effectiveness of the proposed methodology. A strong ‘Experimental Results’ section would present results across multiple datasets and/or tasks, showcasing consistent improvements over existing baselines. Clear visualizations (graphs, charts, tables) are essential for effective communication and readily highlight key performance metrics. Moreover, a thoughtful discussion should analyze the results in detail, explaining both successful and less successful aspects of the approach. Statistical significance must be explicitly addressed, providing error bars or confidence intervals to avoid overstating the impact of results. The section must also critically evaluate the limitations, considering factors like computational cost, data limitations, and generalizability. A well-rounded presentation of experimental results fosters trust and confidence in the research’s contributions, offering valuable insights into the real-world applicability of the proposed technique.
Runtime & Efficiency#
The runtime and efficiency of the proposed GFSA method are crucial considerations. While GFSA offers performance improvements, it introduces a slight increase in computational cost due to the addition of higher-order terms. The paper addresses this limitation by proposing a selective application strategy, applying GFSA only to even-numbered layers to mitigate runtime overhead while preserving much of the performance gains. Further efficiency gains are explored by integrating GFSA with linear attention mechanisms, achieving linear complexity with respect to sequence length, significantly reducing runtime and GPU usage. The experimental results demonstrate the effectiveness of these strategies, showing that GFSA’s performance improvements outweigh the moderate increase in computational requirements, especially when the selective application strategy is employed. The trade-off between accuracy gains and computational cost is carefully analyzed and addressed, making GFSA a practical and effective method for enhancing Transformers.
More visual insights#
More on figures

This figure visualizes the impact of GFSA on DeiT-S (a small version of DeiT) performance on ImageNet-1k. It presents three sub-figures: (a) Filter response: Shows the frequency response of the original DeiT-S and DeiT-S with GFSA in the frequency domain. GFSA shows a wider range of frequencies used compared to vanilla DeiT-S, suggesting improved ability to capture diverse features. (b) Cosine similarity: Shows the cosine similarity between feature vectors across layers for both DeiT-S models. GFSA helps mitigate the oversmoothing problem, maintaining feature distinguishability across layers. (c) Singular value: Shows the singular values of the feature matrix of the last block. GFSA helps mitigate the dimensionality collapse in Transformer-based models by retaining more significant singular values.

This figure demonstrates the effectiveness of selectively applying GFSA to even-numbered layers in a 12-layer DeiT-S model trained on ImageNet-1k. The bar chart shows that applying GFSA to all layers (+‘GFSA’) improves top-1 accuracy from 79.8% to 81.1%, but significantly increases the runtime per epoch from ~551s to ~814s. In contrast, applying GFSA only to even-numbered layers (+‘GFSAeven’) maintains a similar improvement in top-1 accuracy (81.0%) while significantly reducing the runtime increase to ~595s. This highlights the strategy’s success in balancing improved accuracy and reduced computational cost.

This figure compares the performance, runtime, and GPU usage of different Transformer models, both with and without the proposed GFSA (Graph Filter-based Self-Attention) on the Long-Range Arena benchmark. The x-axis represents the accuracy achieved, the y-axis represents the runtime (in seconds per 1000 steps), and the size of the circles represents the GPU memory usage in gigabytes. The results show that GFSA improves the accuracy across models while maintaining relatively low runtime especially when implemented with Efficient Attention. Note the significant reduction in runtime for Efficient Attention + GFSA compared to the Transformer + GFSA.

This figure visualizes the effects of GFSA on DeiT-S (a small version of DeiT) for ImageNet-1k image classification. It uses three sub-figures to show: (a) Filter response: The frequency response of the self-attention mechanism in DeiT-S, with and without GFSA. This demonstrates how GFSA enriches the frequency information processed by the model, addressing the oversmoothing issue. (b) Cosine similarity: Shows the cosine similarity between token representations across different layers of the model. The lower the cosine similarity, the more distinct the representations, indicating that GFSA reduces oversmoothing. (c) Singular value: Shows the distribution of singular values, which represent the importance of different components in the representation. It shows that GFSA is able to capture more diverse feature information. The Appendices C and D contain additional visualizations and details.

This figure visualizes the effects of GFSA on DeiT-S, a small vision transformer model, trained on the ImageNet-1k dataset. It presents three sub-figures: (a) Filter response: Shows the frequency response of the self-attention mechanism in DeiT-S (blue) and DeiT-S with GFSA (orange). The difference highlights how GFSA enhances higher-frequency information compared to the original self-attention, which predominantly focuses on low frequencies (oversmoothing). (b) Cosine similarity: This illustrates the cosine similarity between the representations of different layers in the model. The graph indicates that GFSA reduces the increase of similarity between layers as the network deepens, thereby mitigating the oversmoothing problem. (c) Singular value: Presents the singular value distribution of the features in the last block. GFSA’s impact is shown by its more diverse singular values, implying that it prevents the collapse of feature representations which is often associated with oversmoothing. In essence, this analysis reveals that GFSA enriches the self-attention mechanism by preserving a wider range of frequencies and preventing representation collapse.

This figure visualizes the effects of GFSA on DeiT-S for ImageNet-1k image classification. It shows three subfigures: (a) demonstrates the frequency response of the filter, highlighting how GFSA enriches the self-attention mechanism by incorporating a wider range of frequencies; (b) illustrates the cosine similarity between representations across different layers, showcasing GFSA’s mitigation of over-smoothing; (c) presents the singular value distribution, further emphasizing the improved representation learning of GFSA. Appendices C and D contain further details and visualizations.

This figure visualizes the effects of GFSA on DeiT-S (a small vision transformer model) trained on the ImageNet-1k dataset. It consists of three sub-figures: (a) shows the frequency response of the filter, illustrating how GFSA modifies the frequency components; (b) displays the cosine similarity between representations across different layers, indicating that GFSA mitigates the oversmoothing problem; and (c) presents the singular value distribution, showing how GFSA preserves more distinct features. Appendices C and D provide further details and additional visualizations.
More on tables

This table presents the results of experiments comparing the performance of a standard GPT-2 model against a GPT-2 model enhanced with the Graph Filter-based Self-Attention (GFSA) mechanism. The comparison is made across three different datasets for causal language modeling: Penn Treebank (PTB), WikiText-2, and WikiText-103. The table shows the perplexity scores for each model on each dataset, along with the average perplexity across all three datasets. Lower perplexity indicates better performance.

This table presents the Top-1 accuracy results on the ImageNet-1k benchmark for various Vision Transformer (ViT) backbones, including DeiT, CaiT, and Swin. It compares the performance of these base models against versions modified with different enhancement techniques: AttnScale, FeatScale, ContraNorm, and the authors’ proposed GFSA. The table shows the impact of these techniques on accuracy for both 12-layer and 24-layer versions of some models, indicating how GFSA contributes to improved performance compared to the existing state-of-the-art methods.

This table presents the Mean Absolute Error (MAE) achieved by the Graphormer model and the Graphormer model enhanced with GFSA (Graph Filter-based Self-Attention) on the ZINC dataset. Lower MAE values indicate better performance. The results demonstrate that incorporating GFSA improves the model’s accuracy in predicting molecular properties.

This table presents the results of experiments comparing the performance of GPS and Graph-ViT models with and without the GFSA method on several graph-level datasets. It shows the average precision (AP), mean absolute error (MAE), and area under the ROC curve (ROCAUC) for each dataset. The use of GFSA leads to improved performance across multiple metrics on most datasets. Note that the results for Graph-ViT on MNIST and CIFAR10 are denoted with a † to indicate that the authors conducted their own experiments due to a lack of available data for the standard Hadamard self-attention method in the referenced work.

This table presents the Word Error Rate (WER) results for Automatic Speech Recognition (ASR) experiments conducted on the LibriSpeech dataset (both 100-hour and 960-hour subsets). The WER is broken down for test-clean and test-other subsets for each model. The models compared are a vanilla Transformer, a Transformer with the proposed GFSA (Graph Filter-based Self-Attention), a Branchformer model, and a Branchformer model also incorporating GFSA. The table shows the impact of GFSA on the WER, indicating its effectiveness in improving ASR performance.

This table presents the results of code classification experiments using different transformer models with and without the proposed GFSA. It shows the accuracy achieved by each model, highlighting the improvement gained by integrating GFSA. The improvement is presented as a percentage increase in accuracy. The models compared include ROBERTa, CodeBERT, PLBART, and two versions of CodeT5 (small and base).

This table compares the performance of different models on the GLUE benchmark, a collection of tasks designed to evaluate the performance of natural language understanding systems. The models include the base BERT, ALBERT, and RoBERTa models, as well as versions of these models that incorporate the proposed GFSA (Graph Filter-based Self-Attention) mechanism and the ContraNorm method. The table shows the performance of each model on several individual GLUE tasks, such as CoLA, SST-2, MRPC, and others, as well as an average performance across all the tasks. This allows for a comparison of the effectiveness of GFSA in improving performance compared to the base models and a competing technique.

This table compares the performance of different models on the GLUE benchmark, a standard dataset for evaluating natural language understanding systems. It shows the results for several models (BERT, ALBERT, and RoBERTa) both with and without the proposed GFSA method (Graph Filter-based Self-Attention). The table presents scores for various GLUE subtasks and an average score across all tasks. The ‘#Params’ column shows the number of parameters in each model. It highlights the performance improvement achieved by integrating GFSA.

This table presents the results of a sensitivity analysis on the hyperparameter K (polynomial order) used in the GFSA method. The analysis was performed using BERTBASE models fine-tuned on various GLUE tasks. The table shows the performance (measured by metrics specific to each task) for different values of K, ranging from 2 to 10, to evaluate the robustness of the GFSA’s performance with regard to changes in K. The goal is to determine the optimal K value for each GLUE task.

This table shows the perplexity results on three datasets (PTB, WikiText-2, WikiText-103) for different values of the hyperparameter K in GFSA. It demonstrates the impact of varying the polynomial order in the proposed GFSA on the performance of causal language modeling.

This table presents the Top-1 accuracy results on the ImageNet-1k benchmark for various Vision Transformer (ViT) backbones (DeiT-S, CaiT-S, Swin-S) with and without the proposed Graph Filter-based Self-Attention (GFSA) mechanism. It compares the performance of different ViT models with varying depths (12 and 24 layers), highlighting the improvement achieved by incorporating GFSA. The table also includes a comparison with other state-of-the-art methods (AttnScale, FeatScale, and ContraNorm) for context.

This table presents the sensitivity analysis of the 12-layer DeiT-S model with GFSA to different values of the hyperparameter K, which controls the order of the matrix polynomial in the GFSA filter. The table shows the Top-1 accuracy on the ImageNet-1k dataset for each value of K (2, 3, 4, and 5). It demonstrates how the model’s performance varies with different choices of K, indicating the optimal value or the range of values that yield the best performance.

This table presents the sensitivity analysis results for the 24-layer CaiT-S model with GFSA applied. It shows the Top-1 accuracy achieved for different values of the hyperparameter K (polynomial order in GFSA). The results demonstrate how the model’s performance varies with different values of K, indicating the optimal K for achieving the best accuracy.
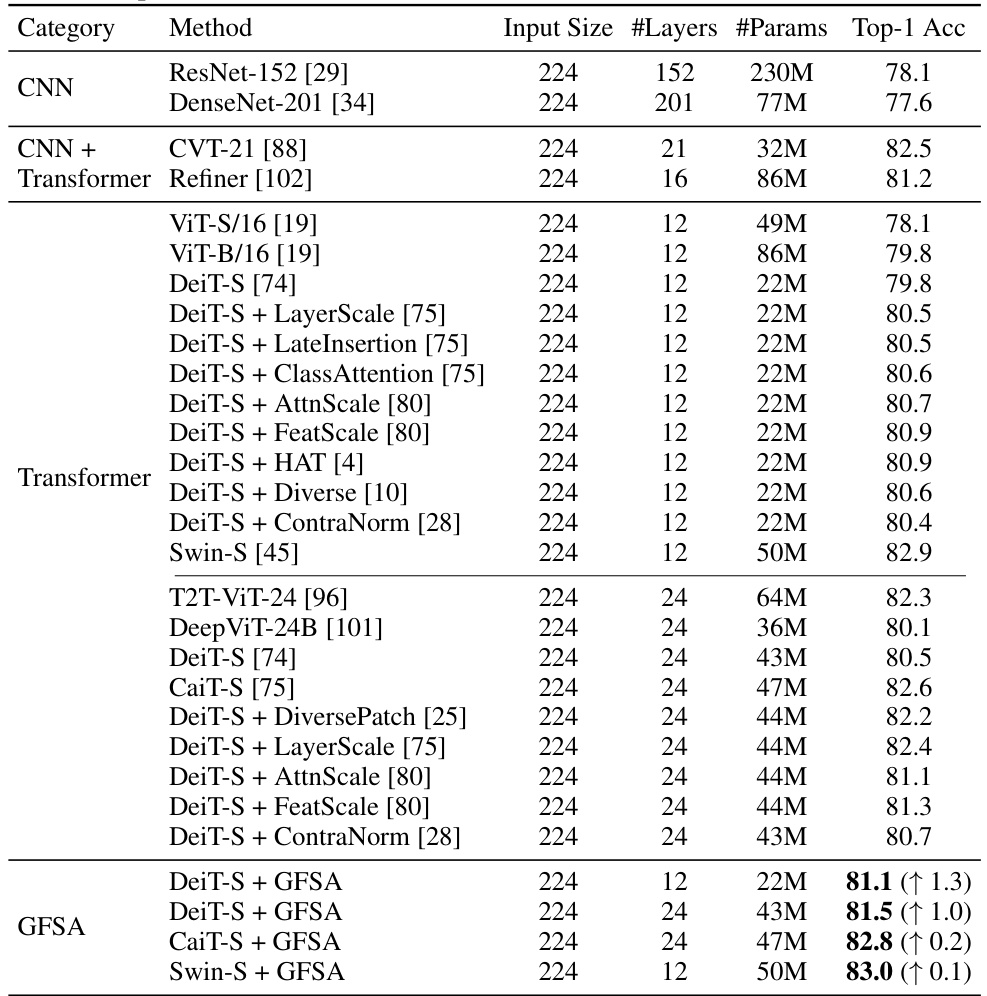
This table compares the Top-1 accuracy of various Vision Transformer models on the ImageNet-1k dataset. The models include several base ViT architectures (DeiT-S, CaiT-S, Swin-S) with different numbers of layers, and various modifications applied to improve performance, such as AttnScale, FeatScale, ContraNorm. The table also shows the results obtained by integrating the proposed Graph Filter-based Self-Attention (GFSA) into these models and highlights the performance gains achieved using GFSA.

This table compares the performance of DeiT-S with GFSA against other state-of-the-art models on the ImageNet-1k dataset. It shows the input size, number of layers, number of parameters, Top-1 accuracy, and Top-5 accuracy for each model. The results demonstrate that DeiT-S with GFSA achieves a higher Top-1 accuracy than other comparable models, highlighting the effectiveness of the proposed method.

This table compares the performance of DeiT-T and DeiT-S models with and without ContraNorm and GFSA on the ImageNet-1k dataset. The results are broken down by the number of layers (12, 16, and 24) in the model architecture. It demonstrates how GFSA improves the top-1 accuracy of both DeiT-T and DeiT-S models across different model depths.
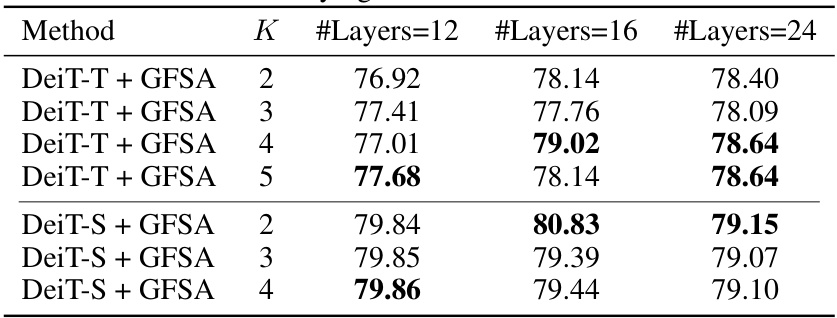
This table presents the sensitivity analysis of the performance of DeiT-S with GFSA on ImageNet-1K when varying the hyperparameter K (polynomial order) from 2 to 5. It shows the Top-1 accuracy for each value of K, allowing for a direct comparison of the model’s performance with different high-order terms.
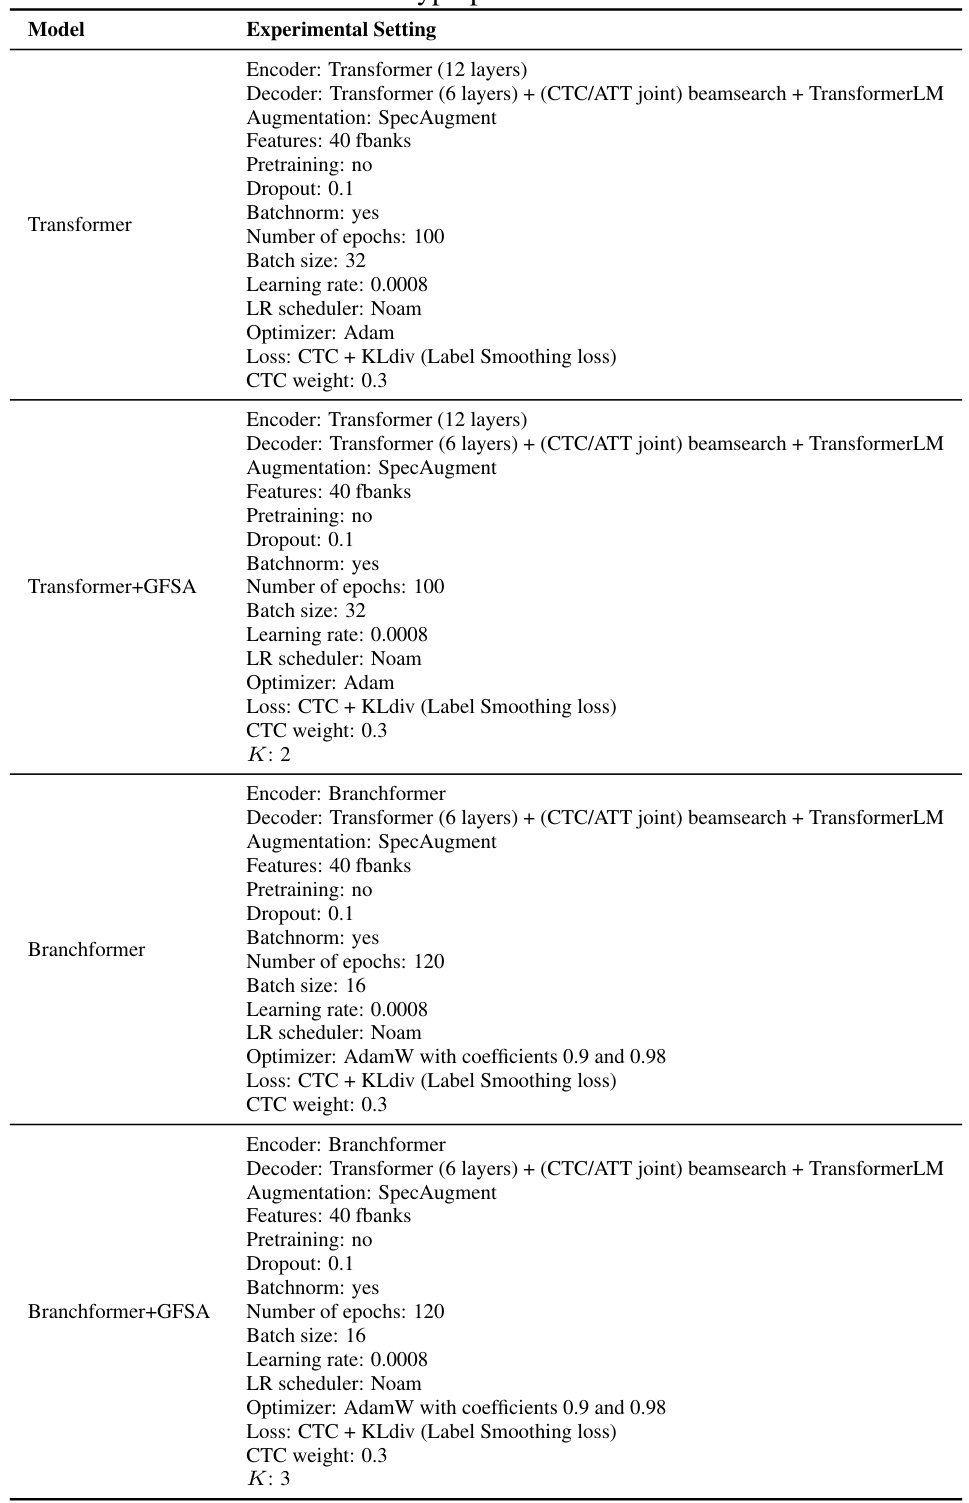
This table presents the results of experiments conducted on the GLUE benchmark, a widely used standard dataset for evaluating natural language understanding models. The table compares the performance of several models: BERT, ALBERT, and RoBERTa, both with and without the proposed GFSA modification. Each model is evaluated on multiple sub-tasks within the GLUE benchmark and the average score across those tasks is provided. The table also includes the number of parameters for each model, showcasing the minimal parameter overhead of GFSA. The performance improvements shown highlight GFSA’s effectiveness in enhancing natural language understanding.

This table presents the Mean Absolute Error (MAE) achieved by Graphormer and Graphormer enhanced with GFSA (Graph Filter-based Self-Attention) on the ZINC dataset. The results show that adding GFSA improves the MAE, indicating better performance in the task of predicting molecular properties.

This table presents the results of the PCQM4M and PCQM4Mv2 experiments. It compares the Mean Absolute Error (MAE) achieved by Graphormer and Graphormer enhanced with GFSA (Graph Filter-based Self-Attention). Results are shown for both training and validation sets, indicating the performance of each model on seen and unseen data. The number of parameters (#Params) for each model is also provided.

This table compares the performance of different models on the GLUE benchmark. The models include BERT, ALBERT, and RoBERTa, both with and without the proposed GFSA method, and also includes ContraNorm as a comparison. The table shows the performance on each individual task within the GLUE benchmark (CoLA, SST-2, MRPC, QQP, STS-B, MNLI-m, MNLI-mm, QNLI, RTE) as well as the average performance across all tasks. The number of parameters for each model is also shown.

This table shows the training time in seconds per epoch for each of the GLUE tasks for various language models, both with and without the GFSA enhancement. It provides a comparison of the computational overhead introduced by GFSA and shows that the increase is relatively small, even for larger models.

This table shows the training time in seconds per epoch for three different causal language modeling datasets (PTB, WikiText-2, and WikiText-103) for both the original GPT2 model and the GPT2 model with the GFSA (Graph Filter-based Self-Attention) layer added. The results demonstrate that adding the GFSA layer increases the training time but provides improved performance, as shown in Table 2 in the main text of the paper.

This table compares the Top-1 accuracy of various Vision Transformer models on the ImageNet-1k dataset. It shows the performance of DeiT, CaiT, and Swin Transformer models, both with and without the addition of GFSA (Graph Filter-based Self-Attention). The table also includes input size, number of layers and number of parameters for each model, providing a comprehensive comparison of the models’ performance and efficiency.

This table shows the training time in seconds per epoch for three graph-level tasks (ZINC, PCQM4M, and PCQM4Mv2) using two methods: Graphormer and Graphormer with the proposed GFSA. It highlights the additional computational cost introduced by GFSA, while also showing that the increase is relatively small.

This table presents the Word Error Rate (WER) results for Automatic Speech Recognition (ASR) experiments conducted on the LibriSpeech dataset. Two different Transformer-based models, a vanilla Transformer and Branchformer [59], were used as baselines. The WER is reported for both the 100-hour and 960-hour subsets of the LibriSpeech dataset, for both clean and ‘other’ test sets. The table also shows the WER results when GFSA is integrated into both base models. The results demonstrate the improvement achieved by incorporating GFSA.
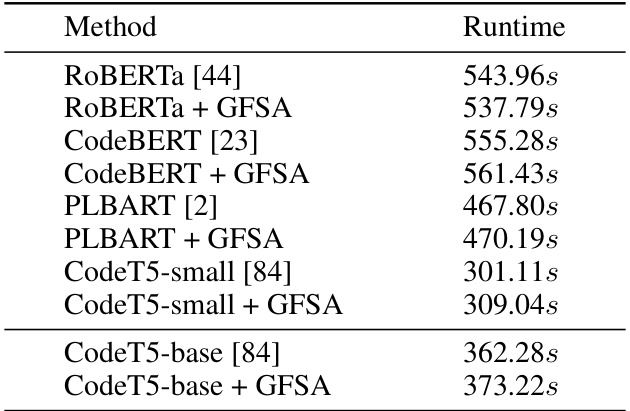
This table shows the training time for various code classification models, both with and without GFSA. It demonstrates that while GFSA slightly increases the training time, the increase is relatively small, especially considering the performance improvements it provides.

This table compares the performance of different models on the GLUE benchmark, a widely used dataset for evaluating natural language understanding. It shows the results for several models, including the baseline models (BERT, ALBERT, RoBERTa) and those same models enhanced with the proposed GFSA method. The metrics used to measure performance vary across the different GLUE tasks. The table also shows the number of parameters for each model, providing context on the model size and complexity. The ‘Avg’ column represents the average score across all GLUE tasks. The comparison helps demonstrate the improvement in performance achieved by incorporating GFSA into the models.

This table compares the perplexity scores achieved by the original GPT2 model and the GPT2 model enhanced with GFSA across three datasets: Penn Treebank (PTB), WikiText-2, and WikiText-103. The results show the impact of applying GFSA on the causal language modeling performance. Different values of K (the hyperparameter for GFSA) were tested to evaluate sensitivity.
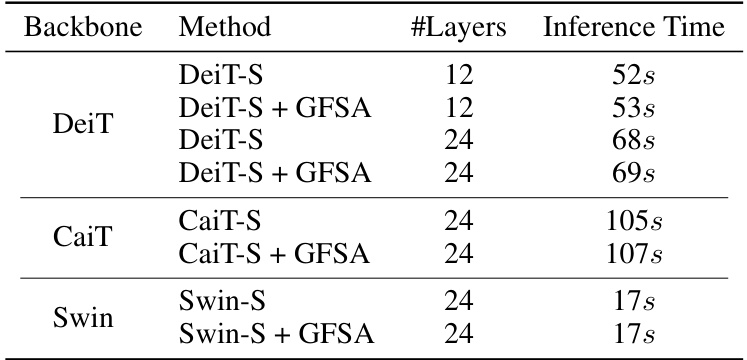
This table shows the inference time in seconds for various Vision Transformer backbones (DeiT, CaiT, Swin) with and without GFSA. It demonstrates the minimal increase in inference time caused by adding GFSA, highlighting its efficiency.

This table shows the inference time of Graphormer and Graphormer with GFSA on three graph-level datasets: ZINC, PCQM4M, and PCQM4Mv2. The inference time is measured in seconds. The results show that adding GFSA to Graphormer increases the inference time, although the increase is relatively small (less than 20 seconds for all datasets).

This table compares the Word Error Rate (WER) achieved by different models on two subsets of the LibriSpeech dataset: 100 hours and 960 hours. The models compared are a vanilla Transformer, a Transformer enhanced with Graph Filter-based Self-Attention (GFSA), a Branchformer, and a Branchformer enhanced with GFSA. WER is reported for both clean and other test sets. This table demonstrates the effectiveness of GFSA in improving ASR performance on both large and small models.
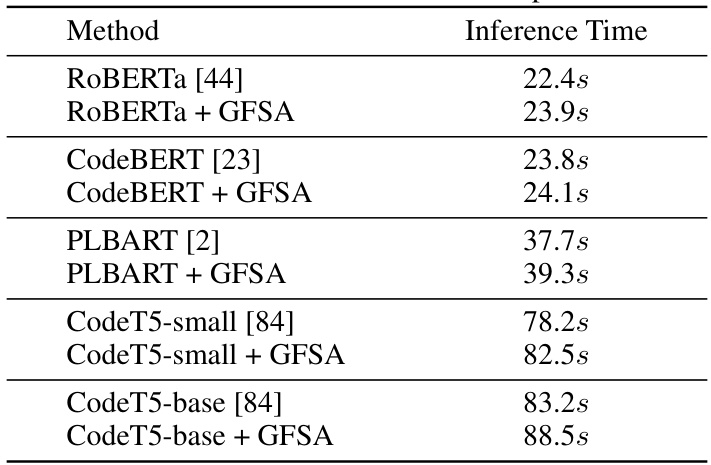
This table presents the inference time, in seconds, for various code classification models with and without the proposed GFSA (Graph Filter-based Self-Attention) method. It shows the inference time for ROBERTA, CodeBERT, PLBART, and CodeT5 (small and base versions) to highlight the impact of GFSA on inference speed in a code defect detection task. The results demonstrate that while adding GFSA increases inference time slightly, the gains in accuracy outweigh the increased computational cost in most cases.

This table compares the performance of different models on the GLUE benchmark. The models tested include BERT, ALBERT, and RoBERTa, both with and without the GFSA modification. The table shows the performance on various subtasks of the GLUE benchmark, including CoLA, SST-2, MRPC, QQP, STS-B, MNLI-m/mm, QNLI, and RTE. The ‘Avg’ column represents the average performance across all subtasks. The comparison highlights the improvement in performance achieved by incorporating GFSA into the base Transformer models.

This table compares the performance of different models on the GLUE benchmark. The models include the baseline BERT, ALBERT, and RoBERTa, as well as versions of these models with ContraNorm and GFSA applied. The table shows the performance on several different tasks within the GLUE benchmark (CoLA, SST-2, MRPC, QQP, STS-B, MNLI-m/mm, QNLI, RTE), as well as the average performance across all tasks. The number of parameters (#Params) for each model is also listed. GFSA shows significant performance improvements across the board, often exceeding that of ContraNorm.

This table compares the performance of three different models on three different datasets related to causal language modeling. The first model is GPT2, a pre-trained large language model. The second model is GPT2 with the addition of Graph Filter-based Self-Attention (GFSA). The third model is GPT2 with GFSA applied only to even-numbered layers (GFSA_even). The datasets used are Penn Treebank (PTB), WikiText-2, and WikiText-103. The table shows the perplexity score for each model on each dataset, as well as the average perplexity across all three datasets. Perplexity is a measure of how well a language model predicts a sequence of words.

This table compares the perplexity scores achieved by the original GPT-2 model and GPT-2 models enhanced with GFSA across three different datasets: Penn Treebank (PTB), WikiText-2, and WikiText-103. The table shows the perplexity for each model and dataset, along with the average perplexity across the three datasets. The results demonstrate the improved performance of GPT-2 with GFSA on these causal language modeling tasks.

This table presents the comparison of Top-1 accuracy on ImageNet-1k using different Vision Transformers such as DeiT, CaiT, and Swin with and without GFSA. It shows the impact of GFSA on various model depths (#Layers) and sizes (#Params) by comparing their Top-1 accuracy and runtime.

This table presents a comparison of the performance of various transformer models on the Long Range Arena benchmark. The benchmark includes two datasets: ListOps (with 2K samples) and Image (with 4K samples). The table shows the accuracy, runtime (seconds per 1000 steps), and GPU usage (in GB) for each model. The models compared include the standard Transformer, the Transformer with the proposed GFSA, Linformer, YOSO-E, Efficient Attention, and Efficient Attention with GFSA. The results demonstrate the impact of GFSA on both accuracy and resource usage. Specifically, the GFSA generally increases accuracy, but with increased runtime and GPU usage, although the improvements are not uniform across models and datasets.
Full paper#


