↗ OpenReview ↗ NeurIPS Homepage ↗ Chat
TL;DR#
Missing data imputation (MDI) is critical in various fields, but existing diffusion model-based methods have limitations. Directly using diffusion models for MDI yields suboptimal performance because the models’ inherent sample diversity hinders accurate inference of missing values, and the data masking employed in training may obstruct accurate imputation. This paper introduces these issues.
To address these shortcomings, the authors propose “Negative Entropy-regularized Wasserstein gradient flow for Imputation” (NewImp). NewImp enhances diffusion models’ MDI performance from a gradient flow perspective. It incorporates negative entropy regularization to suppress diversity and improve accuracy. Importantly, NewImp’s imputation procedure, derived from conditional distribution-related cost functionals, is equivalent to using joint distribution, eliminating the need for data masking. Extensive experiments validate NewImp’s superior performance compared to existing methods.
Key Takeaways#
Why does it matter?#
This paper is crucial because it addresses the limitations of diffusion models in missing data imputation, a prevalent problem across many fields. It offers a novel approach, NewImp, that significantly improves accuracy and efficiency, opening new avenues for research in data imputation and generative modeling. Researchers working on missing data, generative AI, and gradient flow methods will find this work highly relevant.
Visual Insights#

This figure compares the optimal value of a cost function related to a three-dimensional Dirichlet distribution with the results obtained by diffusion models. The optimal value is represented by a green triangle. The results from diffusion models are scattered in white. The discrepancy highlights that diffusion models implicitly promote diversity during imputation, which is counterproductive for precise imputation of missing data. Details are provided in Appendix B.

This table presents the imputation quality results achieved by NewImp and other state-of-the-art imputation methods across eight benchmark datasets from the UCI repository. The evaluation metrics used are MAE (Mean Absolute Error) and WASS (Wasserstein-2 distance), both adapted to account for only the missing values. Results are reported for both Missing at Random (MAR) and Missing Completely at Random (MCAR) scenarios, reflecting a 30% missing data rate. The best performance for each metric and scenario is highlighted in bold, indicating superior imputation accuracy by NewImp across multiple datasets and missing data scenarios.
In-depth insights#
Diffusion Models & MDI#
Diffusion models have shown promise in missing data imputation (MDI), but their direct application faces challenges. The inherent diversity encouraged by diffusion models can hinder accurate imputation of missing values. Data masking, a common technique in diffusion models for MDI, creates a discrepancy between training and inference data. The paper addresses these issues by proposing a novel method that uses a negative entropy regularization term to reduce the diversity in generated samples and leverages a Wasserstein Gradient Flow framework to obviate the need for data masking, thereby improving imputation performance. A key contribution is the theoretical demonstration that imputation using the conditional distribution can be equivalently achieved by using the joint distribution, directly addressing the aforementioned challenges. The proposed method, NewImp, demonstrates improved results on various benchmark datasets, underscoring the effectiveness of the proposed solution in MDI.
NewImp: A WGF#
The heading “NewImp: A WGF” suggests a novel missing data imputation method called NewImp, framed within the Wasserstein Gradient Flow (WGF) framework. This implies NewImp leverages the mathematical properties of WGF to optimize a cost function related to the imputation task. Instead of directly applying diffusion models, which often lead to suboptimal results due to excessive sample diversity, NewImp likely incorporates regularization techniques, possibly negative entropy regularization, within the WGF framework to improve imputation accuracy. The use of WGF suggests a continuous, iterative optimization process, potentially making NewImp robust and efficient. Furthermore, the use of the WGF framework is likely linked to addressing the challenge of data masking used in training diffusion models, potentially enabling a way to eliminate this step entirely. NewImp’s design thus seems to address fundamental limitations of diffusion models in missing data imputation. The name “NewImp” itself implies a focus on novel, improved results compared to existing methods.
NER & Joint Modeling#
The combination of Negative Entropy Regularization (NER) and joint modeling is a key innovation. NER directly addresses the issue of sample diversity inherent in diffusion models, which can hinder accurate imputation by encouraging the generation of diverse, potentially inaccurate, imputed values. By incorporating NER, the model is encouraged to produce more focused and concentrated imputations. The shift to joint distribution modeling is equally crucial. It elegantly eliminates the need for data masking, a common practice in diffusion-based imputation that can lead to performance degradation. Data masking introduces a discrepancy between training and testing data distributions, potentially harming generalization. Joint modeling avoids this issue by directly learning the joint distribution of observed and missing data, enabling more accurate imputation without the need for artificially masking values.
NewImp Implementation#
The implementation of NewImp is a crucial aspect of the research, focusing on optimizing the negative entropy-regularized Wasserstein gradient flow within the framework. A key innovation is sidestepping the data masking process traditionally used in diffusion models. This is achieved by replacing the conditional distribution with the joint distribution during the imputation procedure, simplifying the process and potentially enhancing accuracy. The implementation details include utilizing the reproducing kernel Hilbert space (RKHS) to handle the intractable density function, employing the forward Euler’s method for ODE simulation, and using Denoising Score Matching (DSM) to estimate the score function of the joint distribution. This approach not only improves efficiency but also tackles the issue of unintended diversity inherent in diffusion models by incorporating a negative entropy regularization term, which ultimately enhances the accuracy of the imputation. The theoretical underpinnings and the computational considerations of the chosen techniques are also discussed, highlighting the trade-offs and the rationale behind these choices. The researchers have shown an in-depth explanation of the implementation of NewImp, and the experimental results confirm its effectiveness. In addition, they provide a codebase which makes reproducibility of the results straightforward.
Limitations & Future#
The section on limitations and future directions should critically examine the study’s shortcomings and propose avenues for improvement. Key limitations might include the reliance on specific kernel functions, potential computational bottlenecks in high-dimensional settings, and assumptions about data distributions. Future research could explore alternative regularization techniques, optimize the training process for increased efficiency, and extend the methodology to handle diverse data types, such as categorical variables. Addressing the limitations would enhance the generalizability and practical applicability of the proposed method, leading to more robust and accurate missing data imputation in diverse applications. Furthermore, the paper could discuss the broader impacts, considering ethical implications and potential societal consequences. Future work could focus on empirical evaluations under real-world conditions, addressing scenarios with complex missing data patterns and heterogeneous data types.
More visual insights#
More on figures

This figure shows the sensitivity analysis of the NewImp model’s performance with respect to four key hyperparameters: bandwidth (h) for the RBF kernel, number of hidden units (HUscore) in the score network, negative entropy regularization weight (λ), and discretization step size (η) for the ODE simulation. The results, shown for three scenarios (MAR, MCAR, and MNAR with 30% missing data) on the CC dataset, indicate how each hyperparameter affects both Mean Absolute Error (MAE) and Wasserstein-2 distance (WASS) metrics. The scatters represent the mean values, and shaded areas represent one standard deviation from the mean.

This figure compares the results of a hypothetical optimization problem solved analytically with the results obtained using diffusion models. The goal was to maximize a cost function related to a 3D Dirichlet distribution. The figure shows that the diffusion models’ results are close to but not exactly at the optimal value. This suggests that the diffusion models might have implicit terms that encourage diversity in the results, hindering precise imputation for the Missing Data Imputation task.

This figure shows the sensitivity analysis of the NewImp model with respect to four hyperparameters: bandwidth (h), hidden units (HUscore), NER weight (λ), and discretization step (η). For each hyperparameter, the mean MAE and WASS values, along with their standard deviations, are plotted for MAR, MCAR, and MNAR scenarios on CC dataset. The results demonstrate the impact of each hyperparameter on the model’s performance.

This figure shows the sensitivity analysis of the NewImp model’s performance with respect to four key hyperparameters: bandwidth (h), hidden units (HUscore), NER weight (λ), and discretization step (η). Each subplot shows how changes in a single hyperparameter affect both MAE and WASS metrics. The shaded area represents the standard deviation from the mean, providing an understanding of the variability in performance.

This figure shows the sensitivity analysis of the NewImp model’s performance with respect to four hyperparameters: bandwidth (h) for the RBF kernel, number of hidden units (HUscore) in the score network, negative entropy regularization strength (λ), and discretization step size (η). Each subplot displays the MAE and WASS metrics for MAR, MCAR, and MNAR missing data scenarios on the CC dataset. The plots show that the model is relatively robust to changes in HUscore and η, while the performance is sensitive to the choice of bandwidth (h) and NER weight (λ).

This figure shows the average computation time of the proposed NewImp approach. The computation time is divided into two parts: ‘Estimate’ which represents the time for DSM training (step 5), and ‘Impute’ which represents the time for imputation (step 7). The x-axis represents the logarithm of the number of samples (N) and the y-axis represents the computation time. The figure shows that the computation time increases as the number of samples increases. The figure also shows that the standard deviation of the computation time increases as the number of samples increases.

This figure shows the average computation time of the DSM training algorithm (Estimate) and the imputation algorithm (Impute) for different dataset sizes (N) and numbers of features (D), across different missing data mechanisms (MAR, MCAR, MNAR). The shaded regions represent the standard deviation. It demonstrates the impact of data size and dimensionality on the algorithm’s runtime.

This figure shows the sensitivity analysis of the NewImp model’s performance with respect to four key hyperparameters: bandwidth (h), number of hidden units (HUscore), regularization strength (λ), and discretization step size (η). Each subplot displays the impact of varying one hyperparameter while keeping the others constant, showing mean MAE and WASS values across different parameter settings. The results indicate optimal ranges for these hyperparameters, highlighting the trade-off between accuracy and computational efficiency.

This figure shows the sensitivity analysis of the NewImp model’s performance to four key hyperparameters: bandwidth (h) for the RBF kernel, the number of hidden units (HUscore) in the score network, the negative entropy regularization weight (λ), and the discretization step size (η) for the ODE simulation. Each subplot represents a different hyperparameter, with the x-axis showing the hyperparameter value and the y-axis displaying the MAE and WASS metrics. The mean performance and standard deviation are shown as scatters and shaded areas, respectively. The results demonstrate how different hyperparameter settings influence model performance and provide guidance for optimal parameter selection.
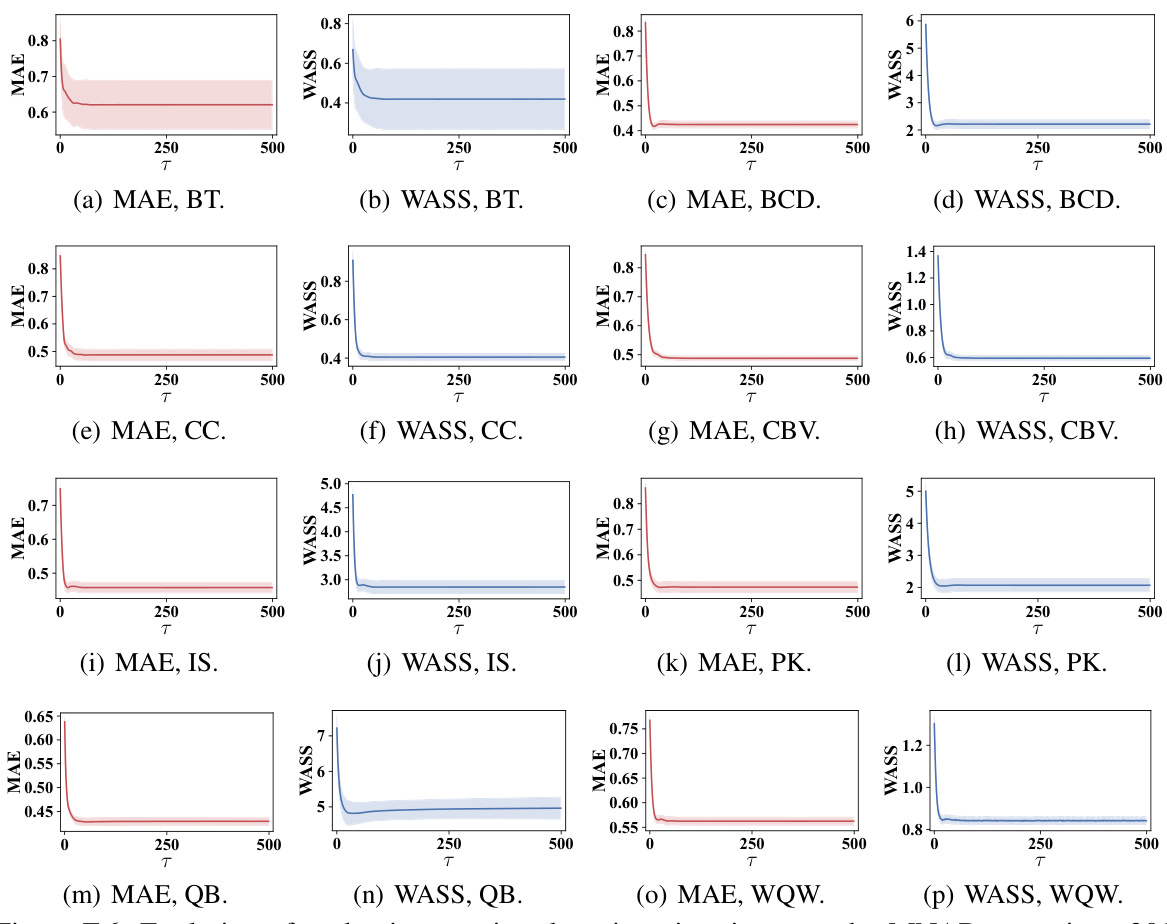
This figure analyzes the sensitivity of the NewImp model’s performance to variations in four key hyperparameters: bandwidth (h) of the RBF kernel, number of hidden units (HUscore) in the score network, negative entropy regularization weight (λ), and discretization step size (η) used in the ordinary differential equation simulation. For each hyperparameter, a range of values were tested, and the mean and standard deviation of the MAE and WASS metrics were calculated and plotted. This figure shows how these hyperparameters influence model accuracy. The results demonstrate the importance of selecting appropriate hyperparameter values to balance model complexity and generalization.

This figure analyzes the impact of four key hyperparameters in the NewImp approach on the model’s performance in handling missing data. The hyperparameters tested are the bandwidth of the RBF kernel, the number of hidden units in the score network, the weight of the negative entropy regularization term, and the discretization step size for simulating the ordinary differential equation. For each hyperparameter, the figure shows how changes in its value affect imputation accuracy, as measured by the mean absolute error (MAE) and the squared Wasserstein-2 distance (WASS). The results demonstrate the impact of the chosen parameters and provide guidance for optimal hyperparameter tuning.
More on tables

This table presents the imputation accuracy results of several different missing data imputation methods. The performance is measured using two metrics: Mean Absolute Error (MAE) and Wasserstein-2 distance (WASS). The results are shown for various datasets under two different missing data mechanisms (MAR and MCAR), with a missing rate of 30%. The table allows for a comparison of the performance of various methods on different datasets and missingness scenarios.

This table shows the MAE and WASS scores for various missing data imputation methods across eight datasets. The results are broken down by missing data mechanism (MAR and MCAR) and the best performing method is highlighted. This table demonstrates the performance of NewImp in comparison to other methods.
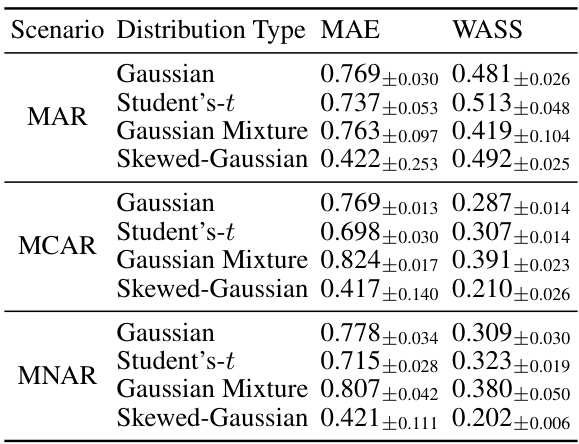
This table presents the performance of the NewImp model on four different synthetic datasets with varying distributions (Standard Gaussian, Student’s t, Gaussian Mixture, and Skewed Gaussian) and missing mechanisms (MAR, MCAR, and MNAR). The results show the MAE and WASS metrics for each combination of dataset and missing mechanism, providing insight into NewImp’s robustness across different data characteristics and missingness patterns. The mean and standard deviation are included for each metric.
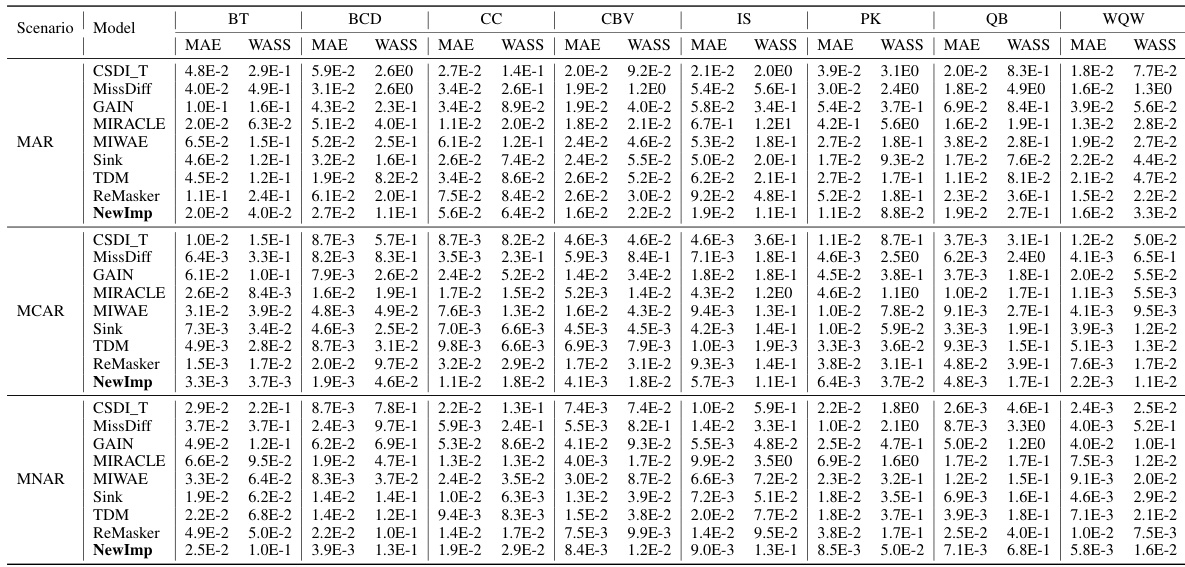
This table presents the imputation quality of NewImp and other imputation approaches under the MAR and MCAR scenarios. The MAE and WASS metrics are used to evaluate the performance of each method on eight real-world datasets. The results show the mean and standard deviation of the metrics over multiple runs. The table allows for a comparison of NewImp’s performance against other state-of-the-art methods.
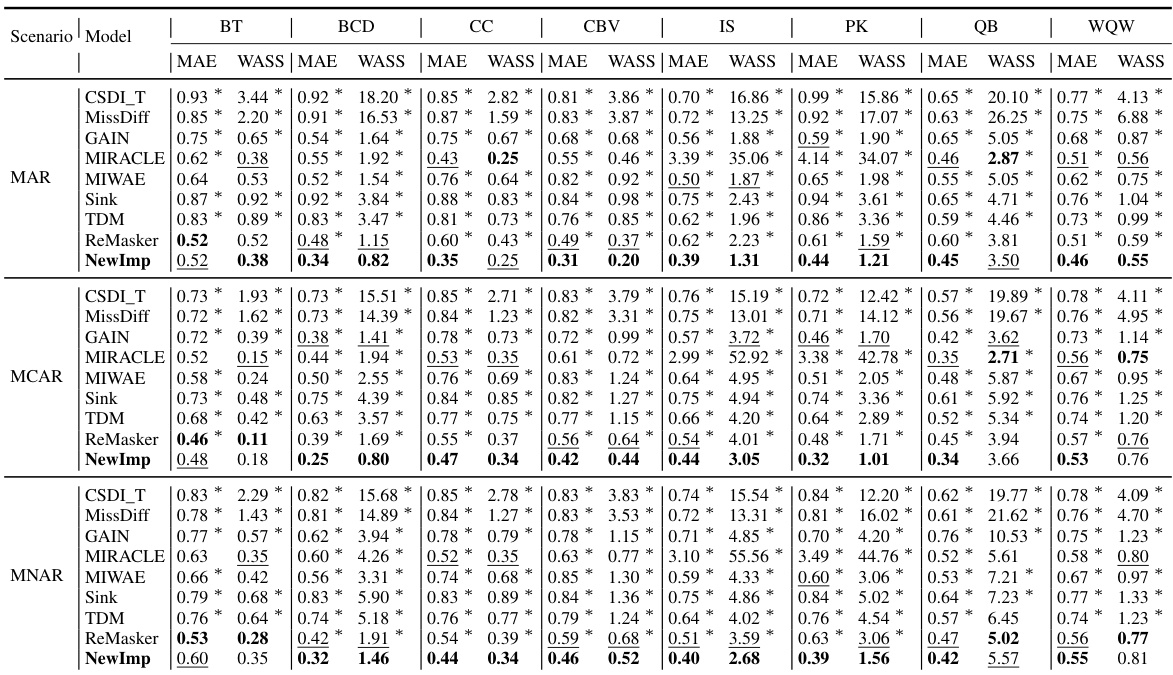
This table presents the imputation quality results using MAE and WASS metrics on eight real-world datasets with a 30% missing rate. It compares the performance of the proposed NewImp method against several baseline models (CSDI_T, MissDiff, GAIN, MIRACLE, MIWAE, Sink, TDM, ReMasker) under two missing mechanisms: Missing At Random (MAR) and Missing Completely At Random (MCAR). The best performing model for each metric and dataset is bolded, and the second-best is underlined. An asterisk (*) indicates statistically significant outperformance (p<0.05) by NewImp, as determined via a paired samples t-test.
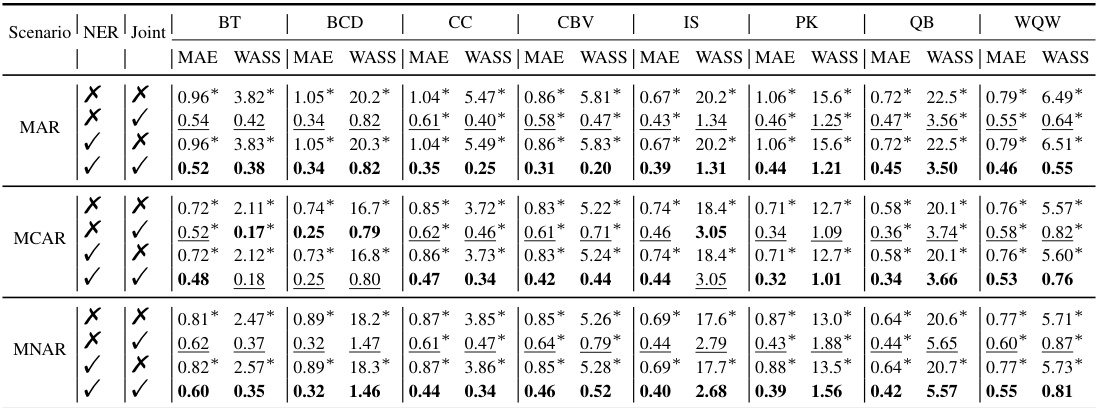
This table presents the imputation quality (measured by MAE and WASS metrics) of various imputation methods under the MNAR scenario, with a missing rate of 30%. It compares the performance of NewImp against several baseline methods across eight real-world datasets. The results highlight the effectiveness of NewImp, particularly in scenarios with complex missing data mechanisms.

This table presents the imputation quality in terms of MAE and WASS for eight datasets, under the Missing at Random (MAR) and Missing Completely at Random (MCAR) mechanisms, with a 30% missing data rate. The results are compared across several state-of-the-art imputation methods (CSDI_T, MissDiff, GAIN, MIRACLE, MIWAE, Sink, TDM, ReMasker) and the proposed NewImp method. The best-performing method for each metric and scenario is highlighted in bold.
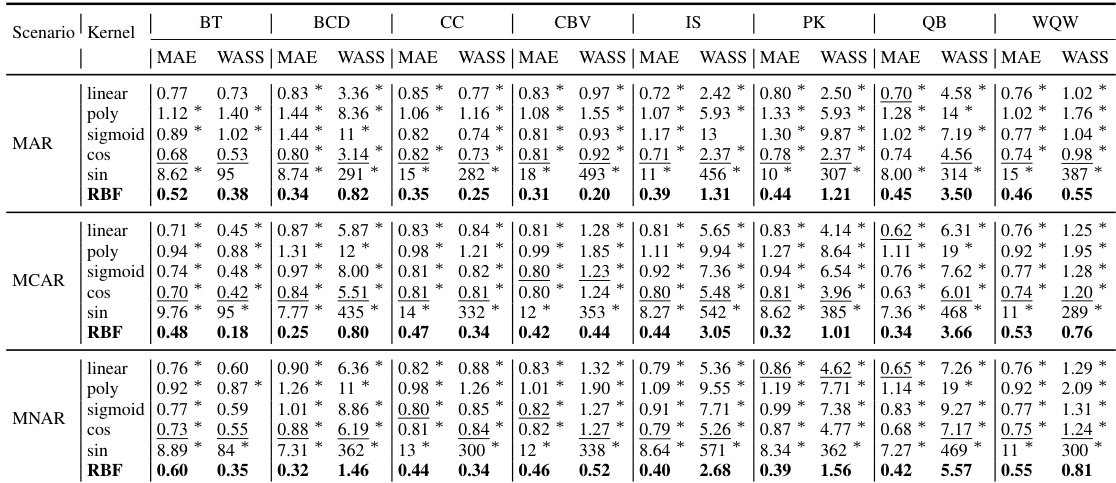
This table presents the imputation quality of the proposed NewImp method and other state-of-the-art imputation methods across eight real-world datasets. The results are broken down by the type of missing data mechanism (MAR and MCAR) and the evaluation metrics used (MAE and WASS). The best performance for each dataset and metric is highlighted in bold. The table allows for a comprehensive comparison of NewImp against existing methods in terms of accuracy and robustness across different data characteristics.
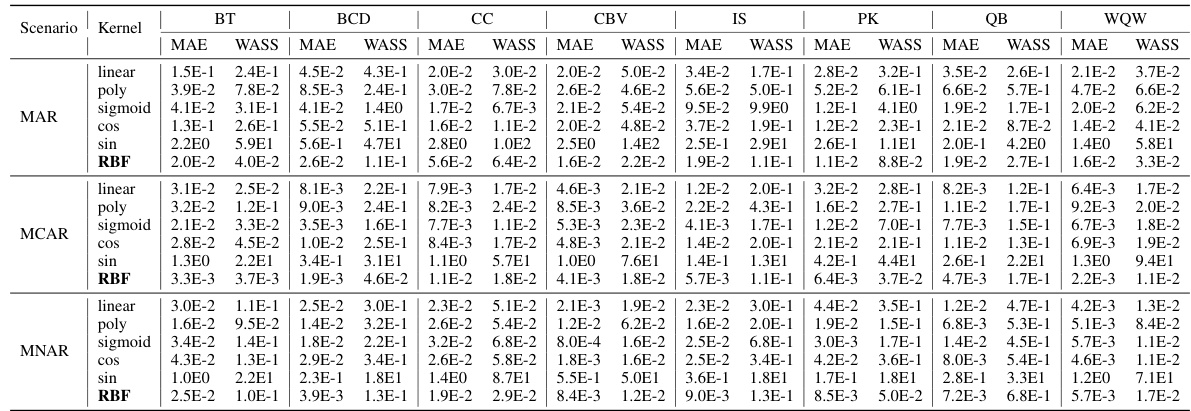
This table presents the imputation quality (MAE and WASS) of various models on eight real-world datasets, with a 30% missing rate. It compares the performance of NewImp against several baselines, categorized by MAR (Missing at Random) and MCAR (Missing Completely at Random) missing mechanisms. The best results for each metric are bolded, highlighting NewImp’s performance relative to other methods.

This table presents the imputation quality results of the proposed NewImp model and other state-of-the-art imputation methods across eight real-world datasets under the Missing At Random (MAR) and Missing Completely At Random (MCAR) scenarios. The MAE (Mean Absolute Error) and WASS (Wasserstein-2 distance) metrics are used to evaluate imputation performance, with lower values indicating better performance. The table allows for a comparison of NewImp’s effectiveness against various baselines under different missing data mechanisms and datasets.
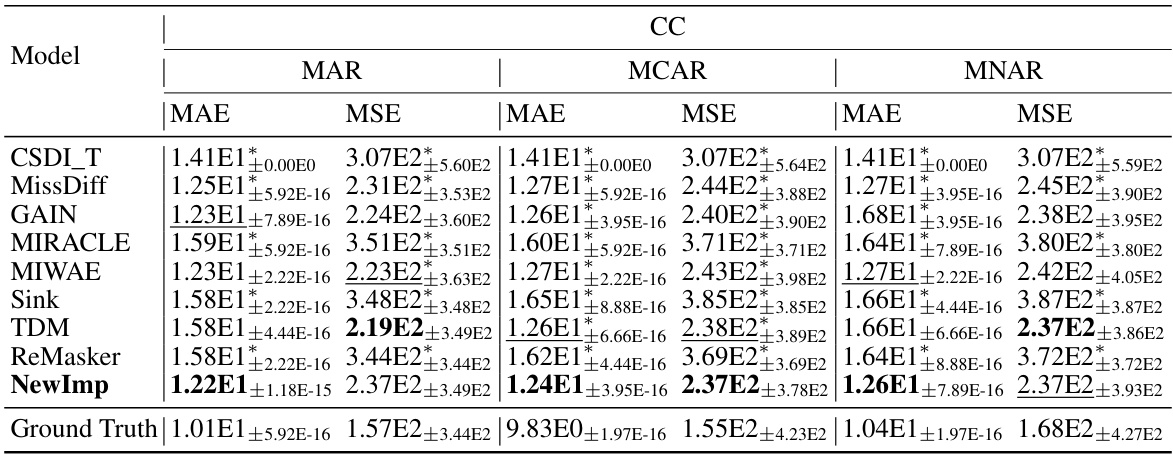
This table presents the MAE and WASS (Mean Absolute Error and Wasserstein-2 distance) results for various missing data imputation methods across eight real-world datasets. The results are broken down by missing data mechanism (MAR, MCAR), indicating the performance of each model under different missing data scenarios. The ‘*’ symbol highlights statistically significant improvements by NewImp compared to the baseline models.

This table presents the imputation quality results of NewImp and other imputation approaches under the MAR and MCAR scenarios with a 30% missing rate. The MAE (Mean Absolute Error) and WASS (Wasserstein-2 distance) metrics are used to evaluate the performance of each method across multiple datasets. The best results are highlighted in bold. The table provides a comparison of the performance of NewImp against several other benchmark methods.

This table presents the imputation quality of NewImp and other imputation approaches under the MAR and MCAR scenarios. The results are shown for eight different datasets, indicating MAE and WASS scores for each method. The best results are bolded and the second-best results are underlined. An asterisk (*) indicates that NewImp significantly outperforms the other methods for a given dataset according to a paired sample t-test.

This table presents the imputation quality results obtained using various imputation methods across eight datasets with 30% missing values under two scenarios: Missing at Random (MAR) and Missing Completely at Random (MCAR). The metrics used are Mean Absolute Error (MAE) and Wasserstein-2 distance (WASS), both modified to consider only missing values. The table shows the MAE and WASS values for each method and dataset, allowing for comparison of the different imputation methods’ performance under different missing data mechanisms.
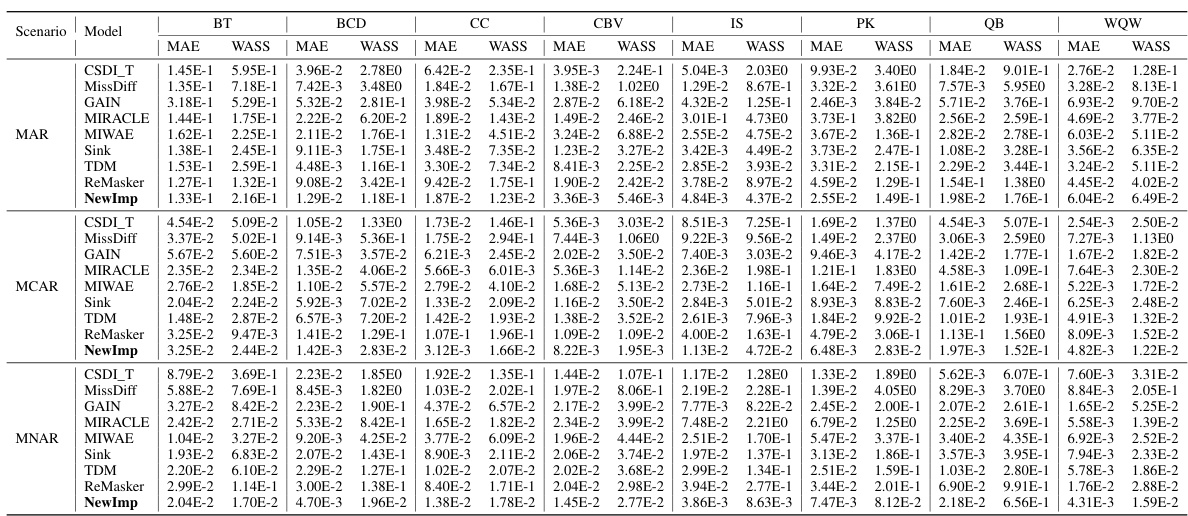
This table presents the imputation quality results of NewImp and other imputation approaches under the Missing At Random (MAR) and Missing Completely At Random (MCAR) scenarios with a 30% missing rate. The results are shown for MAE and WASS metrics across eight different datasets. The best results for each dataset and metric are bolded.

This table presents the imputation quality results of NewImp and other imputation approaches under the Missing At Random (MAR) and Missing Completely At Random (MCAR) scenarios. The missing rate is set to 30%. The table shows the MAE and WASS values for various datasets and models. The best results for each metric and scenario are highlighted in bold.
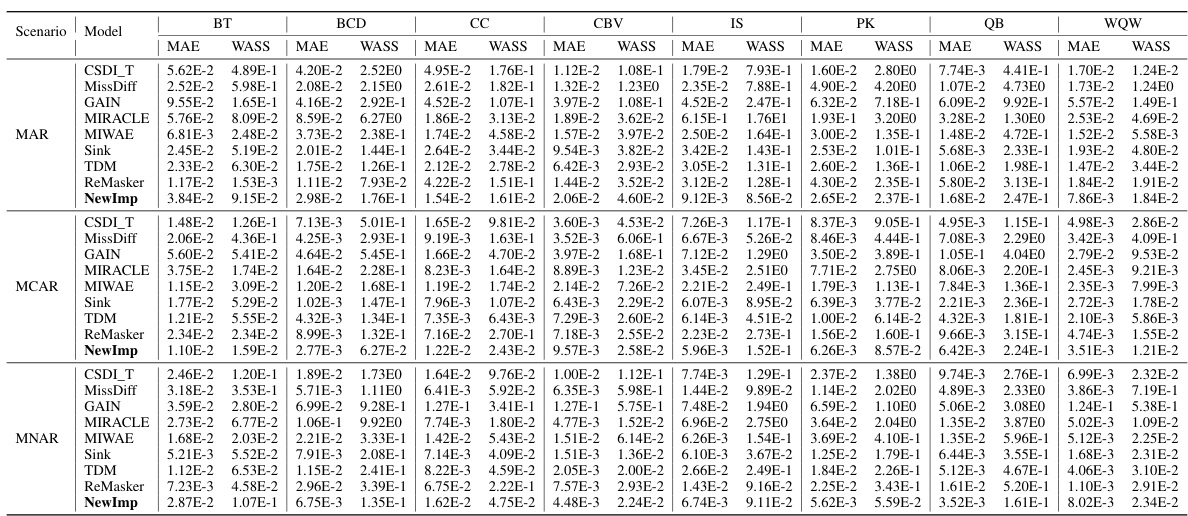
This table presents the imputation accuracy (MAE and WASS) results for eight different datasets under three missing data mechanisms (MAR, MCAR, MNAR). The table compares the performance of the proposed NewImp method against several baseline methods. The results are shown for various datasets, allowing for a comparison of model performance across different data characteristics and missing data scenarios.
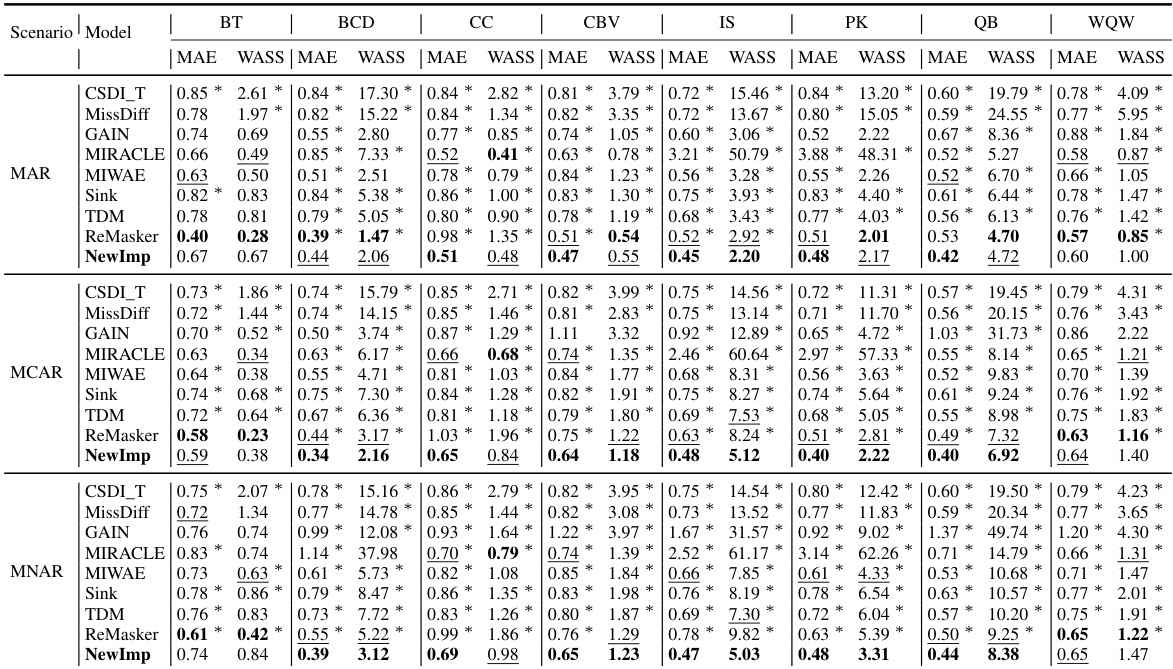
This table presents the imputation quality results achieved by NewImp and other compared imputation methods on eight real-world datasets. The results are shown for both Missing at Random (MAR) and Missing Completely at Random (MCAR) scenarios, with MAE (Mean Absolute Error) and WASS (Wasserstein-2 distance) metrics used for evaluation. The best performance for each dataset and scenario is highlighted in bold.
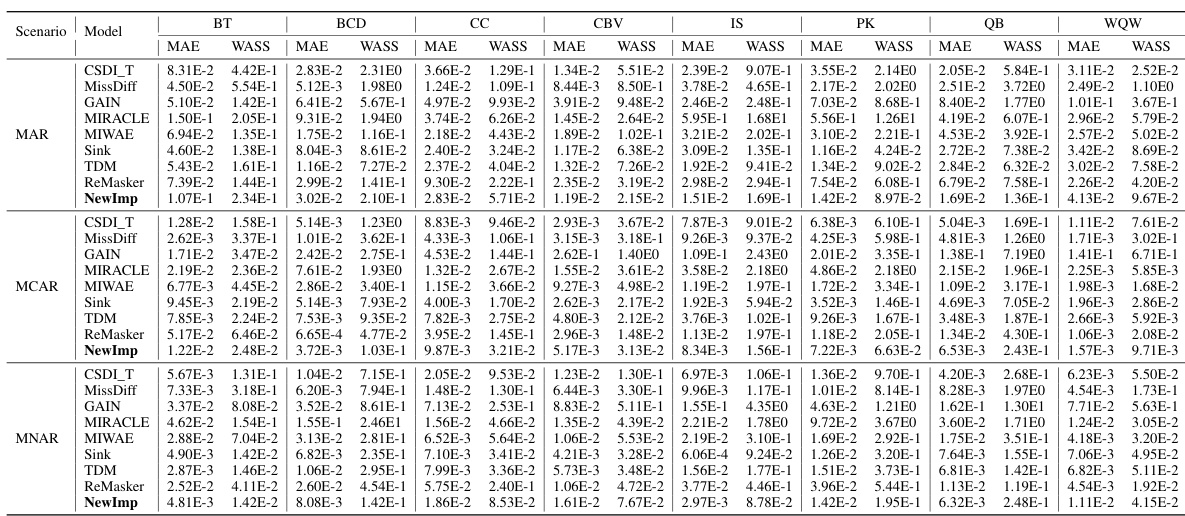
This table presents the imputation accuracy results for various missing data imputation methods on eight benchmark datasets using two evaluation metrics: Mean Absolute Error (MAE) and Wasserstein-2 distance (WASS). The results are shown for three different scenarios: Missing Completely at Random (MCAR), Missing at Random (MAR), and Missing Not at Random (MNAR). The table allows for a comparison of the performance of NewImp against other state-of-the-art methods across different missing data mechanisms and datasets.
Full paper#


