TL;DR#
Many machine learning applications struggle with limited tabular data. Current data augmentation methods often overfit or generate poor quality synthetic data. This paper introduces TabEBM, a novel data augmentation technique using class-conditional generative models based on Energy-Based Models (EBMs).
TabEBM’s key innovation is using distinct EBMs for each class, rather than a shared model. This approach generates higher-quality synthetic data with better statistical fidelity than existing methods. Experiments show consistent improvements in classification performance across various datasets and sizes, especially small ones. The project’s open-source code further promotes reproducibility and wider adoption.
Key Takeaways#
Why does it matter?#
This paper is crucial for researchers dealing with small tabular datasets, a common challenge across many scientific domains. It introduces a novel data augmentation method that consistently improves model performance, particularly important for applications with limited data. The open-source code also enhances reproducibility and facilitates wider adoption of the technique. The method’s focus on class-specific models addresses a significant gap in existing data augmentation methods, opening new avenues for research on generating high-fidelity synthetic data.
Visual Insights#
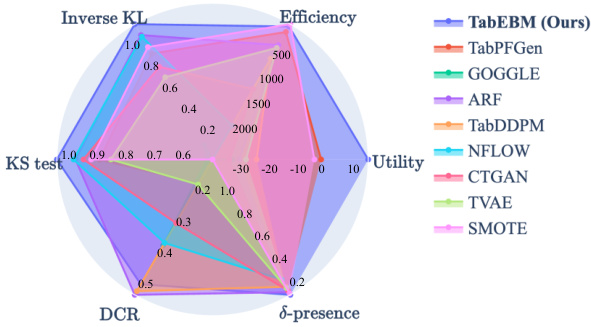
🔼 This radar chart compares TabEBM against other state-of-the-art tabular data generation methods across six metrics: Inverse KL, KS test, Efficiency, Utility, DCR, and δ-presence. Each axis represents a metric, and the area of each polygon section corresponds to the method’s performance on that metric. A larger polygon area indicates better performance. The chart highlights TabEBM’s superior performance in data augmentation (utility), demonstrating its effectiveness in generating high-quality synthetic data.
read the caption
Figure 1: Evaluation of TabEBM and other state-of-the-art tabular generative methods across six key metrics (larger area indicates better performance). The results demonstrate that TabEBM excels in data augmentation (utility), with a larger area than all other methods.

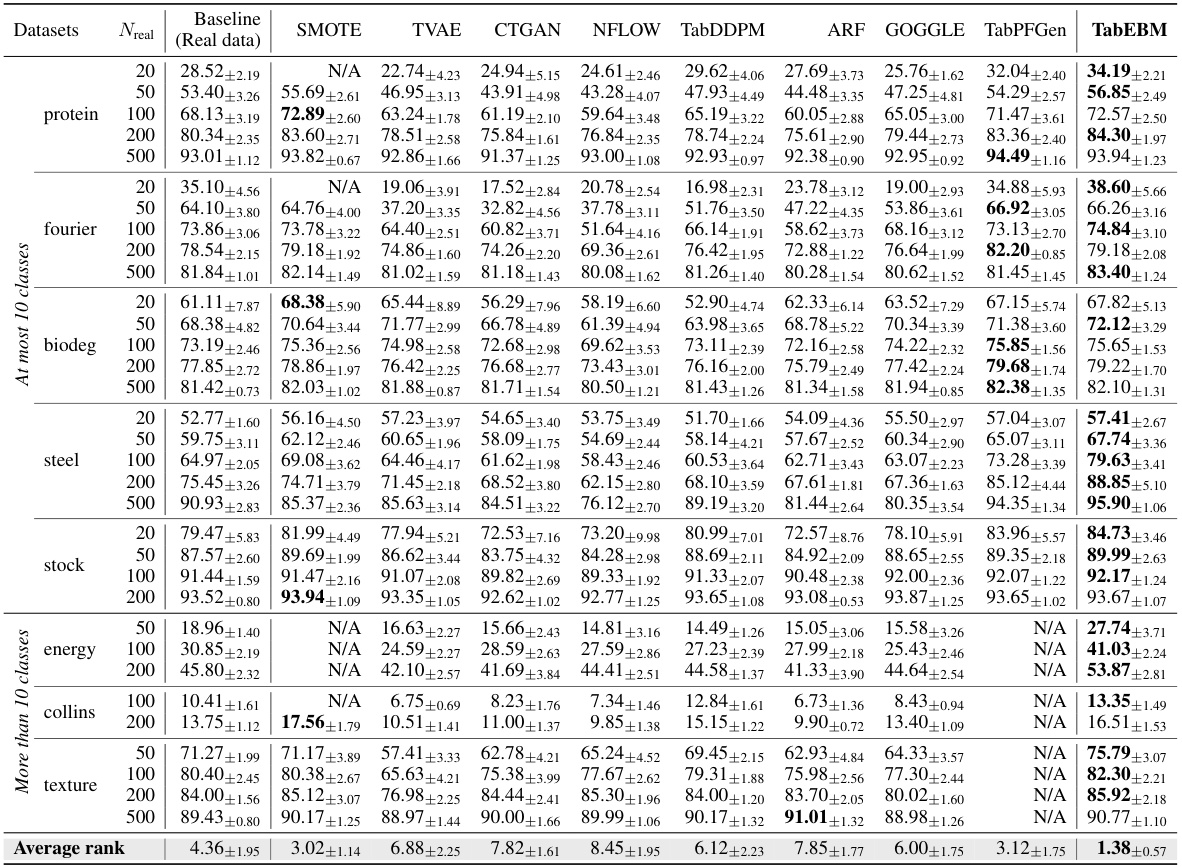
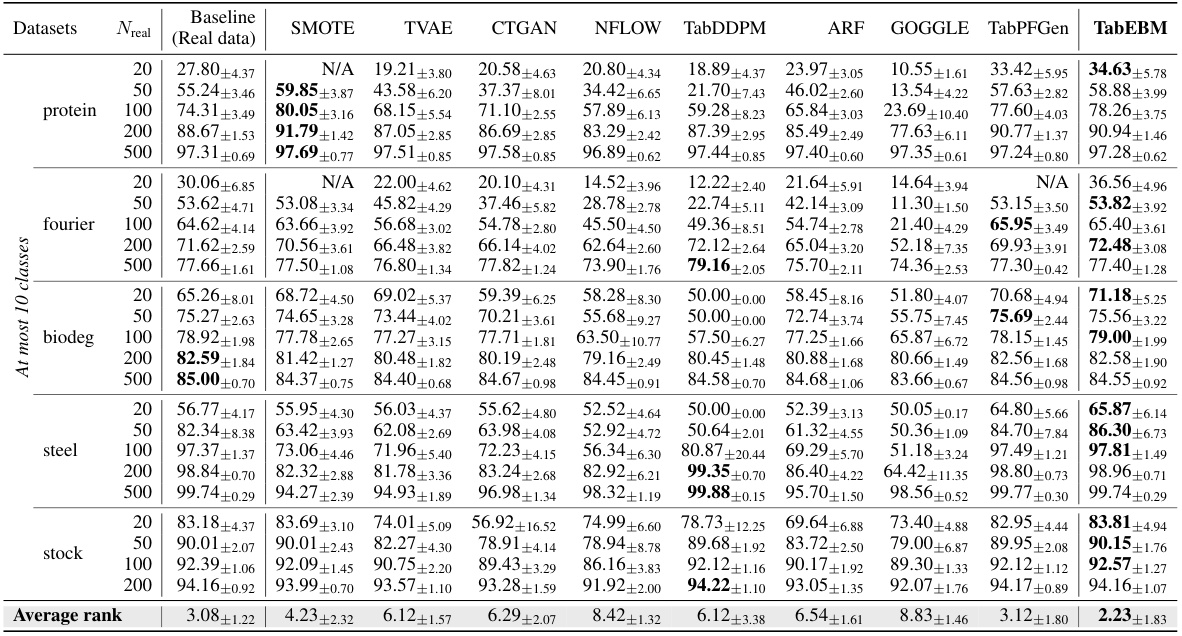
🔼 This table presents the classification accuracy results obtained using six different downstream predictors on eight real-world tabular datasets. The accuracy is evaluated using data augmentation with various methods, including TabEBM and several benchmark algorithms. The results are shown for varying sizes of the real training dataset and are aggregated across the six predictors to provide a comprehensive comparison. The table highlights TabEBM’s consistent superior performance compared to using only real data or other augmentation techniques.
read the caption
Table 1: Classification accuracy (%) aggregated over six downstream predictors, comparing data augmentation on eight real-world tabular datasets with varied real data availability. We report the mean ± std balanced accuracy and average accuracy rank across datasets. A higher rank implies higher accuracy. Note that “N/A” denotes that a specific generator was not applicable or the downstream predictor failed to converge, and the rank is computed with the mean balanced accuracy of other methods. We bold the highest accuracy for each dataset of different sample sizes. TabEBM consistently outperforms training on real data alone, and achieves the best overall performance against Baseline and benchmark generators.
In-depth insights#
Tabular Data Augmentation#
Tabular data augmentation aims to address the challenges of limited data in training machine learning models for tabular datasets. Existing methods often struggle due to overfitting and poor data quality, leading to decreased model performance. This paper introduces a novel approach that leverages class-specific energy-based models (EBMs). Unlike traditional methods using a shared model for all classes, this technique creates distinct EBMs for each class, resulting in more robust energy landscapes and higher-quality synthetic data. This approach improves downstream classification performance across various datasets, especially those with limited samples. The key innovation lies in its training-free nature and the use of pre-trained classifiers, converting them into generative models without additional training, increasing efficiency and practicality. The results demonstrate that the approach effectively enhances model accuracy and maintains statistical fidelity.
Class-Specific EBMs#
The core idea behind Class-Specific EBMs is to move away from the traditional approach of using a single, shared energy-based model to represent the class-conditional densities in tabular data augmentation. Instead, this method advocates for creating distinct EBMs for each class, learning each class’s marginal distribution individually. This key innovation leads to several advantages. First, it creates more robust energy landscapes, especially beneficial when dealing with ambiguous class distributions or imbalanced datasets where a shared model might overfit or collapse. Second, the class-specific nature ensures that the generated synthetic data better captures the unique characteristics of each class, improving data augmentation’s quality and downstream prediction performance. In essence, it’s a more sophisticated and nuanced approach that leverages the power of EBMs while addressing common limitations of other generative methods in tabular data augmentation.
Synthetic Data Fidelity#
Synthetic data fidelity is a crucial aspect of any data augmentation method. It refers to how closely the generated synthetic data resembles the real data’s statistical properties. High fidelity is essential because low-fidelity synthetic data can mislead machine learning models, leading to poor generalization and unreliable predictions. Assessing fidelity often involves comparing statistical distributions (e.g., using Kolmogorov-Smirnov tests or Kullback-Leibler divergence), and evaluating the preservation of correlations and other data characteristics. The goal is to generate data that is statistically indistinguishable from the real data, enabling effective data augmentation without introducing bias or artifacts. Various metrics can be used, but choosing the right ones depends heavily on the nature of the data and the downstream task. The use of multiple metrics to give a holistic assessment of fidelity is generally recommended. An ideal generative model for data augmentation would produce high-fidelity synthetic data efficiently and robustly, adapting to diverse datasets and various sizes of training sets. Achieving this balance remains a key challenge in the field.
Privacy-Preserving DA#
Privacy-preserving data augmentation (DA) is a crucial area of research, aiming to enhance model performance while mitigating privacy risks. Existing DA methods often create synthetic data that inadvertently reveals information about the original training data, leading to privacy breaches. This is particularly concerning for sensitive data like medical records or financial information. Therefore, privacy-preserving DA techniques focus on generating high-quality synthetic data that closely resembles the statistical properties of the real data but does not leak sensitive information. This can be achieved through various approaches, including differential privacy, generative models with privacy constraints, or data anonymization before augmentation. The challenge lies in finding a balance between data utility for improving model accuracy and maintaining strong privacy guarantees. Successful privacy-preserving DA methods must carefully consider the trade-off between these competing objectives. Furthermore, rigorous evaluations are essential to assess the effectiveness of privacy-preserving DA methods, going beyond simple accuracy metrics and including measures like differential privacy parameters or re-identification risk.
Future Research#
Future research directions stemming from this TabEBM paper could explore several key areas. Extending TabEBM to handle high-cardinality categorical features and mixed-data types is crucial for broader applicability. Improving the efficiency of the sampling process, potentially through advancements in sampling algorithms like SGLD or exploring alternative methods, would enhance scalability. A thorough investigation into the generalizability of TabEBM across diverse datasets is needed, focusing on performance with imbalanced data and varying feature distributions. Incorporating privacy-preserving techniques into the synthetic data generation itself could further enhance its utility for sensitive data. Finally, exploring the use of different pre-trained models beyond TabPFN to create the class-specific EBMs and evaluating their effect on performance is another avenue of research.
More visual insights#
More on figures

🔼 This figure illustrates the TabEBM process. First, the real data, separated by class (blue and red), is shown. Then, two separate EBMs, one for each class, are trained on their respective data. Each EBM learns the class-conditional distribution p(x|y), where x represents the data features and y represents the class label. Finally, new synthetic data is generated by sampling from the learned class-conditional distributions. This illustrates the key concept of using distinct class-specific EBMs for more robust generation, especially on small or ambiguous datasets.
read the caption
Figure 2: An overview of TabEBM. We learn distinct class-specific Energy-Based Models (EBMs) Eblue(x) and Ered(x) exclusively on the points of their respective class. Each EBM approximates a class-conditional distribution p(x|y). TabEBM allows synthetic data generation by sampling from the estimated distributions for each class p(x|y = blue) and p(x|y = red).

🔼 This figure shows the energy landscape learned by TabEBM for a single class. The blue areas represent low energy, corresponding to high probability density. The dark orange dots represent negative samples that are placed far from the real data points (light blue dots) in the corners of a hypercube. The placement of negative samples is a key aspect of TabEBM; it allows TabPFN, the classifier used to construct the energy function, to learn accurate marginal class distributions even when classes overlap or are unbalanced. The figure highlights TabEBM’s ability to generate robust energy landscapes that accurately capture the data distribution.
read the caption
Figure 3: The class-specific energy function Ec(x) from the surrogate binary task, where the blue region represents low energy (i.e., high data density). Placing the negative samples in a hypercube distant from the data results in an accurate energy function.

🔼 This figure shows the results of experiments evaluating the impact of TabEBM on data augmentation. The left panel shows the mean normalized balanced accuracy improvement across different sample sizes (20, 50, 100, 200, 500) for various tabular data augmentation methods, highlighting the consistent superior performance of TabEBM, especially for small datasets. The right panel displays the mean normalized balanced accuracy improvement across datasets with varying numbers of classes. TabEBM again shows a marked improvement compared to other methods, particularly those with more than 10 classes, indicating its robustness in complex, multi-class scenarios.
read the caption
Figure 4: Mean normalised balanced accuracy improvement (%) across different sample sizes (Left) and across datasets with varying numbers of classes (Right). Because TabPFGen is not applicable for datasets with more than ten classes, we plot short bars at zeros for visual clearance. Positive values indicate that the generator improves downstream classification performance. TabEBM generally outperforms benchmark generators across varying sample sizes and number of classes.
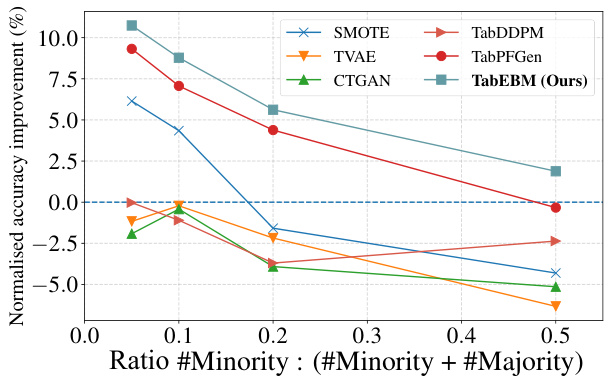
🔼 This figure shows the mean normalized balanced accuracy improvement achieved by different data augmentation methods across various sample sizes (left panel) and different numbers of classes (right panel). The left panel demonstrates that TabEBM consistently outperforms other methods, particularly with smaller sample sizes. The right panel illustrates TabEBM’s robustness across different numbers of classes, whereas other methods show performance degradation as the number of classes increases.
read the caption
Figure 4: Mean normalised balanced accuracy improvement (%) across different sample sizes (Left) and across datasets with varying numbers of classes (Right). Because TabPFGen is not applicable for datasets with more than ten classes, we plot short bars at zeros for visual clearance. Positive values indicate that the generator improves downstream classification performance. TabEBM generally outperforms benchmark generators across varying sample sizes and number of classes.

🔼 This figure compares TabEBM against other state-of-the-art tabular generative models using six different metrics: KS test, Inverse KL, Efficiency, Utility, DCR, and δ-presence. Each metric is represented as a polygon whose area corresponds to the model’s performance on that metric, with larger areas indicating better performance. The figure shows that TabEBM outperforms all other methods, particularly in terms of data augmentation (utility).
read the caption
Figure 1: Evaluation of TabEBM and other state-of-the-art tabular generative methods across six key metrics (larger area indicates better performance). The results demonstrate that TabEBM excels in data augmentation (utility), with a larger area than all other methods.

🔼 This figure shows the logit distribution learned by TabPFN, a pre-trained tabular in-context model, when trained on surrogate binary classification tasks. The left panel plots the logits against the Euclidean distance from real data points. As the distance increases, the logits decrease, indicating uncertainty as the classifier becomes less sure of the class label. The right panel shows the unnormalized density estimated by TabEBM using these logits. It reveals that the estimated density decreases sharply as the distance from real data increases, indicating TabEBM effectively captures data distribution and focuses on generating samples close to the real data.
read the caption
Figure 8: (Left) Logit distribution of TabPFN trained on our surrogate binary tasks at increasing distances from the real data (on “steel”). (Right) The corresponding unnormalised density approximated by TabEBM. TabEBM assigns higher density closer to the real data.

🔼 This figure compares TabEBM to 8 other state-of-the-art tabular data generation methods across 6 different metrics that evaluate the quality of the generated synthetic data. The size of each colored area on the radar chart is proportional to the performance of the corresponding method on the metric. A larger area indicates better performance. TabEBM is shown to outperform the others, particularly regarding the ‘utility’ metric which specifically measures the effectiveness of data augmentation.
read the caption
Figure 1: Evaluation of TabEBM and other state-of-the-art tabular generative methods across six key metrics (larger area indicates better performance). The results demonstrate that TabEBM excels in data augmentation (utility), with a larger area than all other methods.

🔼 This figure compares TabEBM against other state-of-the-art tabular data generation methods using six evaluation metrics (KS test, Inverse KL, Efficiency, Utility, DCR, and 8-presence). Each method is represented by a polygon whose area corresponds to its overall performance across all metrics. Larger areas indicate better performance. The figure highlights that TabEBM has the largest area, indicating superior performance, especially in data augmentation (utility).
read the caption
Figure 1: Evaluation of TabEBM and other state-of-the-art tabular generative methods across six key metrics (larger area indicates better performance). The results demonstrate that TabEBM excels in data augmentation (utility), with a larger area than all other methods.

🔼 This figure compares TabEBM against eight other state-of-the-art tabular generative methods using six evaluation metrics: KS test, inverse KL, efficiency, utility, DCR, and δ-presence. Each method is represented by a polygon where the size of the polygon’s area corresponds to its performance. TabEBM’s larger area indicates superior performance across the metrics, particularly in the ‘utility’ metric, demonstrating its effectiveness in data augmentation.
read the caption
Figure 1: Evaluation of TabEBM and other state-of-the-art tabular generative methods across six key metrics (larger area indicates better performance). The results demonstrate that TabEBM excels in data augmentation (utility), with a larger area than all other methods.

🔼 This figure compares the performance of TabPFGen and TabEBM in approximating class-conditional distributions under various levels of class imbalance. It shows that TabPFGen, using a single shared model, struggles to accurately represent the distributions as imbalance increases, while TabEBM, using distinct class-specific models, maintains robust and accurate approximations even under severe imbalance.
read the caption
Figure 12: Evaluating the approximated class-conditional distributions on a toy dataset of 300 samples with varying class imbalances. The two clusters maintain their positions. Darker blue indicates a higher assigned probability. TabPFGen uses a single shared energy-based model to infer the class-conditional distribution p(x|y). As class imbalance increases, TabPFGen starts assigning high probability in areas far from the real data, for instance, in the case of p(x|y = 1) for class ratio 10:290. In contrast, our TabEBM fits class-specific energy models only on the class-wise data Xc = {x(i) | Yi = c}. This results in very robust inferred conditional distributions even under heavy class imbalance (e.g., see that p(x|y = 1) remains relatively constant).

🔼 This figure shows how the class-specific energy function, a key component of TabEBM, is learned from real data samples (blue) and artificial negative samples (orange). The negative samples are strategically placed at the corners of a hypercube to ensure that they are easily distinguishable from the real data points. The resulting energy function accurately reflects the data density, with lower energy values corresponding to regions of higher probability density. This accurate representation is crucial for the effectiveness of the TabEBM model in generating high-quality synthetic data.
read the caption
Figure 3: The class-specific energy function Ec(x) from the surrogate binary task, where the blue region represents low energy (i.e., high data density). Placing the negative samples in a hypercube distant from the data results in an accurate energy function.

🔼 This figure compares TabEBM against several other state-of-the-art tabular data generation methods across six different evaluation metrics. Each method is represented by a polygon, where the size of the polygon corresponds to its performance. The larger the polygon, the better the performance. TabEBM shows the largest polygon, indicating that it significantly outperforms other methods in terms of utility for data augmentation.
read the caption
Figure 1: Evaluation of TabEBM and other state-of-the-art tabular generative methods across six key metrics (larger area indicates better performance). The results demonstrate that TabEBM excels in data augmentation (utility), with a larger area than all other methods.

🔼 This figure compares TabEBM against other state-of-the-art tabular generative models using six evaluation metrics: KS test, inverse KL, efficiency, utility, DCR, and δ-presence. Each metric is represented as a 2D area where larger area represents better performance. The results show that TabEBM outperforms other methods, especially in data augmentation (utility).
read the caption
Figure 1: Evaluation of TabEBM and other state-of-the-art tabular generative methods across six key metrics (larger area indicates better performance). The results demonstrate that TabEBM excels in data augmentation (utility), with a larger area than all other methods.
More on tables

🔼 This table presents the results of a classification accuracy experiment comparing TabEBM against other data augmentation methods. It shows the mean and standard deviation of balanced accuracy across several datasets, for different numbers of real training samples used and different numbers of classes in the dataset. Higher accuracy ranks indicate better performance. N/A indicates when the method wasn’t applicable or the classifier failed to converge for a given data condition.
read the caption
Table 1: Classification accuracy (%) aggregated over six downstream predictors, comparing data augmentation on eight real-world tabular datasets with varied real data availability. We report the mean ± std balanced accuracy and average accuracy rank across datasets. A higher rank implies higher accuracy. Note that “N/A” denotes that a specific generator was not applicable or the downstream predictor failed to converge, and the rank is computed with the mean balanced accuracy of other methods. We bold the highest accuracy for each dataset of different sample sizes. TabEBM achieves the best overall performance against Baseline and benchmark generators.

🔼 This table compares TabEBM against other existing methods from three perspectives: training (the type of distribution learned and whether it’s training-free), generation (whether class-specific models or stratified generation are used), and practicality (scalability to unlimited classes and consistent downstream accuracy improvements across different datasets). Each method’s characteristics are summarized with checkmarks or crosses, highlighting TabEBM’s advantages.
read the caption
Table 2: Comparison of the properties between TabEBM and prior tabular generative methods. TabEBM has novel design rationales of training-free class-specific models, and TabEBM is highly practicable with wide applicability and consistent accuracy improvement.

🔼 This table presents a comparison of classification accuracy across various data augmentation techniques on eight real-world tabular datasets. The accuracy is calculated using six different downstream predictors, averaged across multiple runs. The table includes results for different real data set sizes, allowing for the evaluation of each method’s performance under data scarcity. The mean and standard deviation of balanced accuracy are presented, along with an average rank across all datasets. ‘N/A’ indicates cases where a method was not applicable or did not converge. The goal is to highlight TabEBM’s consistent superior performance compared to using real data alone and other baseline/benchmark methods.
read the caption
Table 1: Classification accuracy (%) aggregated over six downstream predictors, comparing data augmentation on eight real-world tabular datasets with varied real data availability. We report the mean ± std balanced accuracy and average accuracy rank across datasets. A higher rank implies higher accuracy. Note that “N/A” denotes that a specific generator was not applicable or the downstream predictor failed to converge, and the rank is computed with the mean balanced accuracy of other methods. We bold the highest accuracy for each dataset of different sample sizes. TabEBM achieves the best overall performance against Baseline and benchmark generators.

🔼 This table presents the classification accuracy results obtained using six different downstream predictors on eight real-world tabular datasets. The accuracy is calculated using data augmentation with various methods including TabEBM and several benchmark methods (SMOTE, TVAE, CTGAN, NFLOW, TabDDPM, ARF, GOGGLE, TabPFGen). The table shows the mean and standard deviation of the balanced accuracy, and the average accuracy rank across all datasets for different sample sizes (20, 50, 100, 200, 500). Results are presented to demonstrate TabEBM’s superior performance compared to training only with real data and other generative methods.
read the caption
Table 1: Classification accuracy (%) aggregated over six downstream predictors, comparing data augmentation on eight real-world tabular datasets with varied real data availability. We report the mean ± std balanced accuracy and average accuracy rank across datasets. A higher rank implies higher accuracy. Note that “N/A” denotes that a specific generator was not applicable or the downstream predictor failed to converge, and the rank is computed with the mean balanced accuracy of other methods. We bold the highest accuracy for each dataset of different sample sizes. Our method, TabEBM, consistently outperforms training on real data alone, and achieves the best overall performance against Baseline and benchmark generators.

🔼 This table presents a comparison of classification accuracy achieved by six different downstream predictors when using various data augmentation methods on eight real-world tabular datasets. The results are shown for various sizes of the real training data, demonstrating how each augmentation method affects prediction accuracy. The table highlights TabEBM’s consistent superior performance over training with only real data and other benchmark methods across different dataset sizes and numbers of classes.
read the caption
Table 1: Classification accuracy (%) aggregated over six downstream predictors, comparing data augmentation on eight real-world tabular datasets with varied real data availability. We report the mean ± std balanced accuracy and average accuracy rank across datasets. A higher rank implies higher accuracy. Note that “N/A” denotes that a specific generator was not applicable or the downstream predictor failed to converge, and the rank is computed with the mean balanced accuracy of other methods. We bold the highest accuracy for each dataset of different sample sizes. Our method, TabEBM, consistently outperforms training on real data alone, and achieves the best overall performance against Baseline and benchmark generators.

🔼 This table presents a comprehensive comparison of the classification accuracy achieved by different data augmentation methods on eight real-world tabular datasets. The results are aggregated across six downstream prediction models (LR, KNN, MLP, RF, XGBoost, TabPFN). The table shows the mean and standard deviation of the balanced accuracy for each dataset and various sample sizes (20, 50, 100, 200, 500). A higher rank indicates better performance. ‘N/A’ signifies cases where a specific augmentation method was inapplicable or the predictor failed to converge. The table highlights TabEBM’s superior performance compared to baseline and other methods.
read the caption
Table 1: Classification accuracy (%) aggregated over six downstream predictors, comparing data augmentation on eight real-world tabular datasets with varied real data availability. We report the mean ± std balanced accuracy and average accuracy rank across datasets. A higher rank implies higher accuracy. Note that “N/A” denotes that a specific generator was not applicable or the downstream predictor failed to converge, and the rank is computed with the mean balanced accuracy of other methods. We bold the highest accuracy for each dataset of different sample sizes. TabEBM achieves the best overall performance against Baseline and benchmark generators.

🔼 This table presents the classification accuracy results obtained using six different downstream predictors on eight real-world tabular datasets. The accuracy is evaluated using data augmentation with several generative methods (including TabEBM), and results are shown for various amounts of real training data (Nreal). The table reports the mean and standard deviation of the balanced accuracy, as well as the average rank across all datasets. A higher rank indicates better performance. ‘N/A’ indicates cases where a generator was not applicable or the predictor failed to converge. The key takeaway is that TabEBM consistently outperforms the baseline (no data augmentation) and other generative methods.
read the caption
Table 1: Classification accuracy (%) aggregated over six downstream predictors, comparing data augmentation on eight real-world tabular datasets with varied real data availability. We report the mean ± std balanced accuracy and average accuracy rank across datasets. A higher rank implies higher accuracy. Note that “N/A” denotes that a specific generator was not applicable or the downstream predictor failed to converge, and the rank is computed with the mean balanced accuracy of other methods. We bold the highest accuracy for each dataset of different sample sizes. TabEBM consistently outperforms training on real data alone, and achieves the best overall performance against Baseline and benchmark generators.

🔼 This table presents the classification accuracy results obtained using six different downstream predictors on eight real-world tabular datasets, with data augmentation performed by TabEBM and other state-of-the-art methods. The table shows mean ± standard deviation of the balanced accuracy for different real data availabilities (Nreal). Higher rank indicates better performance. The ‘N/A’ entries represent cases where a method was not applicable or the predictor did not converge. TabEBM’s consistently superior performance is highlighted by bolding the best accuracy for each dataset size.
read the caption
Table 1: Classification accuracy (%) aggregated over six downstream predictors, comparing data augmentation on eight real-world tabular datasets with varied real data availability. We report the mean ± std balanced accuracy and average accuracy rank across datasets. A higher rank implies higher accuracy. Note that “N/A” denotes that a specific generator was not applicable or the downstream predictor failed to converge, and the rank is computed with the mean balanced accuracy of other methods. We bold the highest accuracy for each dataset of different sample sizes. TabEBM consistently outperforms training on real data alone, and achieves the best overall performance against Baseline and benchmark generators.

🔼 This table presents the classification accuracy of six different downstream machine learning models trained on eight real-world tabular datasets. The accuracy is evaluated using balanced accuracy (mean ± standard deviation) and average rank, across datasets, and for different sample sizes. The results show the impact of data augmentation using TabEBM and other methods on classification accuracy. Higher accuracy ranks indicate better performance. ‘N/A’ indicates that a method was inapplicable or the model failed to converge for a given dataset and sample size.
read the caption
Table 1: Classification accuracy (%) aggregated over six downstream predictors, comparing data augmentation on eight real-world tabular datasets with varied real data availability. We report the mean ± std balanced accuracy and average accuracy rank across datasets. A higher rank implies higher accuracy. Note that “N/A” denotes that a specific generator was not applicable or the downstream predictor failed to converge, and the rank is computed with the mean balanced accuracy of other methods. We bold the highest accuracy for each dataset of different sample sizes. TabEBM achieves the best overall performance against Baseline and benchmark generators.
🔼 This table presents a comparison of classification accuracy across different data augmentation methods on eight real-world tabular datasets. The accuracy is averaged across six downstream predictors (Logistic Regression, KNN, MLP, Random Forest, XGBoost, TabPFN) for different sample sizes (20, 50, 100, 200, 500). The table reports mean ± standard deviation of balanced accuracy and the average rank across all datasets. A higher rank indicates better performance. N/A indicates when a specific generator was not applicable or the predictor failed to converge. The results show that TabEBM consistently outperforms training on real data alone (Baseline) and other benchmark generators (SMOTE, TVAE, CTGAN, NFLOW, TabDDPM, ARF, GOGGLE, TabPFGen).
read the caption
Table 1: Classification accuracy (%) aggregated over six downstream predictors, comparing data augmentation on eight real-world tabular datasets with varied real data availability. We report the mean ± std balanced accuracy and average accuracy rank across datasets. A higher rank implies higher accuracy. Note that “N/A” denotes that a specific generator was not applicable or the downstream predictor failed to converge, and the rank is computed with the mean balanced accuracy of other methods. We bold the highest accuracy for each dataset of different sample sizes. TabEBM consistently outperforms training on real data alone, and achieves the best overall performance against Baseline and benchmark generators.
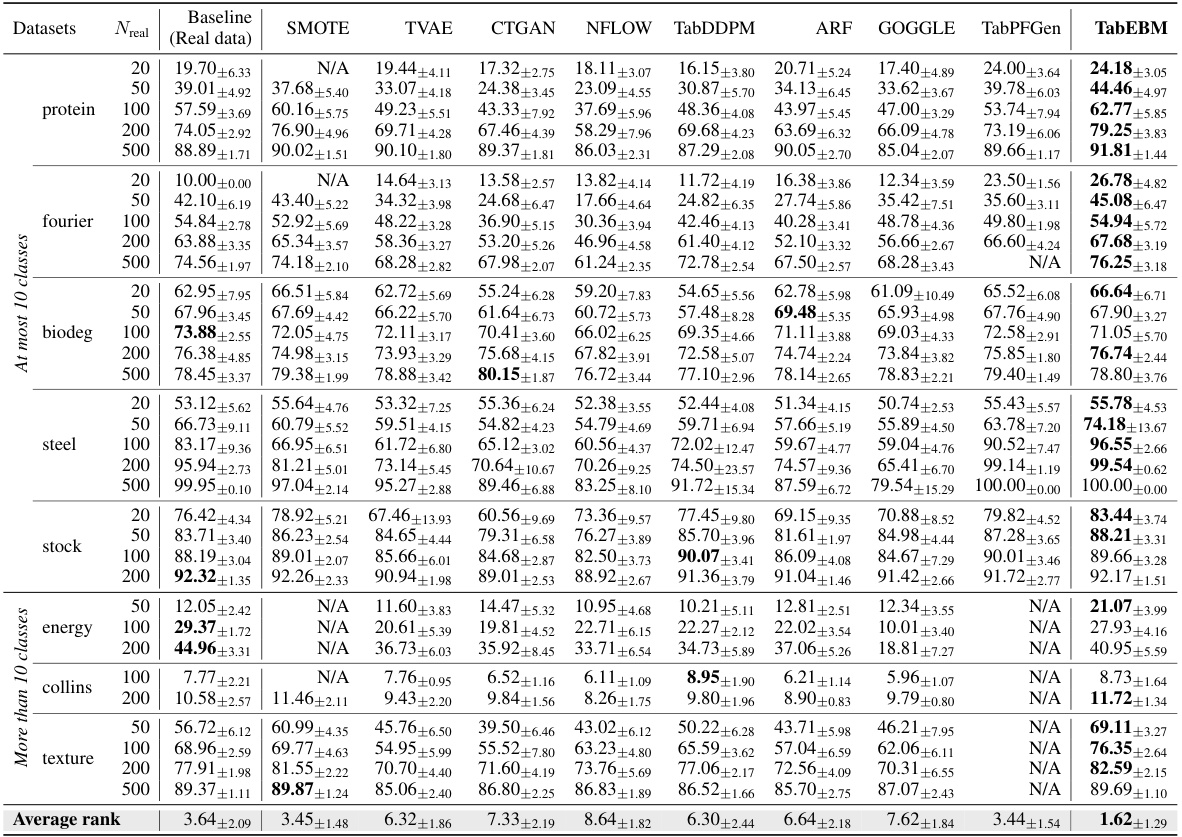
🔼 This table presents a comparison of classification accuracy across multiple tabular datasets, using six different prediction models and nine different data generation methods. The results are organized by dataset, sample size, and method, showing mean balanced accuracy and rank. The table highlights the performance of TabEBM, a newly proposed method, relative to baseline and other well-established methods. It shows the impact of data augmentation on model accuracy across various datasets and sample sizes, particularly highlighting TabEBM’s superior performance, especially in small datasets.
read the caption
Table 1: Classification accuracy (%) aggregated over six downstream predictors, comparing data augmentation on eight real-world tabular datasets with varied real data availability. We report the mean ± std balanced accuracy and average accuracy rank across datasets. A higher rank implies higher accuracy. Note that “N/A” denotes that a specific generator was not applicable or the downstream predictor failed to converge, and the rank is computed with the mean balanced accuracy of other methods. We bold the highest accuracy for each dataset of different sample sizes. TabEBM achieves the best overall performance against Baseline and benchmark generators.
🔼 This table presents the classification accuracy results of six different downstream predictors, each trained on synthetic data generated using different data augmentation methods (including TabEBM) and real data. The results are averaged across eight tabular datasets, with varying amounts of real training data used. The table shows the mean and standard deviation of balanced accuracy, as well as the average rank of the models, where a higher rank indicates better performance. The “N/A” entries indicate cases where either a specific data augmentation method was not applicable to the dataset or the predictor model failed to converge during training. The key takeaway is that TabEBM consistently outperforms both training on real data alone (Baseline) and other data augmentation methods.
read the caption
Table 1: Classification accuracy (%) aggregated over six downstream predictors, comparing data augmentation on eight real-world tabular datasets with varied real data availability. We report the mean ± std balanced accuracy and average accuracy rank across datasets. A higher rank implies higher accuracy. Note that “N/A” denotes that a specific generator was not applicable or the downstream predictor failed to converge, and the rank is computed with the mean balanced accuracy of other methods. We bold the highest accuracy for each dataset of different sample sizes. TabEBM achieves the best overall performance against Baseline and benchmark generators.

🔼 This table presents the results of a classification accuracy experiment comparing TabEBM against several other data augmentation methods. The experiment measures the balanced accuracy and average accuracy rank across eight real-world tabular datasets with varying amounts of real training data. Higher ranks indicate better performance. ‘N/A’ indicates where a method wasn’t applicable or the downstream predictor didn’t converge. The table highlights TabEBM’s consistent superior performance.
read the caption
Table 1: Classification accuracy (%) aggregated over six downstream predictors, comparing data augmentation on eight real-world tabular datasets with varied real data availability. We report the mean ± std balanced accuracy and average accuracy rank across datasets. A higher rank implies higher accuracy. Note that “N/A” denotes that a specific generator was not applicable or the downstream predictor failed to converge, and the rank is computed with the mean balanced accuracy of other methods. We bold the highest accuracy for each dataset of different sample sizes. TabEBM achieves the best overall performance against Baseline and benchmark generators.

🔼 This table presents the classification accuracy results obtained from six different downstream predictors using eight real-world tabular datasets. The accuracy is evaluated with varied amounts of real training data (Nreal), showing the impact of data augmentation. The table reports the mean and standard deviation of balanced accuracy and the average rank across all datasets for each data augmentation method, including TabEBM and eight benchmark methods. A higher rank indicates better performance. ‘N/A’ indicates where a method was not applicable or the predictor failed to converge. The results demonstrate TabEBM’s superior performance, consistently outperforming methods that use only real data and other benchmark data augmentation techniques.
read the caption
Table 1: Classification accuracy (%) aggregated over six downstream predictors, comparing data augmentation on eight real-world tabular datasets with varied real data availability. We report the mean ± std balanced accuracy and average accuracy rank across datasets. A higher rank implies higher accuracy. Note that “N/A” denotes that a specific generator was not applicable or the downstream predictor failed to converge, and the rank is computed with the mean balanced accuracy of other methods. We bold the highest accuracy for each dataset of different sample sizes. TabEBM consistently outperforms training on real data alone and achieves the best overall performance against Baseline and benchmark generators.

🔼 This table presents the classification accuracy results achieved by various data augmentation methods on eight real-world datasets. The accuracy is averaged across six different downstream prediction models and reported with standard deviation for both balanced and average accuracy. Higher ranks indicate better performance. The table shows results for different amounts of real training data to demonstrate the effect of data augmentation on datasets of varying size. Notably, it highlights TabEBM’s superior performance compared to using real data alone and other benchmark methods.
read the caption
Table 1: Classification accuracy (%) aggregated over six downstream predictors, comparing data augmentation on eight real-world tabular datasets with varied real data availability. We report the mean ± std balanced accuracy and average accuracy rank across datasets. A higher rank implies higher accuracy. Note that “N/A” denotes that a specific generator was not applicable or the downstream predictor failed to converge, and the rank is computed with the mean balanced accuracy of other methods. We bold the highest accuracy for each dataset of different sample sizes. TabEBM achieves the best overall performance against Baseline and benchmark generators.
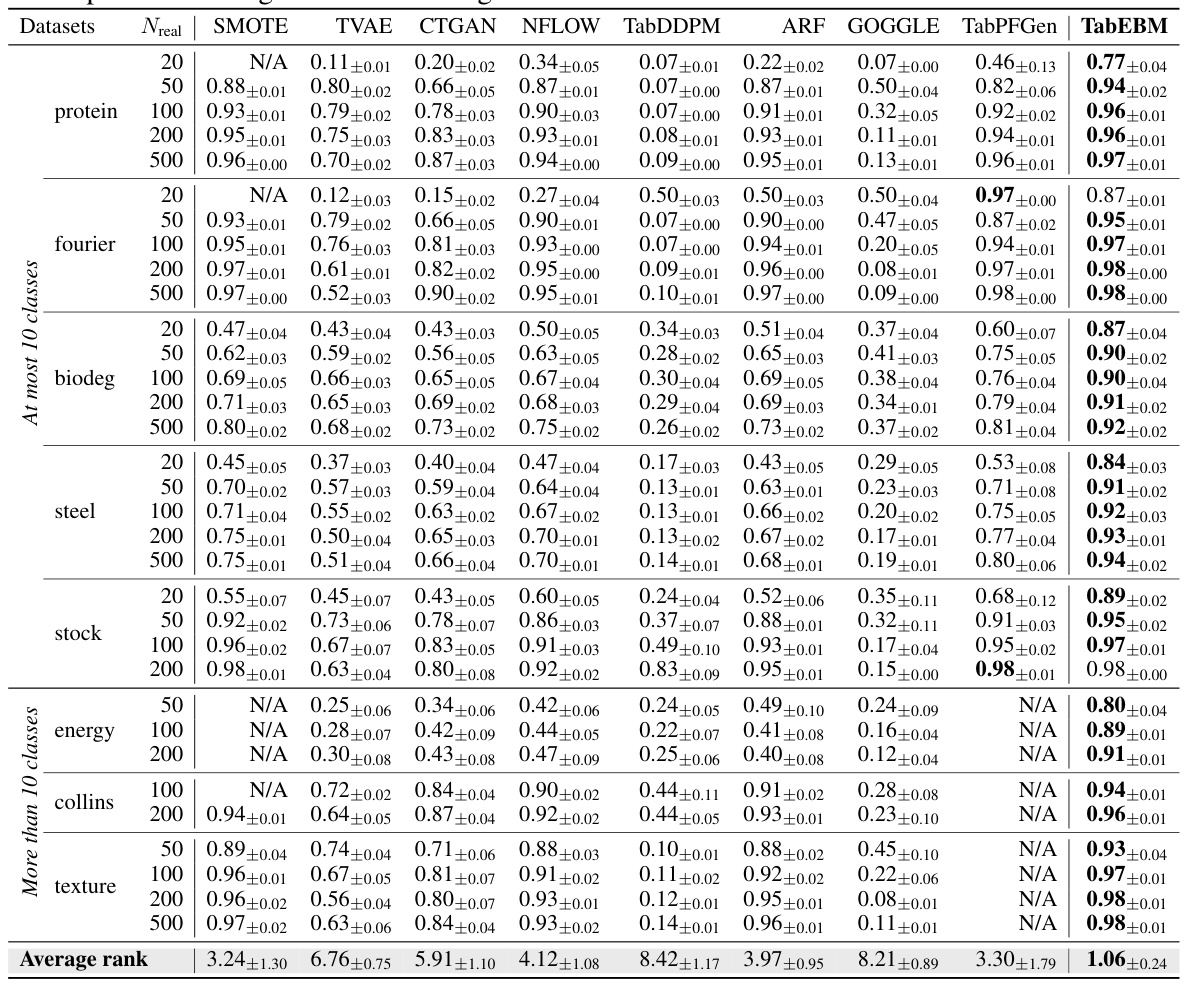
🔼 This table presents the classification accuracy results obtained using six different downstream predictors on eight real-world tabular datasets. The accuracy is evaluated with and without data augmentation using nine different data generation methods, including TabEBM. The table shows mean and standard deviation of balanced accuracy for different sample sizes of the training data. A higher rank indicates a better performance. Note that some methods were not applicable to all datasets or predictors; where this occurred the rank was computed from the mean of the other methods.
read the caption
Table 1: Classification accuracy (%) aggregated over six downstream predictors, comparing data augmentation on eight real-world tabular datasets with varied real data availability. We report the mean ± std balanced accuracy and average accuracy rank across datasets. A higher rank implies higher accuracy. Note that “N/A” denotes that a specific generator was not applicable or the downstream predictor failed to converge, and the rank is computed with the mean balanced accuracy of other methods. We bold the highest accuracy for each dataset of different sample sizes. TabEBM achieves the best overall performance against Baseline and benchmark generators.
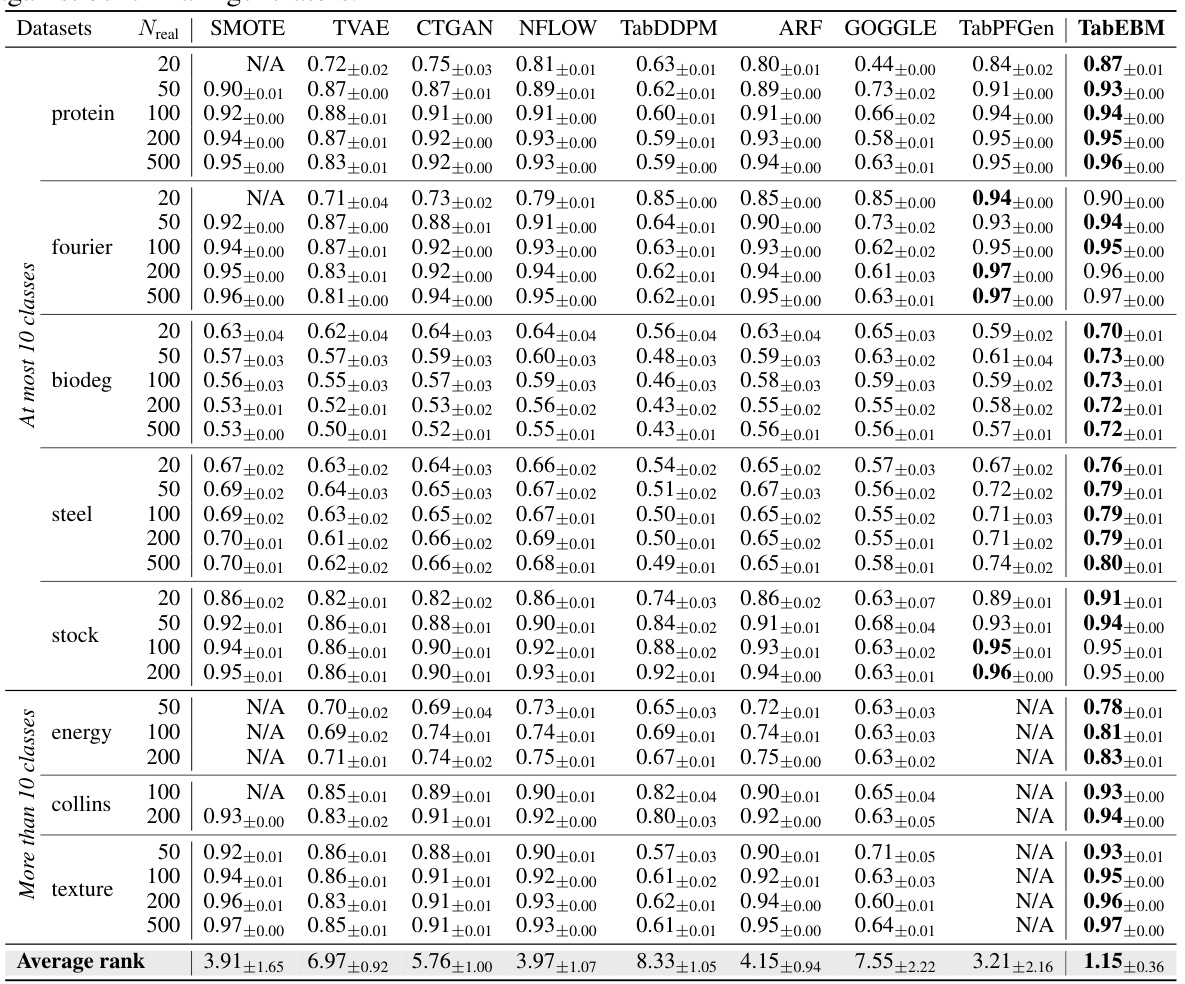
🔼 This table presents the classification accuracy results for eight real-world tabular datasets. Six different downstream predictors were used, and the results are averaged. Data augmentation was performed using TabEBM and eight other methods at various real data availabilities (sample sizes). The table reports the mean and standard deviation of balanced accuracy for each method, dataset, and sample size and includes a ranking of methods by accuracy. ‘N/A’ indicates when a method was not applicable or failed to converge for a particular combination of dataset and sample size. TabEBM consistently outperforms other methods, especially in low-sample-size scenarios.
read the caption
Table 1: Classification accuracy (%) aggregated over six downstream predictors, comparing data augmentation on eight real-world tabular datasets with varied real data availability. We report the mean ± std balanced accuracy and average accuracy rank across datasets. A higher rank implies higher accuracy. Note that “N/A” denotes that a specific generator was not applicable or the downstream predictor failed to converge, and the rank is computed with the mean balanced accuracy of other methods. We bold the highest accuracy for each dataset of different sample sizes. TabEBM achieves the best overall performance against Baseline and benchmark generators.

🔼 This table presents the results of a classification accuracy experiment using Logistic Regression (LR). Eight real-world tabular datasets were used, with varying amounts of real training data. The table shows the mean and standard deviation of balanced accuracy and an average accuracy rank across the datasets. The rank is higher for better performance. ‘N/A’ indicates cases where a specific data generator was not applicable or where the LR model failed to converge. The table highlights the superior performance of the proposed TabEBM method against a baseline (no data augmentation) and other state-of-the-art data augmentation methods.
read the caption
Table 7: Classification accuracy (%) of LR, comparing data augmentation on eight real-world tabular datasets with varied real data availability. We report the mean ± std balanced accuracy and average accuracy rank across datasets. A higher rank implies higher accuracy. Note that “N/A” denotes that a specific generator was not applicable or the downstream predictor failed to converge, and the rank is computed with the mean balanced accuracy of other methods. We bold the highest accuracy for each dataset of different sample sizes. TabEBM achieves the best overall performance against Baseline and benchmark generators.

🔼 This table presents a comparison of classification accuracy across eight real-world tabular datasets using six different downstream predictors. The comparison includes TabEBM and eight other data generation methods, with varying amounts of real training data. The results are aggregated to show the average balanced accuracy and rank for each method under different conditions. The table highlights TabEBM’s superior performance, especially when real data is scarce.
read the caption
Table 1: Classification accuracy (%) aggregated over six downstream predictors, comparing data augmentation on eight real-world tabular datasets with varied real data availability. We report the mean ± std balanced accuracy and average accuracy rank across datasets. A higher rank implies higher accuracy. Note that “N/A” denotes that a specific generator was not applicable or the downstream predictor failed to converge, and the rank is computed with the mean balanced accuracy of other methods. We bold the highest accuracy for each dataset of different sample sizes. TabEBM achieves the best overall performance against Baseline and benchmark generators.
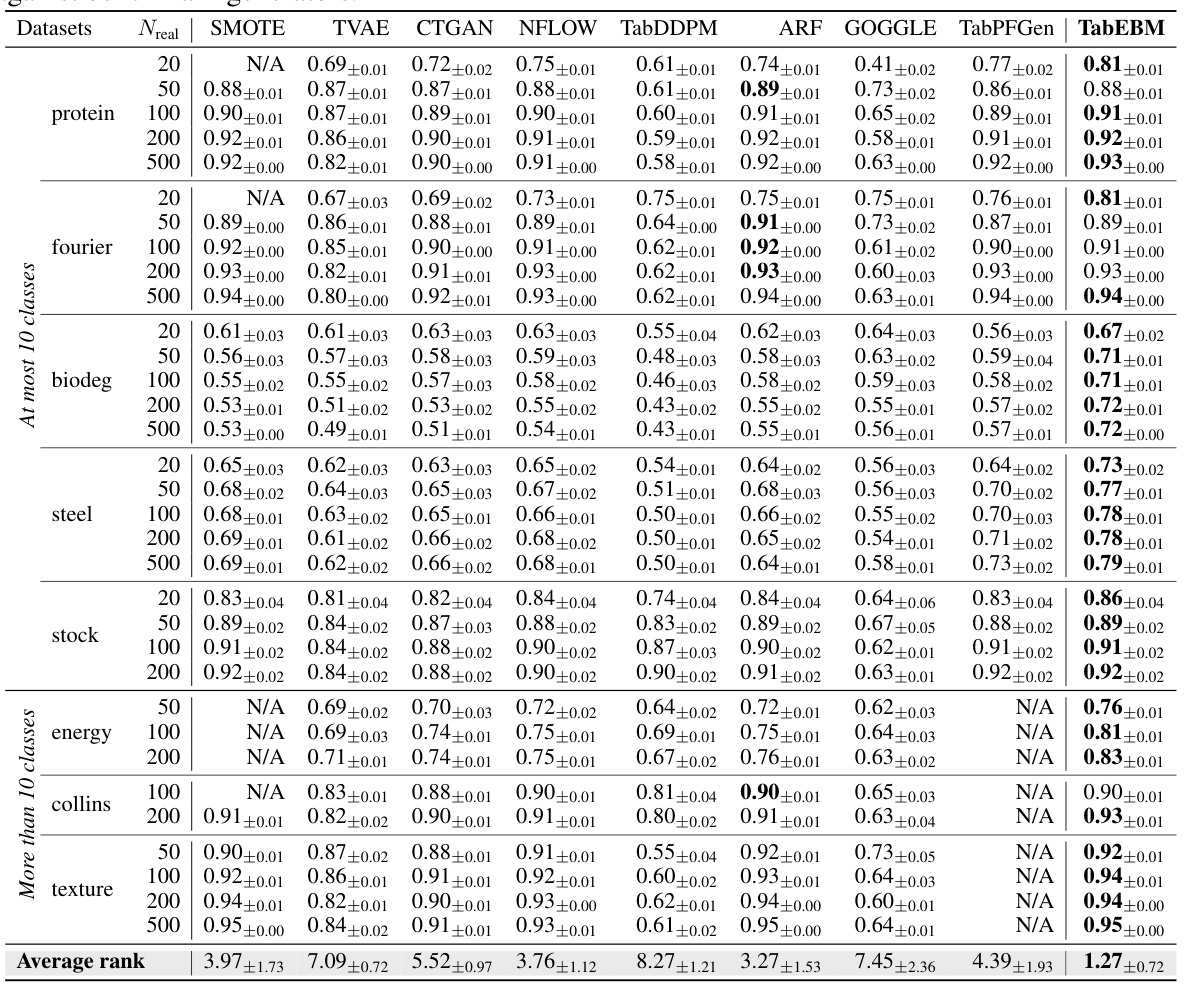
🔼 This table presents the classification accuracy results for eight real-world tabular datasets, comparing different data augmentation methods and the baseline (no augmentation). Six downstream predictors were used. The table shows the mean and standard deviation of the balanced accuracy for each method across different sample sizes (20, 50, 100, 200, 500). The average accuracy rank across all datasets is also provided. Note that N/A values indicate that a method was not applicable for a particular dataset or sample size.
read the caption
Table 1: Classification accuracy (%) aggregated over six downstream predictors, comparing data augmentation on eight real-world tabular datasets with varied real data availability. We report the mean ± std balanced accuracy and average accuracy rank across datasets. A higher rank implies higher accuracy. Note that “N/A” denotes that a specific generator was not applicable or the downstream predictor failed to converge, and the rank is computed with the mean balanced accuracy of other methods. We bold the highest accuracy for each dataset of different sample sizes. TabEBM achieves the best overall performance against Baseline and benchmark generators.

🔼 This table presents the classification accuracy results from six different downstream prediction models using eight different tabular datasets. The results compare the performance of TabEBM against several baseline and benchmark data augmentation techniques. The accuracy is reported as the mean ± standard deviation of the balanced accuracy, and the average rank across datasets is also shown, with a higher rank indicating better performance. The table demonstrates that TabEBM consistently outperforms using real data alone, particularly in datasets with fewer samples.
read the caption
Table 1: Classification accuracy (%) aggregated over six downstream predictors, comparing data augmentation on eight real-world tabular datasets with varied real data availability. We report the mean ± std balanced accuracy and average accuracy rank across datasets. A higher rank implies higher accuracy. Note that “N/A” denotes that a specific generator was not applicable or the downstream predictor failed to converge, and the rank is computed with the mean balanced accuracy of other methods. We bold the highest accuracy for each dataset of different sample sizes. TabEBM consistently outperforms training on real data alone, and achieves the best overall performance against Baseline and benchmark generators.

🔼 This table presents the classification accuracy results for eight real-world tabular datasets using six different downstream predictors. The accuracy is evaluated using data augmentation with various generative models, including TabEBM and several state-of-the-art methods. The table shows the mean and standard deviation of the balanced accuracy and an average accuracy rank across all datasets, providing a comparative analysis of the different methods’ performance at various sample sizes. The best performing method is highlighted for each dataset and sample size.
read the caption
Table 1: Classification accuracy (%) aggregated over six downstream predictors, comparing data augmentation on eight real-world tabular datasets with varied real data availability. We report the mean ± std balanced accuracy and average accuracy rank across datasets. A higher rank implies higher accuracy. Note that “N/A” denotes that a specific generator was not applicable or the downstream predictor failed to converge, and the rank is computed with the mean balanced accuracy of other methods. We bold the highest accuracy for each dataset of different sample sizes. TabEBM achieves the best overall performance against Baseline and benchmark generators.
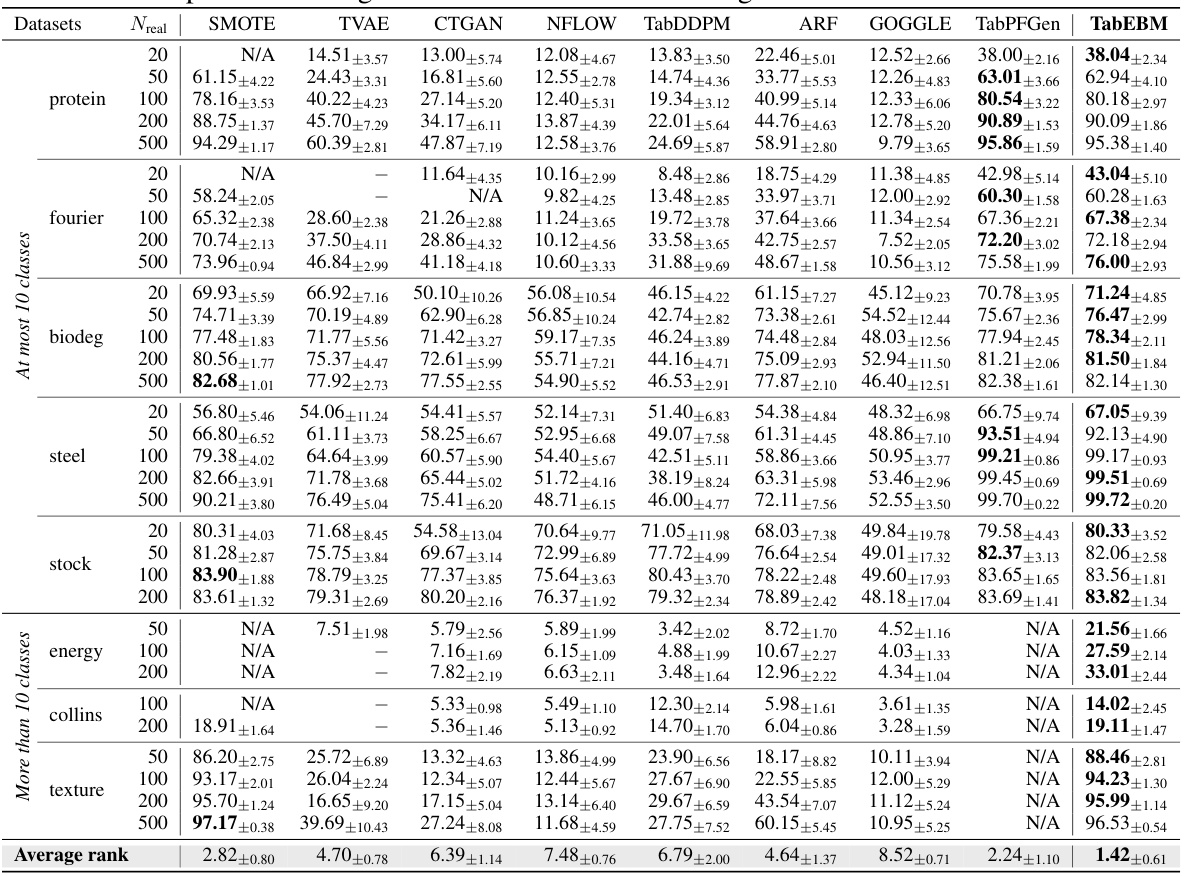
🔼 This table presents the classification accuracy results for eight datasets using six different downstream predictors. The accuracy is calculated using the mean ± standard deviation of the balanced accuracy across multiple runs for different sample sizes (20, 50, 100, 200, 500) and compared across different data augmentation methods (SMOTE, TVAE, CTGAN, NFLOW, TabDDPM, ARF, GOGGLE, TabPFGen, and TabEBM). A higher rank indicates better performance. The table shows TabEBM consistently outperforms other methods, especially with smaller datasets.
read the caption
Table 1: Classification accuracy (%) aggregated over six downstream predictors, comparing data augmentation on eight real-world tabular datasets with varied real data availability. We report the mean ± std balanced accuracy and average accuracy rank across datasets. A higher rank implies higher accuracy. Note that “N/A” denotes that a specific generator was not applicable or the downstream predictor failed to converge, and the rank is computed with the mean balanced accuracy of other methods. We bold the highest accuracy for each dataset of different sample sizes. TabEBM achieves the best overall performance against Baseline and benchmark generators.

🔼 This table presents the classification accuracy results of six different downstream predictors trained using data augmented by eight different tabular data generators on eight datasets. The results are organized by dataset, the number of real data samples used for training, and the method used for data augmentation. The table shows the mean and standard deviation of the balanced accuracy, as well as the average rank across all datasets. A higher rank indicates better performance. TabEBM consistently outperforms the baseline and other benchmark data augmentation methods.
read the caption
Table 1: Classification accuracy (%) aggregated over six downstream predictors, comparing data augmentation on eight real-world tabular datasets with varied real data availability. We report the mean ± std balanced accuracy and average accuracy rank across datasets. A higher rank implies higher accuracy. Note that “N/A” denotes that a specific generator was not applicable or the downstream predictor failed to converge, and the rank is computed with the mean balanced accuracy of other methods. We bold the highest accuracy for each dataset of different sample sizes. TabEBM achieves the best overall performance against Baseline and benchmark generators.

🔼 This table presents the classification accuracy results for different data augmentation methods on eight tabular datasets. The accuracy is averaged across six different downstream prediction models. The table shows the mean and standard deviation of the balanced accuracy for each method and dataset, along with the average rank of each method across all datasets. A higher rank indicates better performance. The table also highlights that TabEBM consistently outperforms the baseline (no data augmentation) and other methods.
read the caption
Table 1: Classification accuracy (%) aggregated over six downstream predictors, comparing data augmentation on eight real-world tabular datasets with varied real data availability. We report the mean ± std balanced accuracy and average accuracy rank across datasets. A higher rank implies higher accuracy. Note that “N/A” denotes that a specific generator was not applicable or the downstream predictor failed to converge, and the rank is computed with the mean balanced accuracy of other methods. We bold the highest accuracy for each dataset of different sample sizes. TabEBM achieves the best overall performance against Baseline and benchmark generators.

🔼 This table presents the classification accuracy results of six different downstream predictors (Logistic Regression, KNN, MLP, Random Forest, XGBoost, and TabPFN) when applied to eight real-world tabular datasets after data augmentation with nine different methods (Baseline, SMOTE, TVAE, CTGAN, NFLOW, TabDDPM, ARF, GOGGLE, TabPFGen, TabEBM). The table shows the mean and standard deviation of the balanced accuracy for each method and dataset, with different sizes of real training data (Nreal) used for augmentation. A higher rank indicates better performance. It highlights TabEBM’s consistent outperformance across various dataset sizes and the Baseline.
read the caption
Table 1: Classification accuracy (%) aggregated over six downstream predictors, comparing data augmentation on eight real-world tabular datasets with varied real data availability. We report the mean ± std balanced accuracy and average accuracy rank across datasets. A higher rank implies higher accuracy. Note that “N/A” denotes that a specific generator was not applicable or the downstream predictor failed to converge, and the rank is computed with the mean balanced accuracy of other methods. We bold the highest accuracy for each dataset of different sample sizes. TabEBM achieves the best overall performance against Baseline and benchmark generators.

🔼 This table presents the results of comparing TabEBM’s performance to eight other tabular data generation methods across various sample sizes and eight datasets. The table shows the mean and standard deviation of the balanced accuracy for each method, as well as the average rank of each method across the datasets. A higher rank indicates better performance. The table highlights TabEBM’s consistent superior performance.
read the caption
Table 1: Classification accuracy (%) aggregated over six downstream predictors, comparing data augmentation on eight real-world tabular datasets with varied real data availability. We report the mean ± std balanced accuracy and average accuracy rank across datasets. A higher rank implies higher accuracy. Note that “N/A” denotes that a specific generator was not applicable or the downstream predictor failed to converge, and the rank is computed with the mean balanced accuracy of other methods. We bold the highest accuracy for each dataset of different sample sizes. TabEBM achieves the best overall performance against Baseline and benchmark generators.
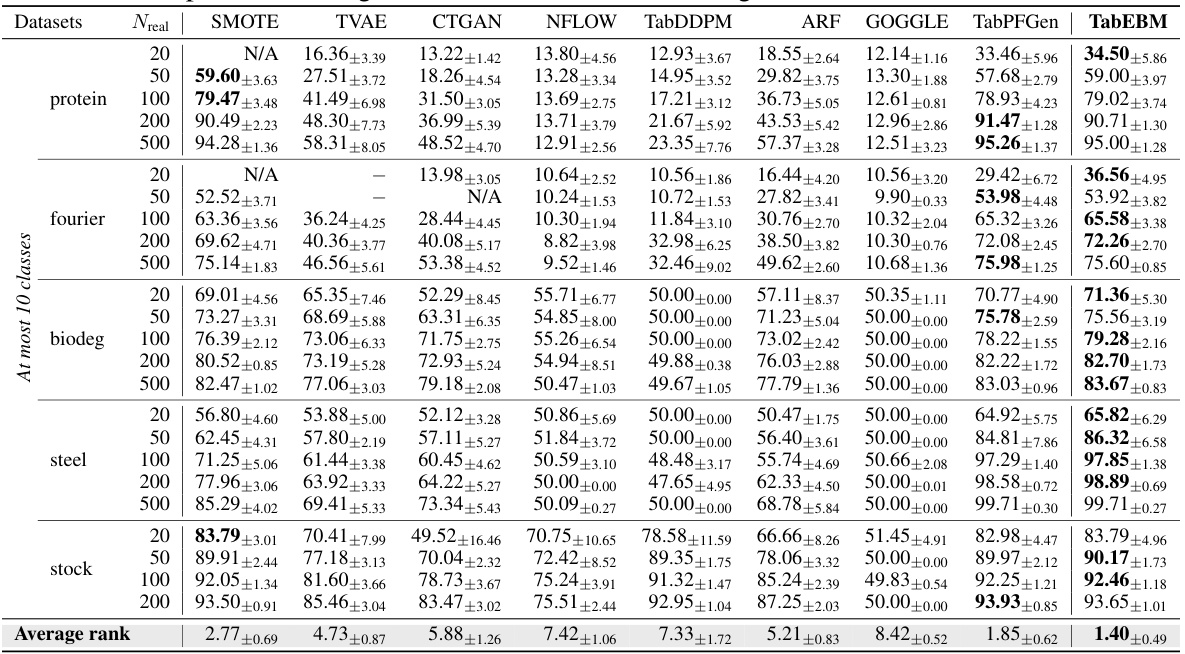
🔼 This table presents the classification accuracy results from six different downstream predictors using eight real-world tabular datasets. The results compare the performance of data augmentation using TabEBM against eight other data generation methods and a baseline (no augmentation). Accuracy is measured using mean ± std balanced accuracy and average rank. The table shows TabEBM’s consistent superior performance compared to the other methods and the baseline, especially in low sample size scenarios.
read the caption
Table 1: Classification accuracy (%) aggregated over six downstream predictors, comparing data augmentation on eight real-world tabular datasets with varied real data availability. We report the mean ± std balanced accuracy and average accuracy rank across datasets. A higher rank implies higher accuracy. Note that “N/A” denotes that a specific generator was not applicable or the downstream predictor failed to converge, and the rank is computed with the mean balanced accuracy of other methods. We bold the highest accuracy for each dataset of different sample sizes. Our method, TabEBM, consistently outperforms training on real data alone, and achieves the best overall performance against Baseline and benchmark generators.

🔼 This table presents the classification accuracy results of six different downstream predictors (LR, KNN, MLP, RF, XGBoost, TabPFN) across eight real-world tabular datasets. The accuracy is calculated using both real data and synthetic data generated by TabEBM and other methods (SMOTE, TVAE, CTGAN, NFLOW, TabDDPM, ARF, GOGGLE, TabPFGen). The table compares the performance of different data augmentation techniques using mean ± std balanced accuracy and average rank across datasets. A higher rank indicates better performance. N/A indicates that a specific generator was not applicable or the predictor failed to converge. The best performing method for each dataset and sample size is highlighted in bold.
read the caption
Table 1: Classification accuracy (%) aggregated over six downstream predictors, comparing data augmentation on eight real-world tabular datasets with varied real data availability. We report the mean ± std balanced accuracy and average accuracy rank across datasets. A higher rank implies higher accuracy. Note that “N/A” denotes that a specific generator was not applicable or the downstream predictor failed to converge, and the rank is computed with the mean balanced accuracy of other methods. We bold the highest accuracy for each dataset of different sample sizes. TabEBM achieves the best overall performance against Baseline and benchmark generators.
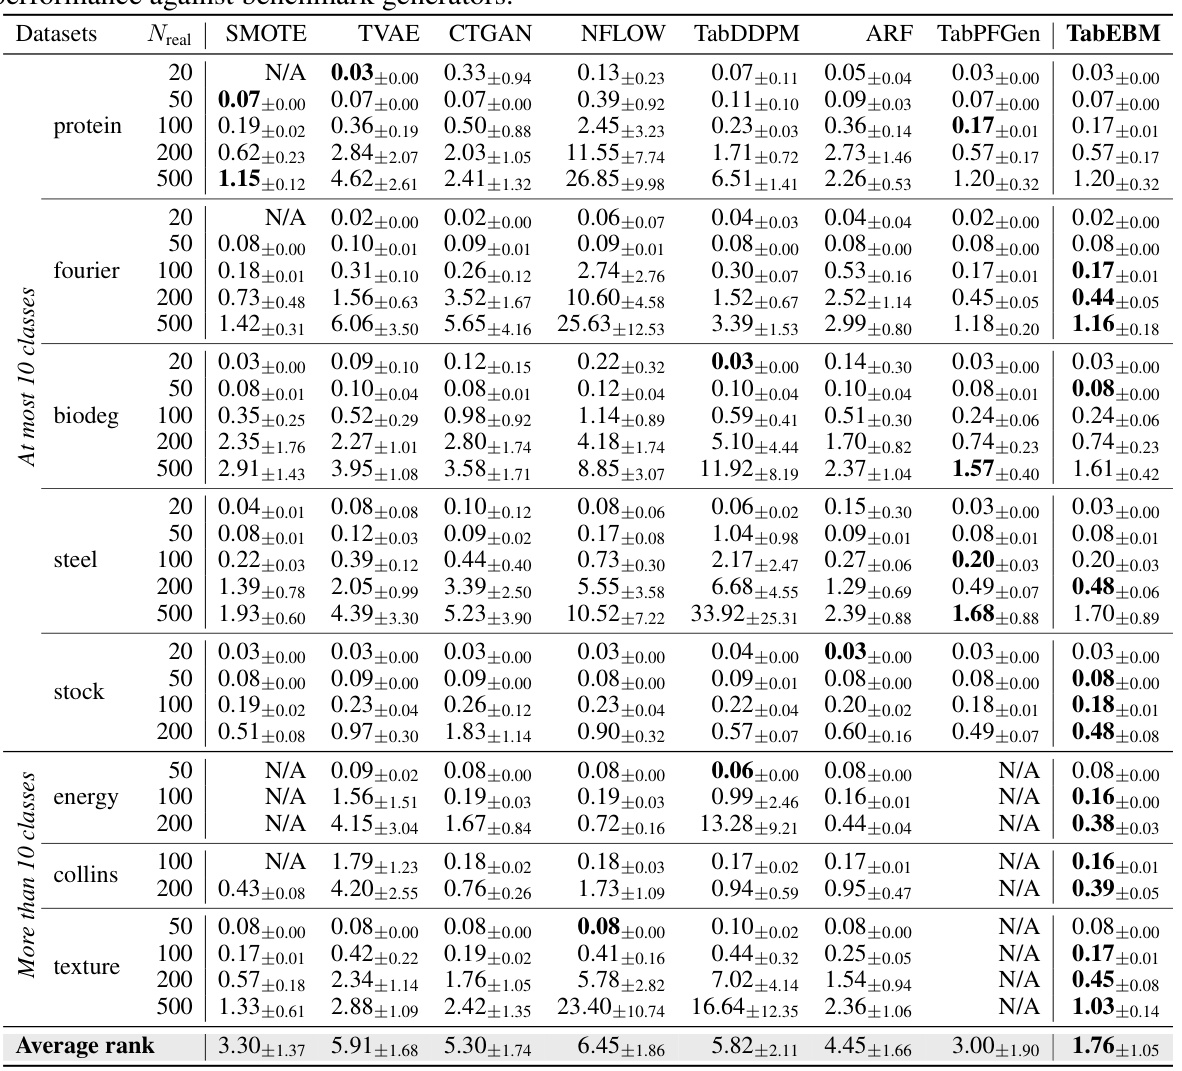
🔼 This table presents the classification accuracy results for eight real-world tabular datasets, comparing different data augmentation methods. Six different downstream predictors were used to evaluate the performance of each method with varying amounts of real training data. The table reports mean and standard deviation of the balanced accuracy for each method and dataset size, along with the average accuracy rank. TabEBM consistently outperforms the baseline (no data augmentation) and other state-of-the-art methods.
read the caption
Table 1: Classification accuracy (%) aggregated over six downstream predictors, comparing data augmentation on eight real-world tabular datasets with varied real data availability. We report the mean ± std balanced accuracy and average accuracy rank across datasets. A higher rank implies higher accuracy. Note that “N/A” denotes that a specific generator was not applicable or the downstream predictor failed to converge, and the rank is computed with the mean balanced accuracy of other methods. We bold the highest accuracy for each dataset of different sample sizes. TabEBM consistently outperforms training on real data alone, and achieves the best overall performance against Baseline and benchmark generators.
Full paper#


