TL;DR#
Online learning algorithms are efficient for high-dimensional streaming data but sensitive to outliers, impacting final accuracy. Existing solutions like using hold-out sets for model selection are often computationally expensive or memory-intensive. This limits real-world applicability, particularly for ‘any-time’ applications where solutions need to be ready immediately.
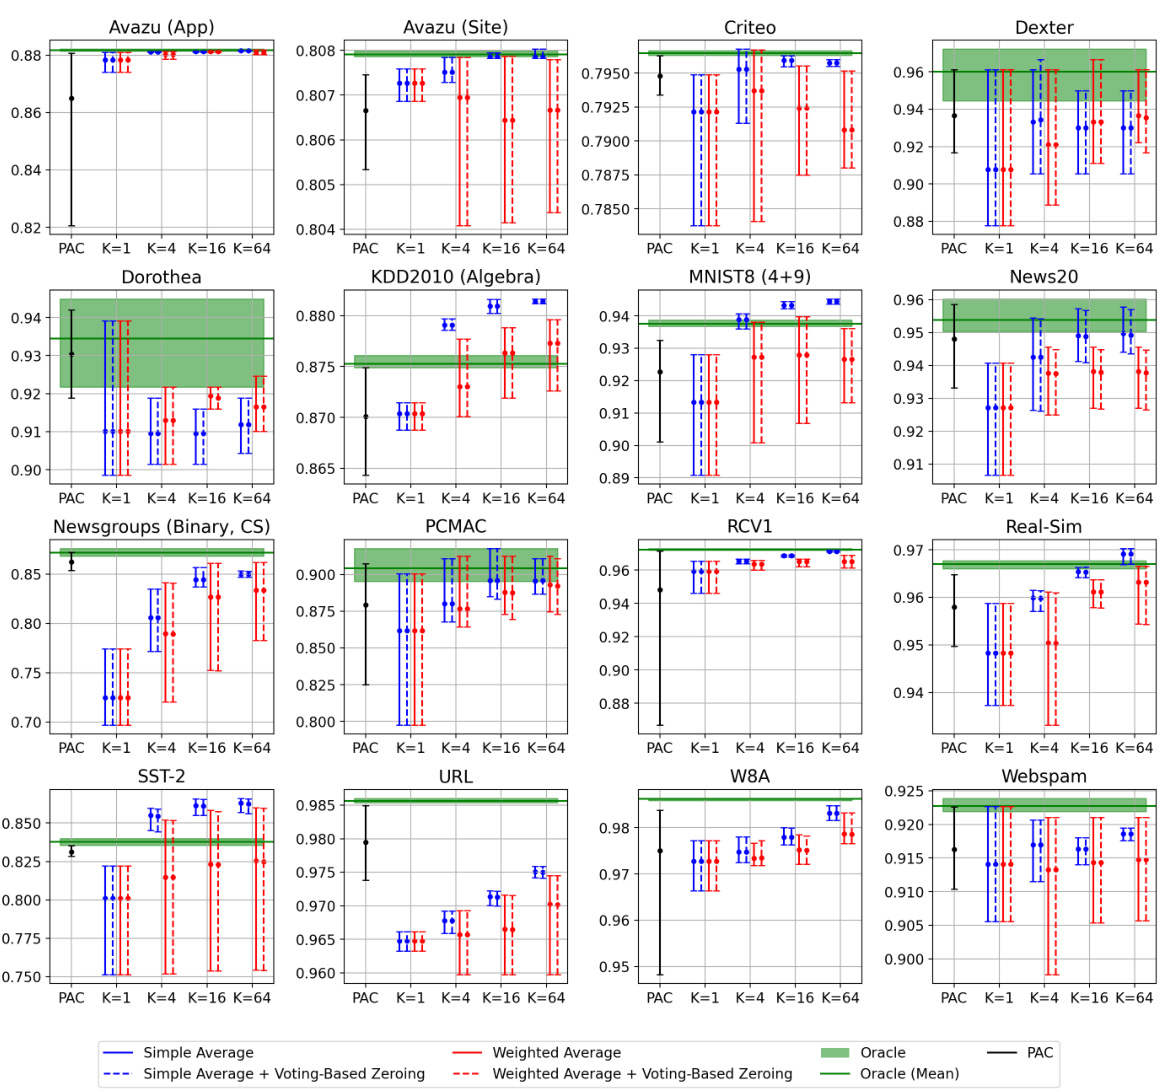
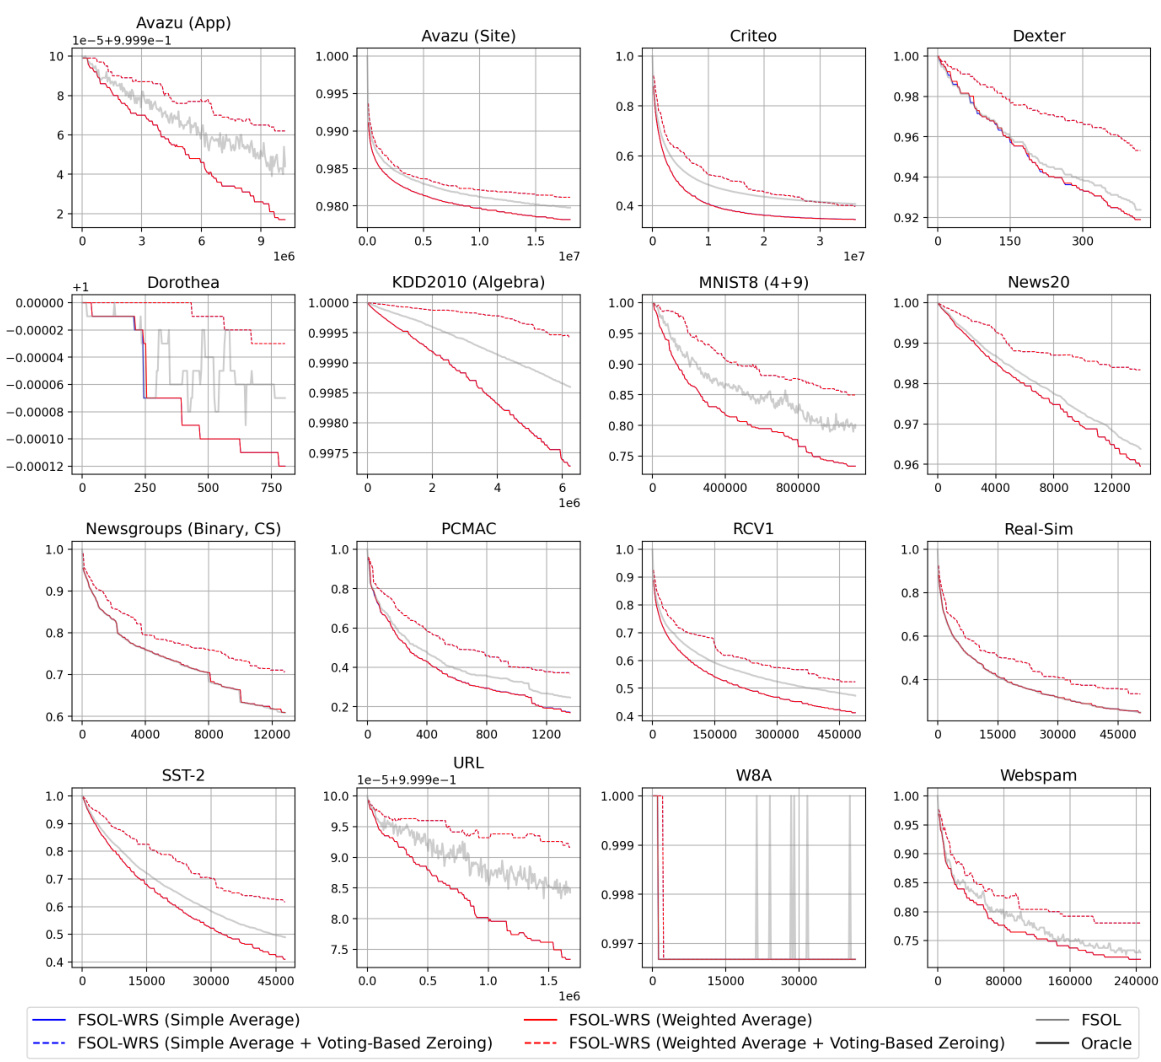
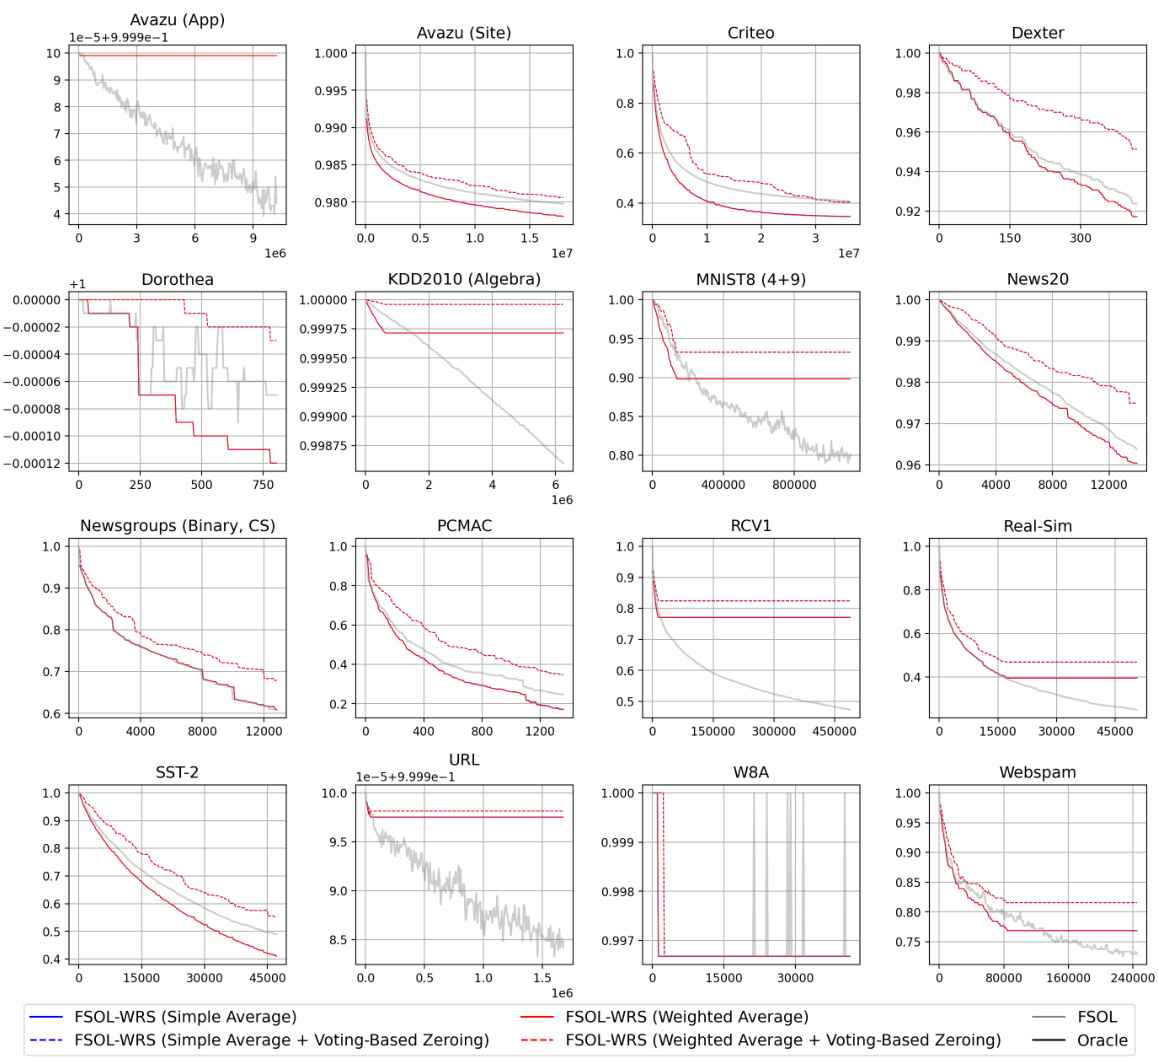
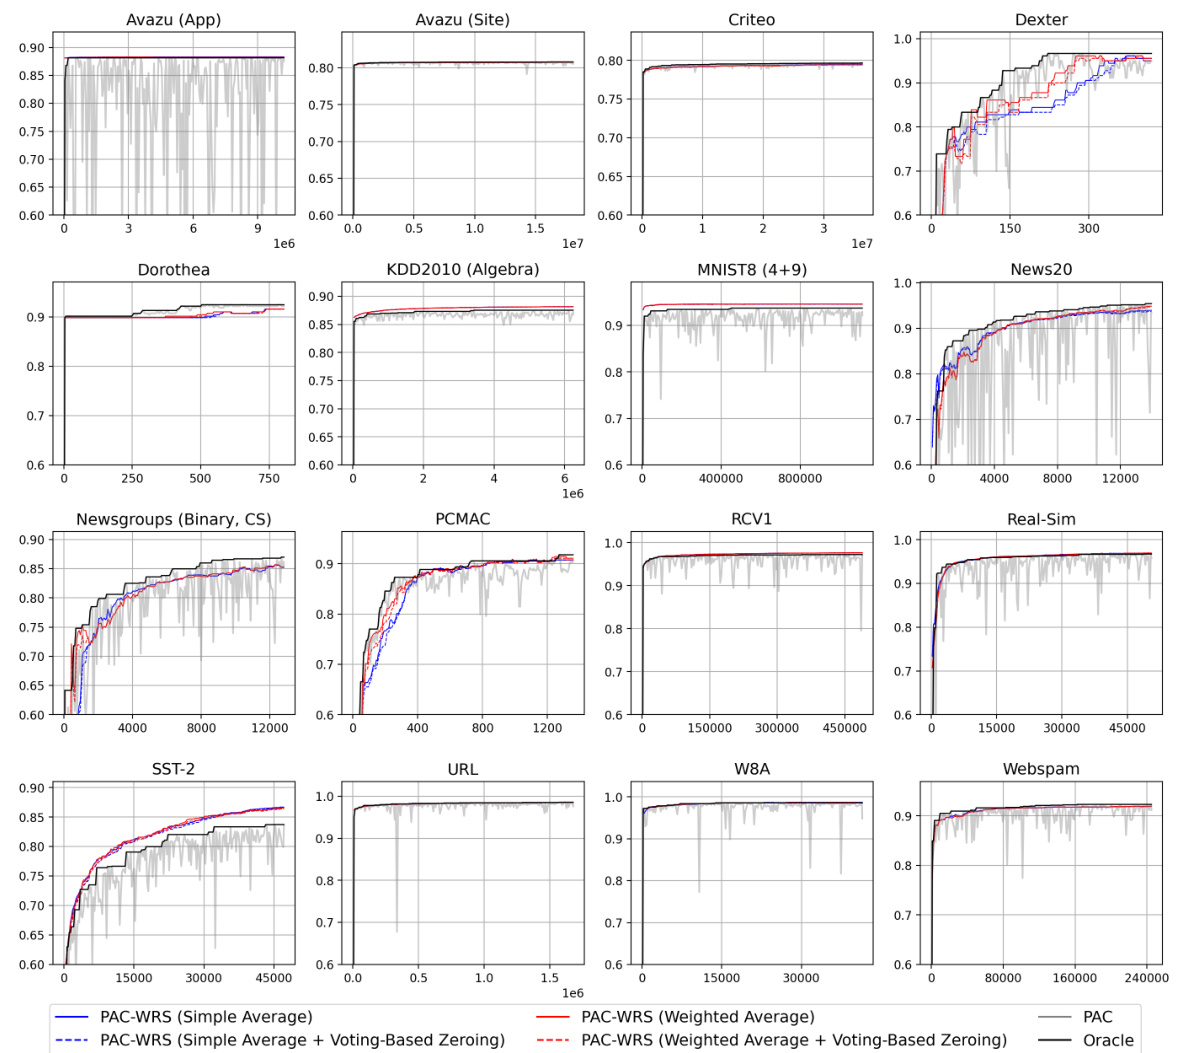
The paper introduces Weighted Reservoir Sampling-Augmented Training (WAT). WAT uses a reservoir to store previous intermediate model weights, weighted by their survival time (number of passive rounds). This approach provides a stable ensemble model without extra data passes or significant memory overhead. Experiments show WAT consistently and significantly outperforms standard online learning approaches on various datasets, demonstrating robustness and bounded risk.
Key Takeaways#
Why does it matter?#
This paper is crucial for researchers working with high-volume streaming data and online learning algorithms. It offers a novel, efficient solution to enhance the stability and accuracy of online learning models, directly addressing a major practical limitation, and offering theoretical guarantees. This opens avenues for improving various applications, particularly in domains with noisy or outlier-prone data.
Visual Insights#

🔼 This figure showcases the effectiveness of Weighted Reservoir Sampling (WRS) in stabilizing online learning algorithms. It compares the test accuracy of standard Passive-Aggressive Classifier (PAC) and First-Order Sparse Online Learning (FSOL) against their WRS-enhanced versions (PAC-WRS and FSOL-WRS) on two datasets (Avazu App and News20). The light grey lines represent the fluctuating test accuracy of the baseline methods, while the solid black lines show the ‘oracle’ accuracy (the best accuracy achieved at any given timestep). The solid blue lines demonstrate the stable and improved accuracy of the WRS-enhanced models. This highlights the ability of WRS to mitigate the sensitivity of online learning algorithms to outliers and produce more stable, high-performing models.
read the caption
Figure 1: Test accuracies (y-axis) over timestep (x-axis) for PAC-WRS and FSOL-WRS on Avazu (App) and News20. Light grey lines: test accuracies of the baseline methods PAC or FSOL - at each timestep. Solid black lines: test accuracies of the 'oracle' models, computed as the cumulative maximum of the baselines. Solid blue lines: test accuracies of WRS-enhanced models. Note massive fluctuations of grey lines and stability of blue lines. All variants shown are using standard sampling weights for WRS, with simple-averaging.

🔼 This table presents the characteristics of the 16 datasets used in the paper’s numerical experiments. For each dataset, it lists the dimensionality (D), the total number of instances (N), the number of training instances (Ntrain), the number of test instances (Ntest), and the dataset sparsity (proportion of zero entries in the feature vectors). This information is crucial for understanding the scale and nature of the data used to evaluate the proposed method and its performance compared to baseline methods.
read the caption
Table 1: Sizes, dimensions, and sparsities of all datasets used for numerical experiments.
In-depth insights#
PA Instability Issue#
Passive-Aggressive (PA) algorithms, while effective for online learning, suffer from instability. Their rapid adaptation to individual errors, a strength in theory, makes them vulnerable to outliers. A single outlier can cause the algorithm to drastically over-correct, leading to significant fluctuations in accuracy and potentially poor performance on unseen data. This is particularly problematic with streaming data where outliers may appear late in the sequence, irrevocably affecting the final model. The issue stems from the aggressive nature of PA updates, where corrections aren’t tempered enough to handle noisy observations. Addressing this instability is crucial for reliable performance in real-world applications where data is often noisy and high-volume. The paper addresses this instability by proposing a weighted reservoir sampling approach that mitigates the impact of outliers and produces more stable, generalizable models.
WRS Ensemble#
A WRS (Weighted Reservoir Sampling) ensemble method, as implied by the title, leverages the strengths of weighted reservoir sampling to create a stable and robust ensemble of online learning models. The core idea is that the quality of an online learner’s solution is reflected in its passive duration, meaning error-free periods indicate superior solutions. By weighting solutions based on their passive duration, the WRS algorithm effectively selects a diverse set of high-performing models, mitigating the effect of outliers and achieving improved stability. The ensemble is formed without requiring additional passes through the data or significant memory overhead, making it highly efficient for large-scale online learning tasks. This approach is particularly beneficial for applications where noisy data or outliers are prevalent, like streaming data or malware detection, as the ensemble’s stability leads to improved generalization and robustness compared to traditional online learning alone. The effectiveness of the WRS ensemble is further enhanced by exploring various weighting and averaging schemes, allowing for tailored performance optimization depending on specific dataset characteristics. The theoretical analysis demonstrates that the risk of the WRS ensemble is bounded by the regret of the underlying online learner, providing theoretical justification for the method’s effectiveness. Overall, WRS ensembles represent a significant advancement in online learning by addressing the instability often associated with high-dimensional data streams.
WAT Algorithm#
The paper introduces a novel algorithm called WAT (WRS-Augmented Training) designed to stabilize online learning algorithms, particularly those of the passive-aggressive type like PAC and FSOL. WAT’s core innovation is the integration of weighted reservoir sampling (WRS), which dynamically maintains a reservoir of past solutions. Unlike traditional ensemble methods, WAT doesn’t require extra passes through data or memory-intensive storage of all intermediate solutions. Instead, it leverages the insight that solutions with high accuracy tend to remain error-free for more iterations, assigning higher weights to longer-surviving solutions within the reservoir. This approach mitigates the issue of over-correction due to outliers, which is particularly relevant in streaming datasets where outliers can severely impact the final model’s accuracy. The paper provides theoretical analysis, establishing risk bounds for WAT, demonstrating that its risk is related to the regret of the underlying online learning algorithm. Empirically, WAT consistently outperforms the base online learners across various benchmarks, showcasing its ability to enhance both accuracy and stability.
Theoretical Bounds#
The theoretical bounds section of a research paper is crucial for establishing the validity and generalizability of the proposed method. It provides a mathematical guarantee on the algorithm’s performance, often expressed in terms of regret or risk bounds. A strong theoretical foundation increases confidence in the algorithm’s ability to generalize to unseen data. The analysis typically involves assumptions about the data distribution (e.g., i.i.d., boundedness), the loss function used, and the learning algorithm itself. The tightness of the bounds reflects the quality of the analysis. Loose bounds, while still valuable, might indicate limitations of the theoretical framework or the need for further investigation. Robust bounds that consider various scenarios, such as noisy or adversarial data, significantly enhance the trustworthiness of the results. A detailed proof of the theoretical bounds is necessary, using established mathematical tools or developing novel techniques as needed. The section should clearly articulate any assumptions, limitations, and their potential implications on the practical applicability of the results.
Future Works#
The research paper’s ‘Future Works’ section could explore several promising avenues. Extending the weighted reservoir sampling (WRS) approach to non-passive-aggressive online learning algorithms is crucial. The current adaptation shows promise, but a more robust and generalized framework is needed. Investigating the impact of non-i.i.d. data streams on the WRS-Augmented Training method would be highly valuable, as real-world data often deviates from the i.i.d. assumption. This would involve developing strategies to adapt the model’s reservoir dynamically. Conducting more in-depth theoretical analysis is another important step, such as refining the risk bounds to improve their tightness and exploring the method’s convergence properties under more relaxed assumptions. Exploring different weighting schemes and their impact on the ensemble’s performance is another interesting direction. Finally, applying the method to different applications is necessary to demonstrate its broader effectiveness. Specifically, exploring its applicability in high-stakes settings, where stability is critical, would provide substantial value.
More visual insights#
More on figures

🔼 This figure visualizes the effectiveness of Weighted Reservoir Sampling (WRS) in stabilizing online learning algorithms. It shows test accuracy over time for Passive-Aggressive Classifier (PAC) and First-Order Sparse Online Learning (FSOL), with and without WRS. The light grey lines represent the fluctuating accuracy of the standard PAC and FSOL, while the solid blue lines showcase the significantly improved stability achieved by incorporating WRS. The black lines indicate an ‘oracle’ model, representing the best possible accuracy at each timestep. The results demonstrate that WRS produces consistently high accuracy, even outperforming the oracle.
read the caption
Figure 1: Test accuracies (y-axis) over timestep (x-axis) for PAC-WRS and FSOL-WRS on Avazu (App) and News20. Light grey lines: test accuracies of the baseline methods PAC or FSOL - at each timestep. Solid black lines: test accuracies of the 'oracle' models, computed as the cumulative maximum of the baselines. Solid blue lines: test accuracies of WRS-enhanced models. Note massive fluctuations of grey lines and stability of blue lines. All variants shown are using standard sampling weights for WRS, with simple-averaging.

🔼 This figure shows the test accuracy over time for four different online learning methods: PAC, FSOL, PAC-WRS, and FSOL-WRS. The light grey lines represent the accuracy of the baseline methods (PAC and FSOL) at each timestep, which fluctuate significantly. The solid black lines show the accuracy of ‘oracle’ models, which always choose the best performing model at each timestep. The blue lines display the accuracy of the models incorporating the weighted reservoir sampling technique (WRS). As shown in the figure, the WRS-enhanced models (blue lines) demonstrate significantly more stable accuracy than the baseline methods, highlighting the effectiveness of WRS in stabilizing online learning algorithms.
read the caption
Figure 1: Test accuracies (y-axis) over timestep (x-axis) for PAC-WRS and FSOL-WRS on Avazu (App) and News20. Light grey lines: test accuracies of the baseline methods PAC or FSOL - at each timestep. Solid black lines: test accuracies of the 'oracle' models, computed as the cumulative maximum of the baselines. Solid blue lines: test accuracies of WRS-enhanced models. Note massive fluctuations of grey lines and stability of blue lines. All variants shown are using standard sampling weights for WRS, with simple-averaging.

🔼 This figure compares the test accuracy of the Passive-Aggressive Classifier (PAC) and First-Order Sparse Online Learning (FSOL) algorithms with and without the proposed Weighted Reservoir Sampling (WRS) method. The light grey lines show the test accuracy at each timestep for the baseline algorithms (PAC and FSOL). The solid black lines represent the ‘oracle’ accuracy, which is the cumulative maximum accuracy of the baseline methods. The solid blue lines show the test accuracy of the algorithms enhanced with the WRS method. The figure highlights the significant stability improvement achieved by WRS, especially when compared to the fluctuating performance of the baseline methods.
read the caption
Figure 1: Test accuracies (y-axis) over timestep (x-axis) for PAC-WRS and FSOL-WRS on Avazu (App) and News20. Light grey lines: test accuracies of the baseline methods PAC or FSOL - at each timestep. Solid black lines: test accuracies of the 'oracle' models, computed as the cumulative maximum of the baselines. Solid blue lines: test accuracies of WRS-enhanced models. Note massive fluctuations of grey lines and stability of blue lines. All variants shown are using standard sampling weights for WRS, with simple-averaging.

🔼 This figure displays the test accuracy of the Passive-Aggressive Classifier (PAC) and First-Order Sparse Online Learning (FSOL) algorithms, both with and without the Weighted Reservoir Sampling (WRS) enhancement, on the Avazu app and News20 datasets. The light grey lines show the test accuracy at each timestep for the baseline algorithms. The solid black lines represent the ‘oracle’ model, which at each timestep reflects the best performance achieved so far by the baseline models. The solid blue lines display the test accuracy of the WRS-enhanced models. The key observation is the significant fluctuation in test accuracy for the baseline methods (grey lines) compared to the stability of the WRS-enhanced models (blue lines). This illustrates the stabilizing effect of WRS.
read the caption
Figure 1: Test accuracies (y-axis) over timestep (x-axis) for PAC-WRS and FSOL-WRS on Avazu (App) and News20. Light grey lines: test accuracies of the baseline methods PAC or FSOL - at each timestep. Solid black lines: test accuracies of the 'oracle' models, computed as the cumulative maximum of the baselines. Solid blue lines: test accuracies of WRS-enhanced models. Note massive fluctuations of grey lines and stability of blue lines. All variants shown are using standard sampling weights for WRS, with simple-averaging.

🔼 This figure compares the performance of the Passive-Aggressive Classifier (PAC) and First-Order Sparse Online Learning (FSOL) algorithms with and without the proposed Weighted Reservoir Sampling (WRS) method. It shows test accuracy plotted against timestep for the Avazu (App) and News20 datasets. The light grey lines represent the baseline algorithms (PAC and FSOL), highlighting their significant fluctuations in accuracy. The solid black lines represent an ‘oracle’ model that always selects the best accuracy up to that timestep, while the solid blue lines show the performance of the algorithms augmented with the WRS method. The figure clearly illustrates how the WRS method stabilizes the accuracy of the online learning algorithms, making them less sensitive to noisy observations.
read the caption
Figure 1: Test accuracies (y-axis) over timestep (x-axis) for PAC-WRS and FSOL-WRS on Avazu (App) and News20. Light grey lines: test accuracies of the baseline methods PAC or FSOL - at each timestep. Solid black lines: test accuracies of the 'oracle' models, computed as the cumulative maximum of the baselines. Solid blue lines: test accuracies of WRS-enhanced models. Note massive fluctuations of grey lines and stability of blue lines. All variants shown are using standard sampling weights for WRS, with simple-averaging.

🔼 This figure shows the test accuracy over time for the Passive-Aggressive Classifier (PAC) and First-Order Sparse Online Learning (FSOL) algorithms, both with and without the Weighted Reservoir Sampling (WRS) enhancement. The light grey lines represent the accuracy of the standard PAC and FSOL algorithms, which fluctuate significantly due to sensitivity to outliers. The solid black lines show an ‘oracle’ model, representing the best accuracy at each timestep. The solid blue lines illustrate the WRS-enhanced models (PAC-WRS and FSOL-WRS), which are significantly more stable, demonstrating the effectiveness of the proposed method in mitigating the impact of noisy data.
read the caption
Figure 1: Test accuracies (y-axis) over timestep (x-axis) for PAC-WRS and FSOL-WRS on Avazu (App) and News20. Light grey lines: test accuracies of the baseline methods PAC or FSOL - at each timestep. Solid black lines: test accuracies of the 'oracle' models, computed as the cumulative maximum of the baselines. Solid blue lines: test accuracies of WRS-enhanced models. Note massive fluctuations of grey lines and stability of blue lines. All variants shown are using standard sampling weights for WRS, with simple-averaging.

🔼 This figure shows the test accuracy over time for the Passive-Aggressive Classifier (PAC) and First-Order Sparse Online Learning (FSOL) algorithms, both with and without the proposed Weighted Reservoir Sampling (WRS) method. The light grey lines represent the accuracy of the standard PAC and FSOL algorithms, showing significant fluctuations. The solid black lines represent an ‘oracle’ model, which always picks the best accuracy achieved up to that point in time. The solid blue lines represent the accuracy of the algorithms using WRS, demonstrating a much more stable performance. The figure highlights the effectiveness of WRS in stabilizing the online learning process.
read the caption
Figure 1: Test accuracies (y-axis) over timestep (x-axis) for PAC-WRS and FSOL-WRS on Avazu (App) and News20. Light grey lines: test accuracies of the baseline methods PAC or FSOL - at each timestep. Solid black lines: test accuracies of the 'oracle' models, computed as the cumulative maximum of the baselines. Solid blue lines: test accuracies of WRS-enhanced models. Note massive fluctuations of grey lines and stability of blue lines. All variants shown are using standard sampling weights for WRS, with simple-averaging.

🔼 This figure compares the performance of the Passive-Aggressive Classifier (PAC) and First-Order Sparse Online Learning (FSOL) algorithms with and without the proposed Weighted Reservoir Sampling (WRS) approach on two datasets: Avazu (App) and News20. The light grey lines show the fluctuating test accuracies of the original PAC and FSOL algorithms over time. The solid black lines represent the ‘oracle’ accuracy, which is the highest accuracy achieved up to each time point. The blue lines depict the results obtained by incorporating WRS, which demonstrates significantly more stable performance and higher overall accuracy.
read the caption
Figure 1: Test accuracies (y-axis) over timestep (x-axis) for PAC-WRS and FSOL-WRS on Avazu (App) and News20. Light grey lines: test accuracies of the baseline methods PAC or FSOL - at each timestep. Solid black lines: test accuracies of the 'oracle' models, computed as the cumulative maximum of the baselines. Solid blue lines: test accuracies of WRS-enhanced models. Note massive fluctuations of grey lines and stability of blue lines. All variants shown are using standard sampling weights for WRS, with simple-averaging.

🔼 This figure shows the test accuracy over time for Passive-Aggressive Classifier (PAC) and First-Order Sparse Online Learning (FSOL) with and without Weighted Reservoir Sampling (WRS). It demonstrates the effectiveness of WRS in stabilizing the performance of online learning algorithms. The light grey lines represent the fluctuating test accuracy of the standard PAC and FSOL algorithms, while the solid black lines show the ‘oracle’ accuracy (the best accuracy achieved at each timestep). The solid blue lines represent the accuracy of the algorithms enhanced with WRS, highlighting their improved stability and performance compared to the baselines.
read the caption
Figure 1: Test accuracies (y-axis) over timestep (x-axis) for PAC-WRS and FSOL-WRS on Avazu (App) and News20. Light grey lines: test accuracies of the baseline methods PAC or FSOL - at each timestep. Solid black lines: test accuracies of the 'oracle' models, computed as the cumulative maximum of the baselines. Solid blue lines: test accuracies of WRS-enhanced models. Note massive fluctuations of grey lines and stability of blue lines. All variants shown are using standard sampling weights for WRS, with simple-averaging.

🔼 This figure compares the performance of the standard Passive-Aggressive Classifier (PAC) and First-Order Sparse Online Learning (FSOL) with their weighted reservoir sampling (WRS) augmented versions (PAC-WRS and FSOL-WRS) on two datasets: Avazu (App) and News20. The light grey lines represent the test accuracies of the baseline methods at each timestep. The solid black lines show the ‘oracle’ accuracies, representing the cumulative maximum accuracy achieved by the baselines. The solid blue lines depict the accuracies of the WRS-enhanced models. The figure highlights the significantly reduced fluctuation and improved stability of the WRS models compared to the baselines.
read the caption
Figure 1: Test accuracies (y-axis) over timestep (x-axis) for PAC-WRS and FSOL-WRS on Avazu (App) and News20. Light grey lines: test accuracies of the baseline methods PAC or FSOL - at each timestep. Solid black lines: test accuracies of the 'oracle' models, computed as the cumulative maximum of the baselines. Solid blue lines: test accuracies of WRS-enhanced models. Note massive fluctuations of grey lines and stability of blue lines. All variants shown are using standard sampling weights for WRS, with simple-averaging.

🔼 This figure shows the test accuracy over time for the Passive-Aggressive Classifier (PAC) and First-Order Sparse Online Learning (FSOL) algorithms, both with and without the Weighted Reservoir Sampling (WRS) enhancement. The light grey lines represent the baseline algorithms’ accuracy at each time step, demonstrating significant fluctuations. The solid black lines show the ‘oracle’ accuracy (the highest accuracy achieved up to that point in time), highlighting the potential performance. The solid blue lines display the WRS-enhanced models’ performance, which remains significantly more stable, showcasing the effectiveness of WRS in mitigating accuracy fluctuations. All WRS models use standard sampling weights and simple averaging.
read the caption
Figure 1: Test accuracies (y-axis) over timestep (x-axis) for PAC-WRS and FSOL-WRS on Avazu (App) and News20. Light grey lines: test accuracies of the baseline methods PAC or FSOL - at each timestep. Solid black lines: test accuracies of the 'oracle' models, computed as the cumulative maximum of the baselines. Solid blue lines: test accuracies of WRS-enhanced models. Note massive fluctuations of grey lines and stability of blue lines. All variants shown are using standard sampling weights for WRS, with simple-averaging.

🔼 This figure shows the test accuracy over time for the Passive-Aggressive Classifier (PAC) and First-Order Sparse Online Learning (FSOL) algorithms, both with and without the Weighted Reservoir Sampling (WRS) enhancement. The light grey lines represent the accuracy of the standard PAC and FSOL algorithms, which fluctuate significantly. The solid black lines represent the ‘oracle’ accuracy, representing the highest accuracy achieved at each timestep. The solid blue lines show the accuracy of the WRS-enhanced versions (PAC-WRS and FSOL-WRS), which remain much more stable over time. This illustrates the effectiveness of the WRS method in stabilizing the performance of online learning algorithms.
read the caption
Figure 1: Test accuracies (y-axis) over timestep (x-axis) for PAC-WRS and FSOL-WRS on Avazu (App) and News20. Light grey lines: test accuracies of the baseline methods PAC or FSOL - at each timestep. Solid black lines: test accuracies of the 'oracle' models, computed as the cumulative maximum of the baselines. Solid blue lines: test accuracies of WRS-enhanced models. Note massive fluctuations of grey lines and stability of blue lines. All variants shown are using standard sampling weights for WRS, with simple-averaging.

🔼 This figure shows the test accuracy over time for the Passive-Aggressive Classifier (PAC) and First-Order Sparse Online Learning (FSOL) algorithms, both with and without the Weighted Reservoir Sampling (WRS) enhancement. The light grey lines represent the baseline algorithms’ accuracy at each time step, demonstrating significant fluctuations. The solid black lines show the ‘oracle’ accuracy (the highest accuracy achieved up to that point), and the solid blue lines represent the WRS-enhanced algorithms. The figure highlights the increased stability provided by WRS.
read the caption
Figure 1: Test accuracies (y-axis) over timestep (x-axis) for PAC-WRS and FSOL-WRS on Avazu (App) and News20. Light grey lines: test accuracies of the baseline methods PAC or FSOL - at each timestep. Solid black lines: test accuracies of the 'oracle' models, computed as the cumulative maximum of the baselines. Solid blue lines: test accuracies of WRS-enhanced models. Note massive fluctuations of grey lines and stability of blue lines. All variants shown are using standard sampling weights for WRS, with simple-averaging.

🔼 This figure shows the test accuracies of the Passive-Aggressive Classifier (PAC) and First-Order Sparse Online Learning (FSOL) algorithms, both with and without the Weighted Reservoir Sampling (WRS) enhancement, on the Avazu (App) and News20 datasets. The light grey lines represent the test accuracy of the original PAC and FSOL algorithms at each time step. The solid black lines show the ‘oracle’ accuracy, which is the cumulative maximum accuracy achieved by the baseline algorithms at each time step. The solid blue lines illustrate the test accuracy of the WRS-enhanced algorithms (PAC-WRS and FSOL-WRS). The figure highlights that the original algorithms show significant fluctuations in accuracy over time, whereas the WRS-enhanced versions exhibit much more stable accuracy, consistently outperforming the baseline methods and even the oracle in some cases.
read the caption
Figure 1: Test accuracies (y-axis) over timestep (x-axis) for PAC-WRS and FSOL-WRS on Avazu (App) and News20. Light grey lines: test accuracies of the baseline methods PAC or FSOL - at each timestep. Solid black lines: test accuracies of the 'oracle' models, computed as the cumulative maximum of the baselines. Solid blue lines: test accuracies of WRS-enhanced models. Note massive fluctuations of grey lines and stability of blue lines. All variants shown are using standard sampling weights for WRS, with simple-averaging.

🔼 This figure shows the test accuracy over time for the Passive-Aggressive Classifier (PAC) and First-Order Sparse Online Learning (FSOL) algorithms, both with and without the Weighted Reservoir Sampling (WRS) enhancement. The light grey lines represent the baseline algorithms’ accuracy at each timestep, demonstrating significant fluctuations. The solid black lines represent the ‘oracle’ accuracy (the best accuracy achieved up to each timestep), and the solid blue lines show the WRS-enhanced algorithms’ accuracy. The figure highlights how WRS stabilizes the accuracy, significantly reducing the fluctuations compared to the baseline algorithms.
read the caption
Figure 1: Test accuracies (y-axis) over timestep (x-axis) for PAC-WRS and FSOL-WRS on Avazu (App) and News20. Light grey lines: test accuracies of the baseline methods PAC or FSOL - at each timestep. Solid black lines: test accuracies of the 'oracle' models, computed as the cumulative maximum of the baselines. Solid blue lines: test accuracies of WRS-enhanced models. Note massive fluctuations of grey lines and stability of blue lines. All variants shown are using standard sampling weights for WRS, with simple-averaging.
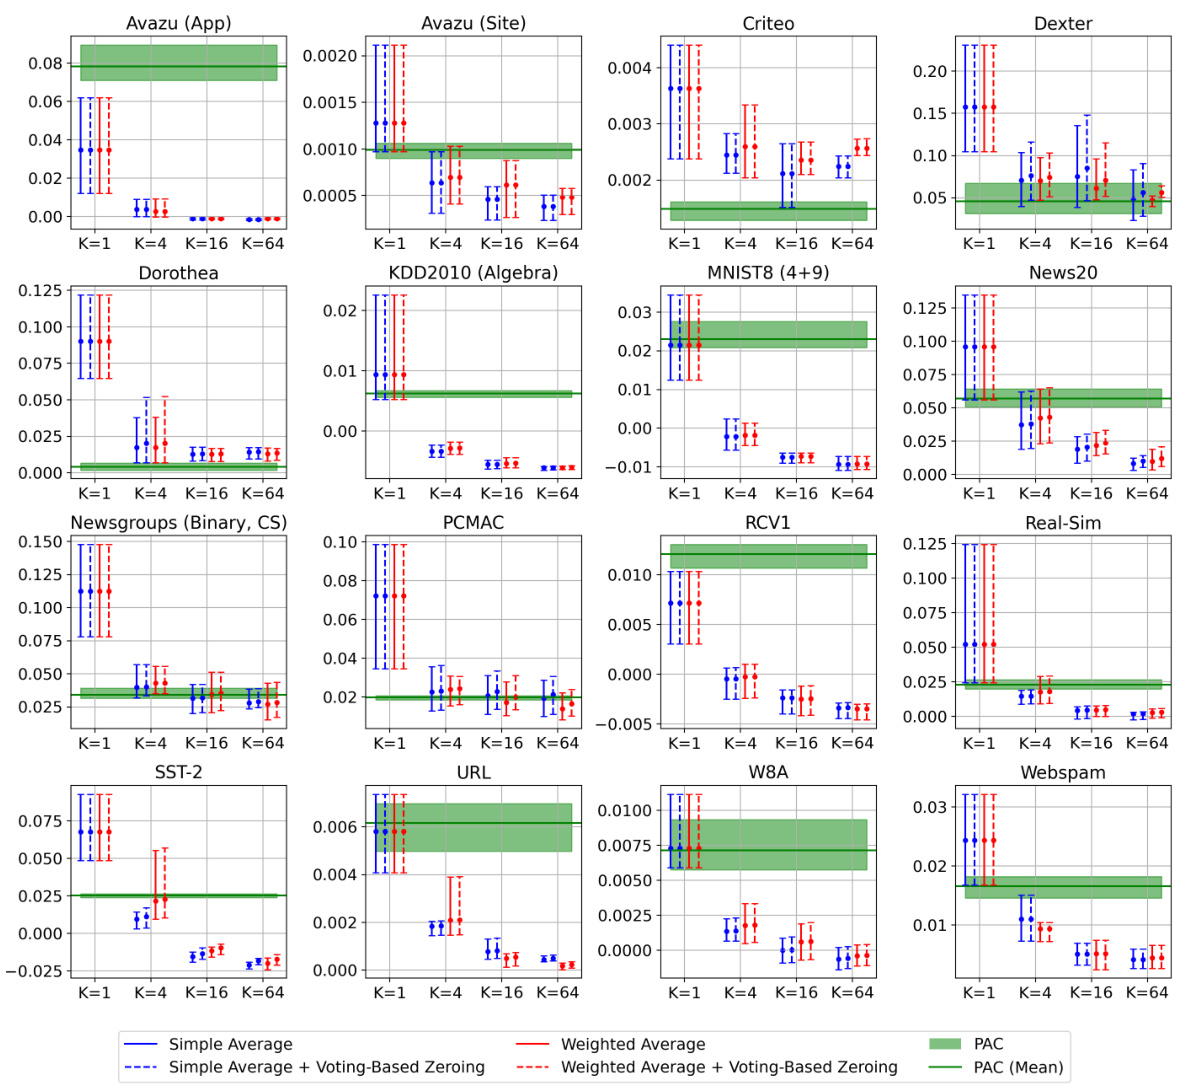
🔼 This figure compares the test accuracy over time for four models: PAC, FSOL, PAC-WRS, and FSOL-WRS on two datasets: Avazu (App) and News20. Light grey lines show the test accuracy of the original PAC and FSOL models at each timestep. The solid black lines represent an ‘oracle’ model which is the cumulative maximum accuracy at any given point in the dataset. Finally, the solid blue lines illustrate the accuracy of the PAC-WRS and FSOL-WRS models at each timestep. The figure clearly illustrates that the WRS models have far more stable accuracy over time than the original models. The significant fluctuations in the baseline model’s accuracy highlight the need for stable solutions proposed in the paper.
read the caption
Figure 1: Test accuracies (y-axis) over timestep (x-axis) for PAC-WRS and FSOL-WRS on Avazu (App) and News20. Light grey lines: test accuracies of the baseline methods PAC or FSOL - at each timestep. Solid black lines: test accuracies of the 'oracle' models, computed as the cumulative maximum of the baselines. Solid blue lines: test accuracies of WRS-enhanced models. Note massive fluctuations of grey lines and stability of blue lines. All variants shown are using standard sampling weights for WRS, with simple-averaging.
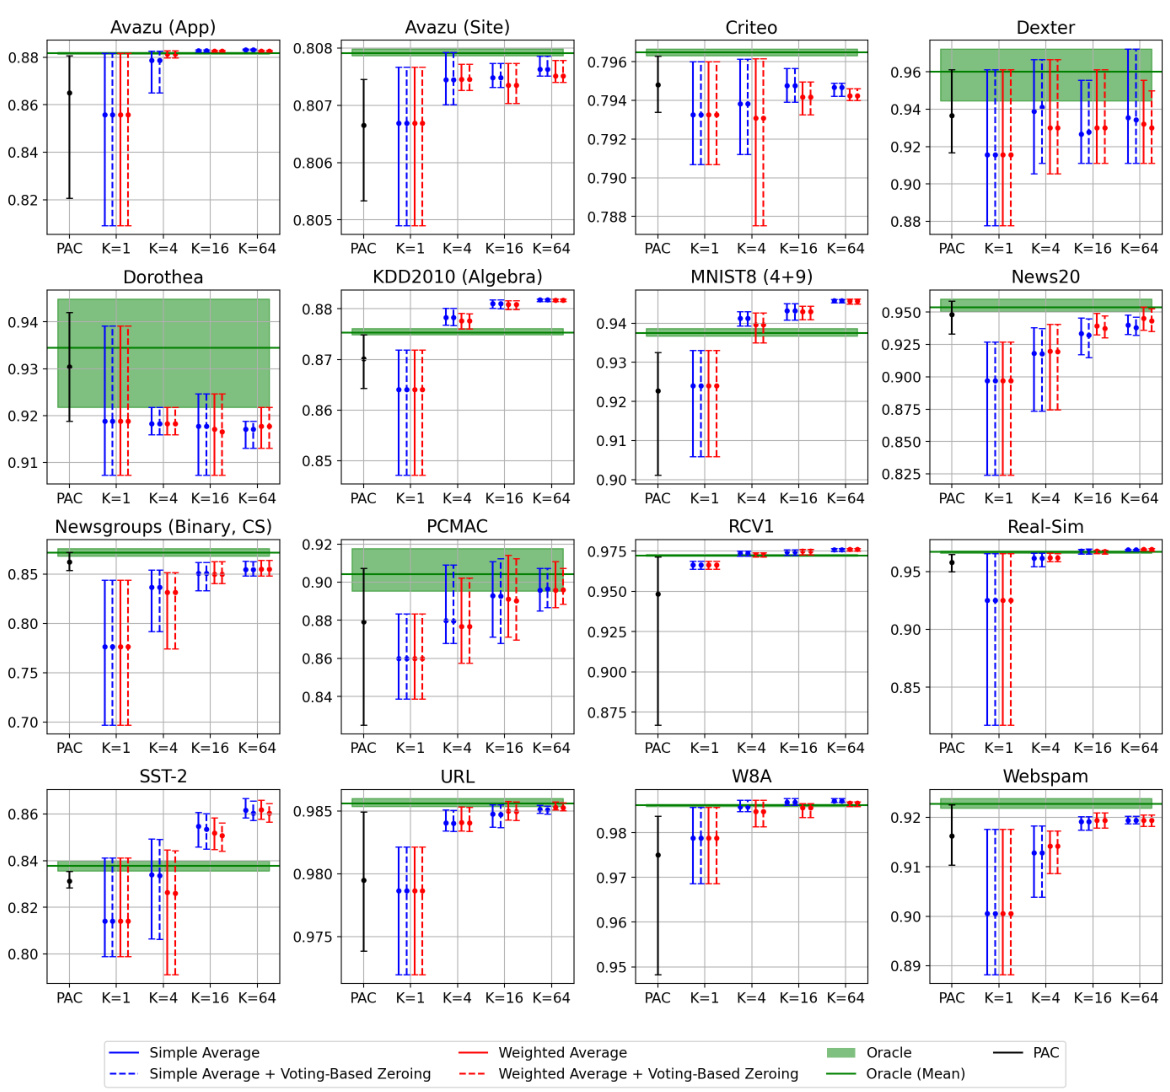
🔼 This figure shows the test accuracy over time for the Passive-Aggressive Classifier (PAC) and First-Order Sparse Online Learning (FSOL) algorithms, both with and without the proposed Weighted Reservoir Sampling (WRS) method. The light grey lines represent the accuracy of the standard PAC and FSOL at each timestep. The solid black lines show the ‘oracle’ accuracy, which is the highest accuracy achieved up to that point. The solid blue lines are the accuracy of the algorithms using the WRS method. The figure demonstrates that the WRS method significantly reduces the fluctuations in test accuracy and improves the overall stability of the algorithms.
read the caption
Figure 1: Test accuracies (y-axis) over timestep (x-axis) for PAC-WRS and FSOL-WRS on Avazu (App) and News20. Light grey lines: test accuracies of the baseline methods PAC or FSOL - at each timestep. Solid black lines: test accuracies of the 'oracle' models, computed as the cumulative maximum of the baselines. Solid blue lines: test accuracies of WRS-enhanced models. Note massive fluctuations of grey lines and stability of blue lines. All variants shown are using standard sampling weights for WRS, with simple-averaging.
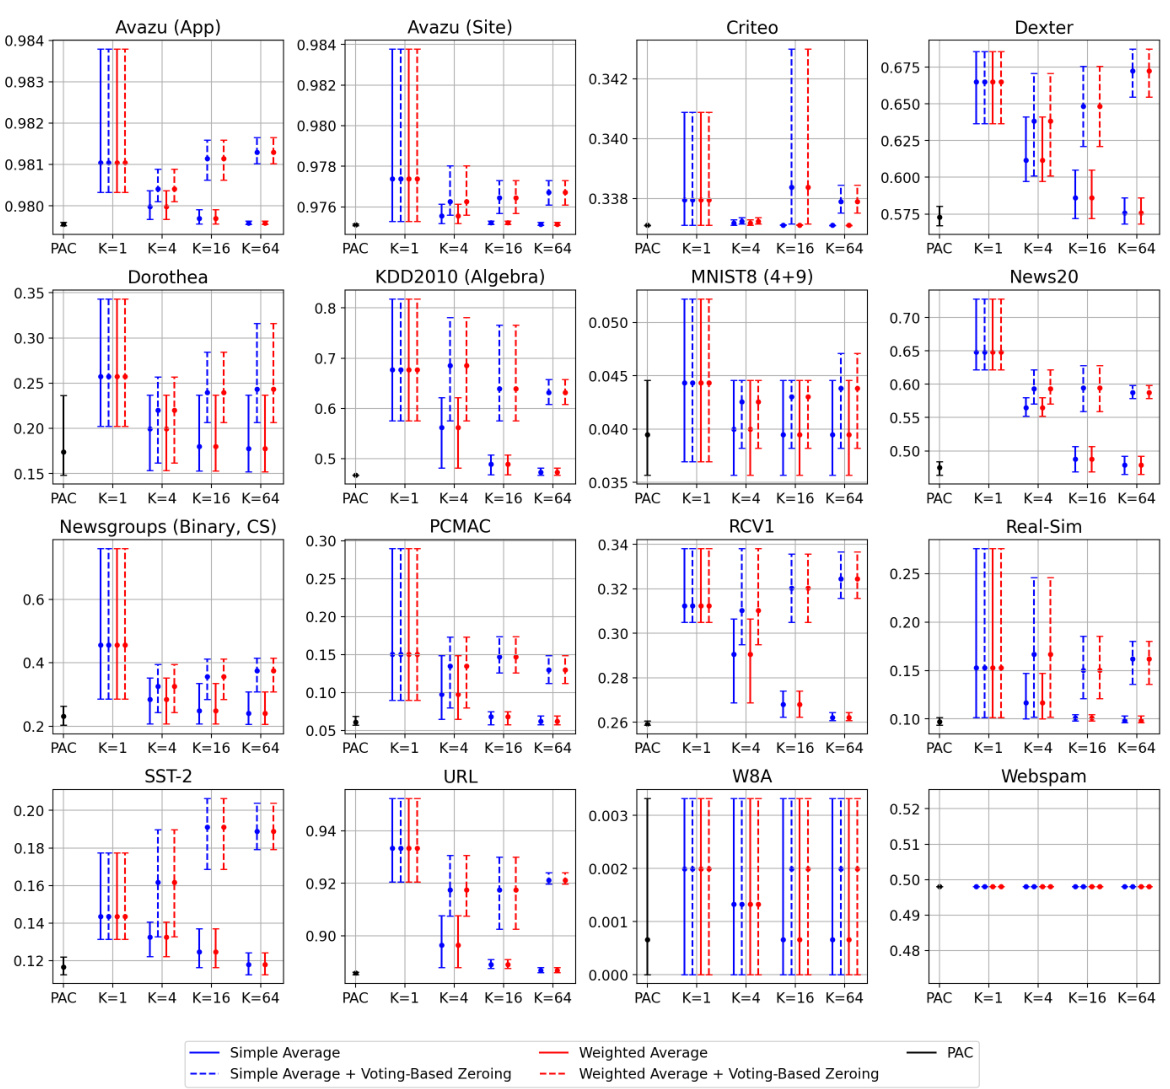
🔼 This figure compares the test accuracies of the standard Passive-Aggressive Classifier (PAC) and First-Order Sparse Online Learning (FSOL) algorithms to their enhanced versions using Weighted Reservoir Sampling (WRS) on two datasets: Avazu (App) and News20. The light grey lines represent the test accuracy of the standard algorithms at each timestep, while the solid black lines show the ‘oracle’ accuracy, which is the cumulative maximum accuracy achieved by the standard algorithms. The solid blue lines represent the test accuracy of the WRS-enhanced algorithms. The figure highlights that the WRS-enhanced algorithms exhibit significantly more stable accuracy over time compared to the standard algorithms, demonstrating the effectiveness of the WRS approach in stabilizing online learning methods.
read the caption
Figure 1: Test accuracies (y-axis) over timestep (x-axis) for PAC-WRS and FSOL-WRS on Avazu (App) and News20. Light grey lines: test accuracies of the baseline methods PAC or FSOL - at each timestep. Solid black lines: test accuracies of the 'oracle' models, computed as the cumulative maximum of the baselines. Solid blue lines: test accuracies of WRS-enhanced models. Note massive fluctuations of grey lines and stability of blue lines. All variants shown are using standard sampling weights for WRS, with simple-averaging.
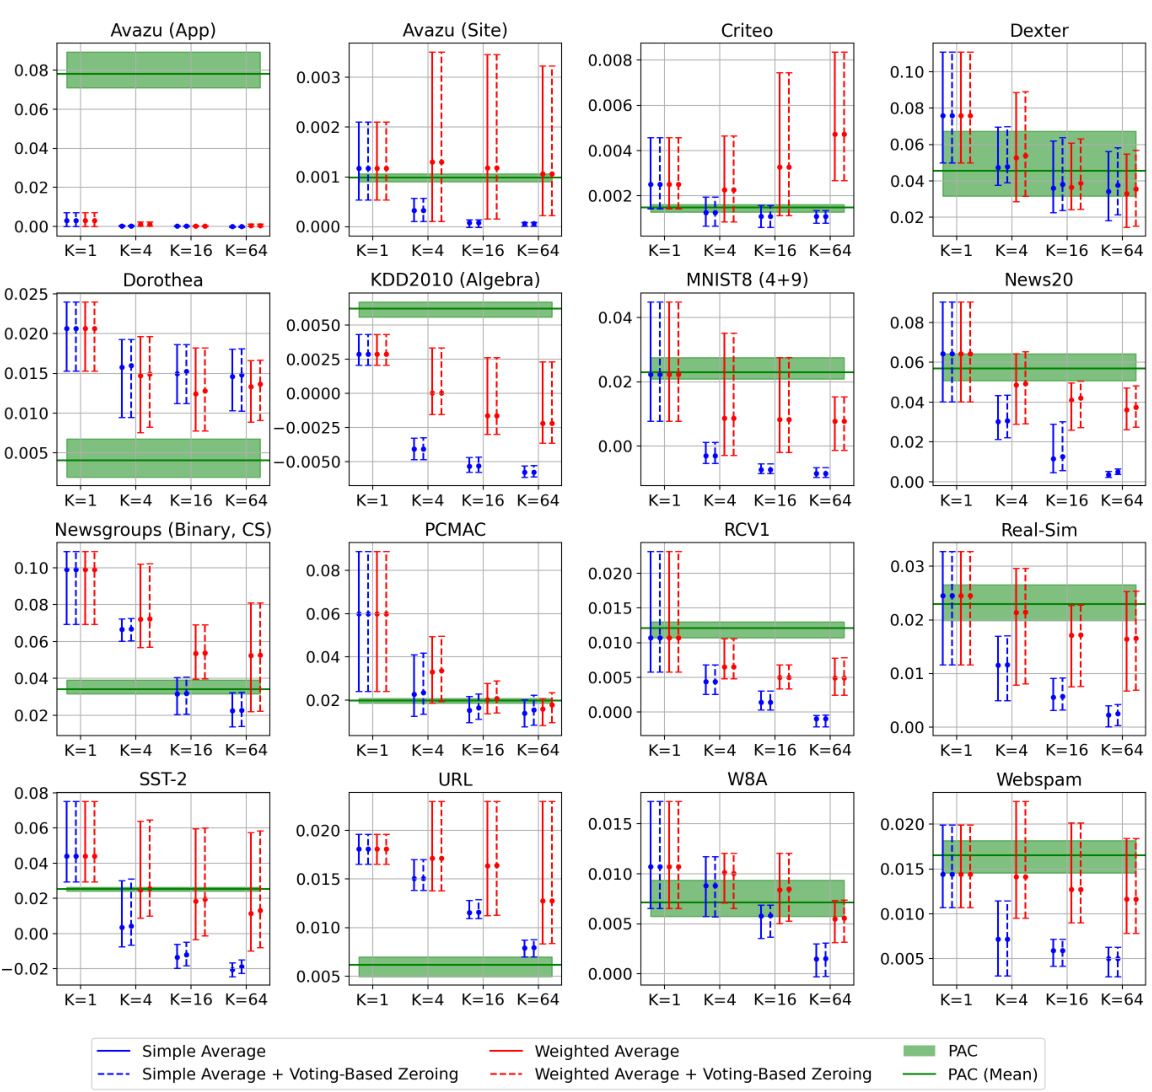
🔼 This figure shows the test accuracies over time for Passive-Aggressive Classifier (PAC) and First-Order Sparse Online Learning (FSOL) with and without the proposed Weighted Reservoir Sampling (WRS) method. It demonstrates the effectiveness of WRS in stabilizing the performance of online learning algorithms by reducing the fluctuations caused by outliers in the data stream. The figure highlights the instability of the baseline methods (PAC and FSOL) compared to the stability of the WRS-enhanced models (PAC-WRS and FSOL-WRS), showcasing the significant improvement achieved by incorporating WRS.
read the caption
Figure 1: Test accuracies (y-axis) over timestep (x-axis) for PAC-WRS and FSOL-WRS on Avazu (App) and News20. Light grey lines: test accuracies of the baseline methods PAC or FSOL - at each timestep. Solid black lines: test accuracies of the 'oracle' models, computed as the cumulative maximum of the baselines. Solid blue lines: test accuracies of WRS-enhanced models. Note massive fluctuations of grey lines and stability of blue lines. All variants shown are using standard sampling weights for WRS, with simple-averaging.
🔼 This figure shows the test accuracies of Passive-Aggressive Classifier (PAC) and First-Order Sparse Online Learning (FSOL) with and without Weighted Reservoir Sampling (WRS) on Avazu (App) and News20 datasets over time. The light grey lines represent the baseline methods’ fluctuating accuracies. The solid black lines represent the ‘oracle’ models, which are the cumulative maximum accuracies of the baseline methods at each timestep. The solid blue lines show the much more stable accuracies of the WRS-enhanced models. This illustrates how WRS stabilizes online learning algorithms against outliers and improves their overall performance.
read the caption
Figure 1: Test accuracies (y-axis) over timestep (x-axis) for PAC-WRS and FSOL-WRS on Avazu (App) and News20. Light grey lines: test accuracies of the baseline methods PAC or FSOL - at each timestep. Solid black lines: test accuracies of the 'oracle' models, computed as the cumulative maximum of the baselines. Solid blue lines: test accuracies of WRS-enhanced models. Note massive fluctuations of grey lines and stability of blue lines. All variants shown are using standard sampling weights for WRS, with simple-averaging.

🔼 This figure shows the test accuracy over time for the Passive-Aggressive Classifier (PAC) and First-Order Sparse Online Learning (FSOL) algorithms, both with and without the proposed Weighted Reservoir Sampling (WRS) method. The light grey lines represent the accuracy of the standard PAC/FSOL at each timestep, demonstrating significant fluctuations. The solid black lines show the ‘oracle’ accuracy, representing the best accuracy achieved at each time step, which is unattainable in practice. The solid blue lines show the performance of the WRS-enhanced algorithms, highlighting their superior stability and consistent performance compared to the baseline methods.
read the caption
Figure 1: Test accuracies (y-axis) over timestep (x-axis) for PAC-WRS and FSOL-WRS on Avazu (App) and News20. Light grey lines: test accuracies of the baseline methods PAC or FSOL - at each timestep. Solid black lines: test accuracies of the 'oracle' models, computed as the cumulative maximum of the baselines. Solid blue lines: test accuracies of WRS-enhanced models. Note massive fluctuations of grey lines and stability of blue lines. All variants shown are using standard sampling weights for WRS, with simple-averaging.

🔼 This figure compares the performance of the original Passive-Aggressive Classifier (PAC) and First-Order Sparse Online Learning (FSOL) algorithms against their enhanced versions using Weighted Reservoir Sampling (WRS) on two datasets: Avazu (App) and News20. The light grey lines show the fluctuating test accuracy of the original algorithms at each time step. The solid black lines represent an ‘oracle’ model, which always chooses the best performing model up to that point in time. The solid blue lines illustrate the significantly improved stability of the WRS-enhanced versions, highlighting the effectiveness of WRS in mitigating accuracy fluctuations and resulting in a more stable model.
read the caption
Figure 1: Test accuracies (y-axis) over timestep (x-axis) for PAC-WRS and FSOL-WRS on Avazu (App) and News20. Light grey lines: test accuracies of the baseline methods PAC or FSOL - at each timestep. Solid black lines: test accuracies of the 'oracle' models, computed as the cumulative maximum of the baselines. Solid blue lines: test accuracies of WRS-enhanced models. Note massive fluctuations of grey lines and stability of blue lines. All variants shown are using standard sampling weights for WRS, with simple-averaging.
🔼 This figure shows the test accuracy of PAC and FSOL, with and without the WRS approach, over time. The light grey lines represent the baseline methods (PAC or FSOL) at each timestep. The solid black lines represent the ‘oracle’ models (the cumulative maximum accuracy of the baseline at each timestep). The solid blue lines represent the WRS enhanced models. The figure highlights that WRS significantly stabilizes the accuracy of the online learning algorithms, reducing the fluctuations observed in the baseline methods, and performing comparably to or better than the ‘oracle’.
read the caption
Figure 1: Test accuracies (y-axis) over timestep (x-axis) for PAC-WRS and FSOL-WRS on Avazu (App) and News20. Light grey lines: test accuracies of the baseline methods PAC or FSOL - at each timestep. Solid black lines: test accuracies of the 'oracle' models, computed as the cumulative maximum of the baselines. Solid blue lines: test accuracies of WRS-enhanced models. Note massive fluctuations of grey lines and stability of blue lines. All variants shown are using standard sampling weights for WRS, with simple-averaging.

🔼 This figure shows the test accuracy over time for Passive-Aggressive Classifier (PAC) and First-Order Sparse Online Learning (FSOL) with and without the proposed Weighted Reservoir Sampling (WRS) method. The light grey lines represent the accuracy of the standard PAC and FSOL at each timestep. The solid black lines show the accuracy of an ‘oracle’ model, which always selects the best performing model up to that point in time. The blue lines illustrate the performance of the WRS enhanced versions. The figure demonstrates that the WRS method significantly improves the stability of the online learning algorithms.
read the caption
Figure 1: Test accuracies (y-axis) over timestep (x-axis) for PAC-WRS and FSOL-WRS on Avazu (App) and News20. Light grey lines: test accuracies of the baseline methods PAC or FSOL - at each timestep. Solid black lines: test accuracies of the 'oracle' models, computed as the cumulative maximum of the baselines. Solid blue lines: test accuracies of WRS-enhanced models. Note massive fluctuations of grey lines and stability of blue lines. All variants shown are using standard sampling weights for WRS, with simple-averaging.
🔼 This figure displays the test accuracy over time for four different online learning algorithms: PAC, FSOL, PAC-WRS, and FSOL-WRS. The light grey lines show the fluctuating accuracy of the standard PAC and FSOL algorithms, while the solid blue lines demonstrate the stable accuracy achieved by the WRS-enhanced versions. The black lines represent an ‘oracle’ model, showing the highest accuracy achieved at each point in time by either the PAC or FSOL method. The figure highlights the improved stability provided by the weighted reservoir sampling technique.
read the caption
Figure 1: Test accuracies (y-axis) over timestep (x-axis) for PAC-WRS and FSOL-WRS on Avazu (App) and News20. Light grey lines: test accuracies of the baseline methods PAC or FSOL - at each timestep. Solid black lines: test accuracies of the 'oracle' models, computed as the cumulative maximum of the baselines. Solid blue lines: test accuracies of WRS-enhanced models. Note massive fluctuations of grey lines and stability of blue lines. All variants shown are using standard sampling weights for WRS, with simple-averaging.
🔼 This figure shows the test accuracies of the Passive-Aggressive Classifier (PAC) and First-Order Sparse Online Learning (FSOL) algorithms, with and without the Weighted Reservoir Sampling (WRS) technique, on the Avazu (App) and News20 datasets. The light grey lines represent the test accuracy at each timestep for the baseline algorithms. The solid black lines show the ‘oracle’ accuracy, representing the highest accuracy achieved at each timestep. The solid blue lines represent the test accuracy of the algorithms enhanced with WRS. The figure highlights the significant improvement in stability offered by WRS, as shown by the smoother blue lines compared to the fluctuating grey lines. This demonstrates that WRS successfully mitigates the sensitivity of online learning algorithms to outliers.
read the caption
Figure 1: Test accuracies (y-axis) over timestep (x-axis) for PAC-WRS and FSOL-WRS on Avazu (App) and News20. Light grey lines: test accuracies of the baseline methods PAC or FSOL - at each timestep. Solid black lines: test accuracies of the 'oracle' models, computed as the cumulative maximum of the baselines. Solid blue lines: test accuracies of WRS-enhanced models. Note massive fluctuations of grey lines and stability of blue lines. All variants shown are using standard sampling weights for WRS, with simple-averaging.
🔼 This figure compares the test accuracies of the Passive-Aggressive Classifier (PAC) and First-Order Sparse Online Learning (FSOL) algorithms, with and without the Weighted Reservoir Sampling (WRS) enhancement, on two datasets: Avazu (App) and News20. The light grey lines show the test accuracy of the standard PAC/FSOL at each timestep. The solid black lines represent an ‘oracle’ that always chooses the best accuracy seen up to that point in time. The blue lines depict the performance of the WRS-enhanced algorithms. The key observation is the significantly reduced fluctuation and improved stability of the WRS enhanced models compared to the baseline methods.
read the caption
Figure 1: Test accuracies (y-axis) over timestep (x-axis) for PAC-WRS and FSOL-WRS on Avazu (App) and News20. Light grey lines: test accuracies of the baseline methods PAC or FSOL - at each timestep. Solid black lines: test accuracies of the 'oracle' models, computed as the cumulative maximum of the baselines. Solid blue lines: test accuracies of WRS-enhanced models. Note massive fluctuations of grey lines and stability of blue lines. All variants shown are using standard sampling weights for WRS, with simple-averaging.

🔼 This figure shows the test accuracy over time for both PAC and FSOL, with and without the proposed WRS method. The grey lines represent the baseline methods (PAC or FSOL), which show significant fluctuations. The black lines represent the oracle model, which is the cumulative maximum accuracy of the baseline method. The blue lines represent the WRS-enhanced models, which show much more stable accuracy over time. The figure highlights the effectiveness of WRS in stabilizing online learning algorithms.
read the caption
Figure 1: Test accuracies (y-axis) over timestep (x-axis) for PAC-WRS and FSOL-WRS on Avazu (App) and News20. Light grey lines: test accuracies of the baseline methods PAC or FSOL - at each timestep. Solid black lines: test accuracies of the 'oracle' models, computed as the cumulative maximum of the baselines. Solid blue lines: test accuracies of WRS-enhanced models. Note massive fluctuations of grey lines and stability of blue lines. All variants shown are using standard sampling weights for WRS, with simple-averaging.

🔼 This figure shows the test accuracy over time for four different online learning algorithms on two datasets: Avazu (App) and News20. The light grey lines represent the accuracy of the standard Passive-Aggressive Classifier (PAC) and First-Order Sparse Online Learning (FSOL) algorithms. The solid black lines show the ‘oracle’ accuracy, representing the highest accuracy achieved by either algorithm at any given timestep. The solid blue lines represent the accuracy of the algorithms enhanced with Weighted Reservoir Sampling (WRS). The figure highlights how WRS significantly stabilizes the accuracy of the online learning algorithms, reducing the fluctuations seen in the standard algorithms.
read the caption
Figure 1: Test accuracies (y-axis) over timestep (x-axis) for PAC-WRS and FSOL-WRS on Avazu (App) and News20. Light grey lines: test accuracies of the baseline methods PAC or FSOL - at each timestep. Solid black lines: test accuracies of the 'oracle' models, computed as the cumulative maximum of the baselines. Solid blue lines: test accuracies of WRS-enhanced models. Note massive fluctuations of grey lines and stability of blue lines. All variants shown are using standard sampling weights for WRS, with simple-averaging.
More on tables

🔼 This table shows the number of datasets (out of 16) where using the Weighted Reservoir Sampling (WRS) method with a reservoir size of 64 improved the Relative Oracle Performance (ROP) compared to the baseline methods (Passive-Aggressive Classifier (PAC) and First-Order Sparse Online Learning (FSOL)). The results are broken down by the averaging method used (simple or weighted) and the weighting scheme (standard or exponential).
read the caption
Table 2: Numbers of datasets out of 16 where each PAC-WRS or FSOL-WRS variant with K = 64 outperformed its corresponding base method (PAC or FSOL), as measured by ROP averaged across 5 randomized trials.

🔼 This table shows the number of datasets (out of 16) where using Weighted Reservoir Sampling (WRS) with a reservoir size of 64 resulted in a better Relative Oracle Performance (ROP) compared to the baseline methods (PAC or FSOL). ROP measures the stability of the test accuracy over time, with lower values indicating greater stability. The table breaks down the results by the averaging scheme used (Simple Average vs. Weighted Average) and the weighting scheme (Standard vs. Exponential).
read the caption
Table 3: Numbers of datasets out of 16 where each PAC-WRS or FSOL-WRS variant with K = 64 outperformed its corresponding base method (PAC or FSOL), as measured by ROP averaged across 5 randomized trials.

🔼 This table presents the characteristics of the 16 datasets used in the paper’s numerical experiments. For each dataset, it provides the following information: * Dataset: The name of the dataset. * D: The dimensionality of the feature vectors (number of features). * N: The total number of instances (data points) in the dataset. * Ntrain: The number of instances used for training. * Ntest: The number of instances used for testing. * Sparsity: A measure of the sparsity of the dataset, representing the proportion of zero entries in the feature vectors.
read the caption
Table 1: Sizes, dimensions, and sparsities of all datasets used for numerical experiments.

🔼 This table presents the characteristics of the 16 datasets used in the paper’s numerical experiments. For each dataset, it provides the number of data points (N), the dimensionality of the data (D), the number of training points (Ntrain), the number of test points (Ntest), and a measure of the sparsity of the data. Sparsity here refers to the proportion of zero values in the dataset. This information is crucial for understanding the computational complexity and characteristics of the experiments.
read the caption
Table 1: Sizes, dimensions, and sparsities of all datasets used for numerical experiments.

🔼 This table shows the p-values obtained from Wilcoxon signed-rank tests. These tests assess the statistical significance of differences in Relative Oracle Performance (ROP) between the proposed Weighted Reservoir Sampling-Augmented Training (WAT) method (PAC-WRS and FSOL-WRS with K=64) and the baseline methods (PAC and FSOL). The p-values indicate whether the improvements in ROP observed for the WAT methods are statistically significant (typically, a p-value below 0.05 suggests statistical significance). The table breaks down the p-values by the averaging method used (simple or weighted) and the weighting scheme (standard or exponential).
read the caption
Table 6: Wilcoxon signed-rank test p-values testing whether differences in relative oracle performance between K = 64 PAC/FSOL-WRS variants and base PAC/FSOL methods are statistically significant.

🔼 This table presents the p-values from Wilcoxon signed-rank tests. These tests assess the statistical significance of the differences in final test accuracy between the models using weighted reservoir sampling (PAC/FSOL-WRS with K=64) and their base counterparts (PAC/FSOL). The results indicate whether the improvements in final test accuracy achieved by the WRS variants are statistically significant.
read the caption
Table 7: Wilcoxon signed-rank test p-values testing whether differences in final test accuracy between K = 64 PAC/FSOL-WRS variants and base PAC/FSOL methods are statistically significant.
Full paper#


