TL;DR#
Individualized treatment regimes (ITRs) are crucial for precision medicine, aiming to personalize treatments based on patient characteristics. Traditional ITR estimation methods often rely on inverse probability weighting (IPW), which can be statistically biased, and L1-penalization, which makes the objective non-smooth and computationally costly. This leads to inaccurate and unstable ITR estimations.
This research proposes a novel ITR estimation framework formulated as a smooth convex optimization problem, enabling robust computation using projected gradient descent. The study leverages covariate balancing weights, providing better computational and statistical guarantees than IPW. The results showcase that the proposed method significantly improves both the robustness and effectiveness of ITR estimation, outperforming existing methods in simulations and real-world applications.
Key Takeaways#
Why does it matter?#
This paper is crucial for researchers in causal inference and precision medicine. It offers a robust and efficient framework for estimating individualized treatment rules (ITRs), addressing limitations of existing methods. The framework’s theoretical guarantees and improved performance open new avenues for ITR research and applications across various fields.
Visual Insights#

🔼 This figure compares the accuracy of different ITR estimation methods across various simulation settings. It shows accuracy results for both randomized trials (with linear optimal ITR) and observational studies (with nonlinear optimal ITR). The figure highlights the impact of different weighting schemes (IPW vs. EBW), optimization methods (L1-penalized vs. constrained PGD), and the combined approach (EBW, PGD, variable screening, outcome augmentation, inverse variance weighting) on the accuracy of ITR estimation.
read the caption
Figure 1: Accuracy Comparison: proposed methods vs. benchmark methods. All subplots in the same row share the same simulation setting, focusing on randomized trials with linear ITR as the true optimal rule (top) and observational studies with nonlinear ITR as the true optimal rule (bottom). Each subplot presents (Left) accuracy comparisons based on weights, illustrating the difference between the standard IPW approach of AD-Learning with the proposed approach using EBW, (Middle) accuracy comparisons based on optimization algorithms, illustrating the difference between the standard L1-penalized approach against the proposed constrained optimization with PGD, (Right) evaluation of accuracies between existing standard approaches and the proposed method, which integrates EBWs, variance and dimension reduction techniques implemented through PGD. Error bars represent the standard errors of the mean (SEM) of accuracies across multiple simulations.

🔼 This table presents the average empirical value functions obtained by various methods (AD, SABD, policytree, causalDML, and Proposed) for two datasets: ACTG (continuous outcome) and Email (binary outcome). For each dataset, multiple training set sizes were used. The empirical value function represents the average outcome under the estimated treatment rule, with higher values indicating better performance. The standard error of the mean (SEM) provides a measure of uncertainty around the estimated value. The table shows the performance of different approaches for learning optimal individualized treatment rules.
read the caption
Table 1: Average empirical value functions across different approaches for ACTG/Email datasets. Mean values with the corresponding standard errors of the mean (SEM) in parentheses are provided. The highest-performing methods are marked in bold.
In-depth insights#
Unified ITR Framework#
The proposed “Unified ITR Framework” presents a novel approach to estimating individualized treatment rules (ITRs) by combining causal inference and optimization perspectives. It addresses limitations of traditional methods that rely on inverse probability weighting (IPW) and L1-penalization, which can introduce bias and computational challenges. This framework formulates ITR estimation as a constrained, weighted, and smooth convex optimization problem, making it more robust and computationally efficient. Covariate balancing weights, particularly distributional covariate balancing weights (DCBWs), are incorporated to effectively handle confounding factors and improve optimization and likelihood landscapes. This approach significantly enhances both robustness and effectiveness, demonstrating substantial gains in ITR learning compared to existing methods. The framework leverages projected gradient descent for efficient computation and incorporates additional improvements such as variable screening, outcome augmentation, and inverse variance weighting to further refine the ITR estimates and boost accuracy and precision.
DCBW in ITR#
The integration of Distributional Covariate Balancing Weights (DCBWs) into Individualized Treatment Rule (ITR) estimation offers a significant improvement over traditional methods that rely on Inverse Probability Weighting (IPW). DCBWs provide a model-free approach, eliminating the bias and sensitivity to misspecification inherent in IPW-based propensity score methods. This is particularly crucial in observational studies where confounding factors significantly influence treatment effects. By directly minimizing the distance between covariate distributions, DCBWs ensure robust causal effect estimation. The theoretical analysis demonstrates that DCBWs improve the optimization and likelihood landscapes, leading to more precise and stable ITR estimation. The use of DCBWs within a smooth, convex optimization framework provides a significant advancement, allowing for efficient computation and strong theoretical guarantees in the final ITR estimates, enhancing both robustness and effectiveness compared to existing methods. Importantly, the model-free nature of DCBWs makes them more versatile and generally applicable to various ITR learning problems.
PGD for ITR#
The application of Projected Gradient Descent (PGD) to Individualized Treatment Rules (ITR) estimation presents a significant advance in causal inference. PGD’s ability to efficiently solve constrained optimization problems is ideally suited to the ITR framework, which often involves balancing competing objectives such as maximizing expected outcome and promoting model sparsity/interpretability. The paper highlights the advantages of PGD over subgradient methods frequently used with L1-penalization, which suffer from slower convergence. The smooth, convex formulation of the ITR problem using a hard L1-ball constraint rather than soft L1-penalization is crucial for PGD’s effectiveness. This approach avoids the computational bias associated with subgradient methods while still promoting sparse solutions. Combining PGD with covariate balancing weights (e.g. EBWs) creates a unified framework that addresses several limitations of traditional ITR estimation. The robustness and efficiency gains obtained demonstrate the promise of this approach in real-world applications of precision medicine, offering a superior alternative to existing methods.
Statistical Guarantees#
The section on “Statistical Guarantees” in this research paper is crucial for establishing the reliability and validity of the proposed individualized treatment rule (ITR) estimation framework. It delves into the theoretical properties of the framework, providing rigorous mathematical proofs to support the claims of consistency and convergence. This is essential because it demonstrates that the algorithm doesn’t just work well in simulations but is also theoretically sound, offering confidence that its performance will generalize to real-world applications. The guarantees likely cover convergence rates of the optimization algorithm (ensuring it reaches an optimal solution efficiently), consistency of estimators (demonstrating that the estimated ITR approaches the true optimal ITR as the sample size increases), and possibly error bounds to quantify the estimation error. Assumptions made in achieving these guarantees will be clearly stated, and their implications on the applicability of the results should be discussed. This theoretical underpinning significantly strengthens the paper’s contribution compared to purely empirical studies by providing a strong foundation for the reliability and generalizability of the proposed method.
Future ITR Research#
Future research in Individualized Treatment Rules (ITRs) should prioritize several key areas. Improving the robustness of ITR estimation to model misspecification and high-dimensional data is crucial. This could involve exploring more sophisticated weighting methods beyond inverse probability weighting or developing novel regularization techniques. Developing more flexible model classes for ITRs is essential, especially for scenarios where treatment effects are non-linear or involve complex interactions. This involves integrating techniques from machine learning and causal inference. Addressing challenges in the estimation of optimal ITRs with multiple treatments is important, as this is often a more realistic clinical scenario. Addressing practical implementation issues in ITRs, such as data quality, patient heterogeneity, and ethical considerations, is also needed to fully realize the potential of precision medicine. Finally, further theoretical work could provide deeper insights into the statistical properties of ITR estimators and guide the development of more efficient and reliable algorithms. This can include work on sample complexity, convergence rates, and robustness guarantees.
More visual insights#
More on tables

🔼 This table shows the average empirical value function for different methods (AD, SABD, policytree, causalDML, and the proposed method) on the ACTG and Email datasets, for different training sample sizes. The empirical value function is a measure of how well the treatment assignment method is performing, with higher values indicating better performance. The standard error of the mean (SEM) is provided to show the variability in the estimates. The bold values indicate the highest-performing method for each sample size.
read the caption
Table 1: Average empirical value functions across different approaches for ACTG/Email datasets. Mean values with the corresponding standard errors of the mean (SEM) in parentheses are provided. The highest-performing methods are marked in bold.

🔼 This table presents the average accuracy and standard deviations for different ITR estimation methods in a randomized trial setting. The data is generated using linear interaction functions and simple treatment-free effect functions. Results are shown for various sample sizes (n) and numbers of covariates (p) and are separated into original and augmented methods.
read the caption
Table 2: Average accuracy and their standard deviations (in parenthesis) in the randomized trial in Case 1: Linear interaction functions with simple treatment-free effect functions.

🔼 This table presents the average accuracy and standard deviations of four different methods (AD, ADe, ADS, ADe,s, SABD, SABDe, SABD, SABDe,s) for estimating individualized treatment rules (ITRs) in a randomized trial setting. The results are shown for different sample sizes (n = 200, 600, 1000) and numbers of covariates (p = 20, 40, 60). The methods vary in how they handle confounding, with some employing covariate balancing weights (e.g., ADe, SABDe) and others using inverse probability weighting. The ‘original’ and ‘augmented’ sections compare ITR accuracy with and without outcome augmentation to reduce the variance of estimates. The goal is to assess the impact of the different methodological choices on ITR estimation accuracy.
read the caption
Table 2: Average accuracy and their standard deviations (in parenthesis) in the randomized trial in Case 1: Linear interaction functions with simple treatment-free effect functions.

🔼 This table presents the average accuracy and standard deviations of four different ITR estimation methods (AD, ADe, ADS, ADe,s) and four different causal inference methods (SABD, SABDe, SABD_s, SABD_e,s) in a randomized trial setting with linear interaction functions and simple treatment-free effect functions. The results are broken down by the number of covariates (p = 20, 40, 60) and sample sizes (n = 200, 600, 1000). It also includes a comparison of the original methods and augmented versions.
read the caption
Table 2: Average accuracy and their standard deviations (in parenthesis) in the randomized trial in Case 1: Linear interaction functions with simple treatment-free effect functions.
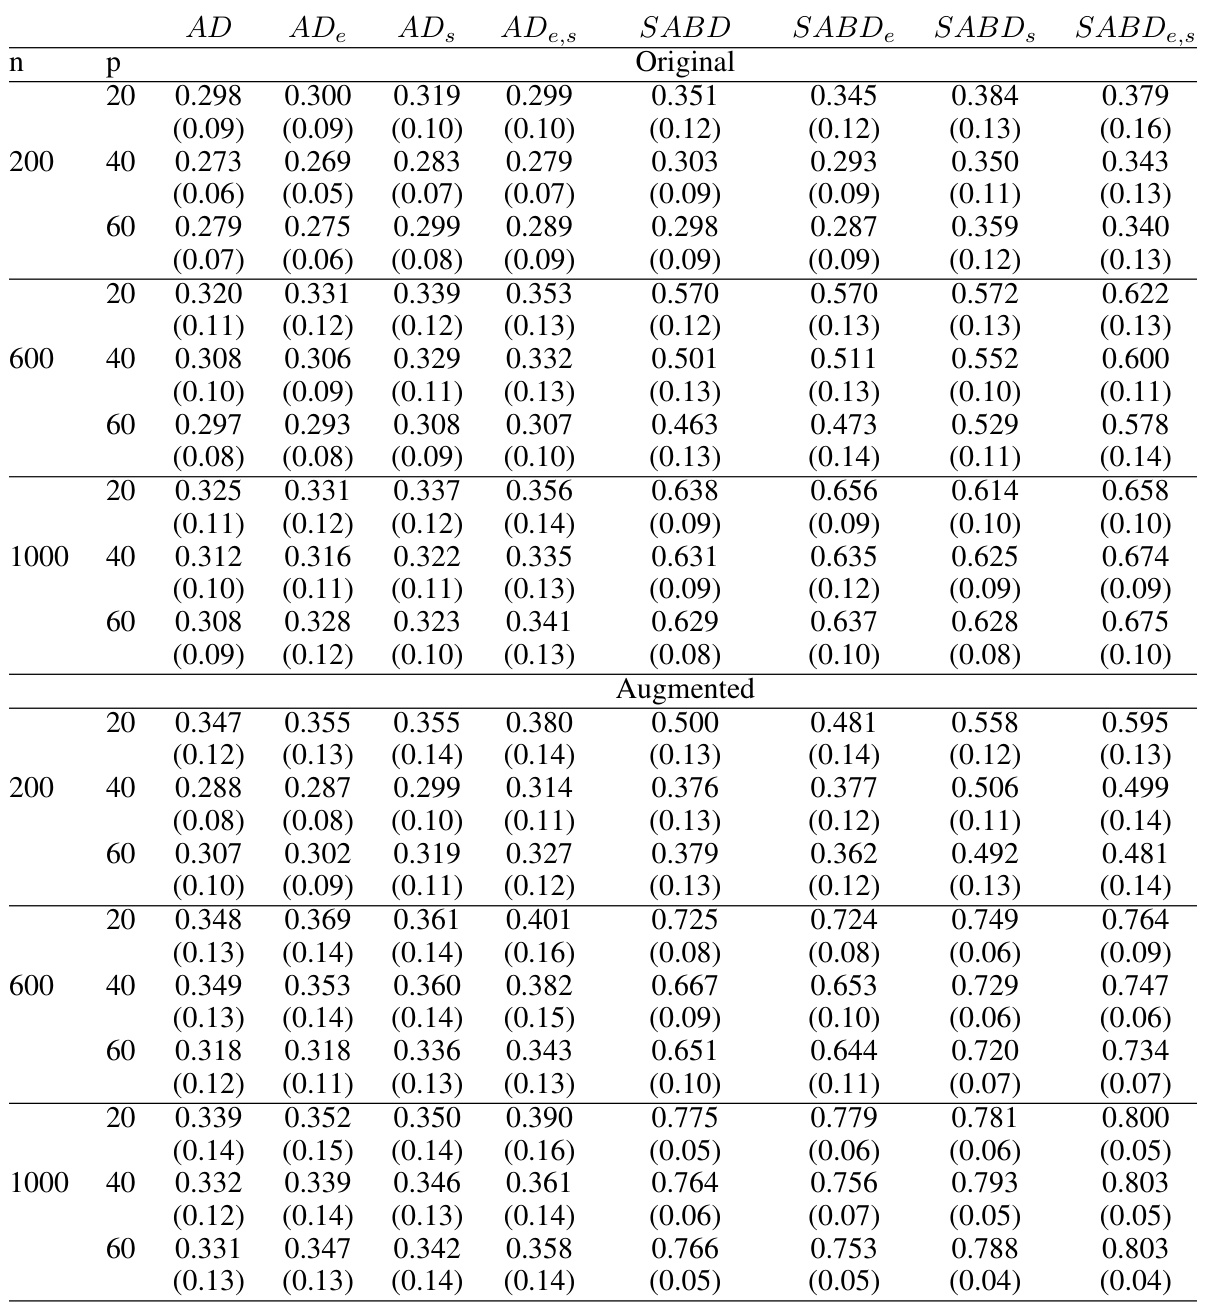
🔼 This table presents the average accuracy and standard deviations for different ITR estimation methods in a randomized trial setting. The results are categorized by the sample size (n = 200, 600, 1000), number of covariates (p = 20, 40, 60), and whether outcome augmentation was used. The methods compared include AD-Learning (AD), AD-Learning with Energy Balancing Weights (AD_e), AD-Learning with variable screening (AD_s), and AD-Learning with both EBWs and variable screening (AD_e,s). Similar comparisons are made for SABD-Learning.
read the caption
Table 2: Average accuracy and their standard deviations (in parenthesis) in the randomized trial in Case 1: Linear interaction functions with simple treatment-free effect functions.
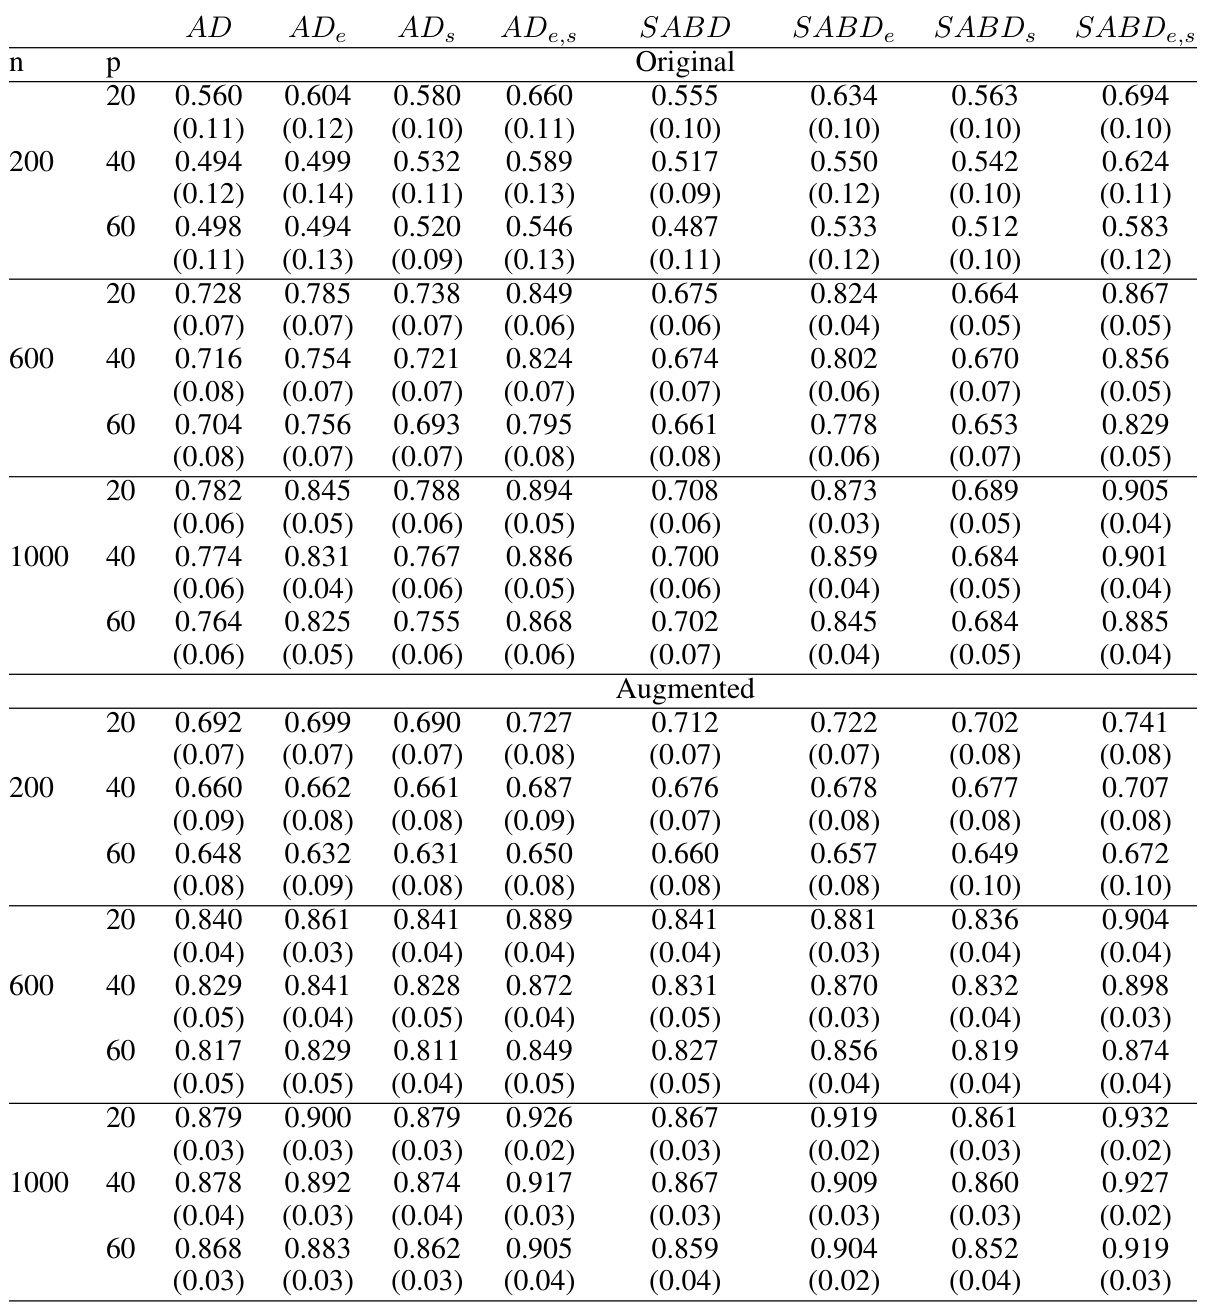
🔼 This table presents the average accuracy and standard deviations for various ITR estimation methods in an observational study setting where the true optimal ITR is linear. The results are shown for different sample sizes (n = 200, 600, 1000) and numbers of covariates (p = 20, 40, 60). Both original methods and augmented methods are included. The table helps to compare the performance of different weighting schemes and optimization algorithms in observational studies, particularly focusing on the impact of confounding factors.
read the caption
Table 6: Average accuracy and their standard deviations (in parenthesis) in the observational study in Case 1: Linear interaction functions with simple treatment-free effect functions.

🔼 This table presents the average accuracy and standard deviations of four different methods (AD, ADe, ADS, ADe,s, SABD, SABDe, SABD, SABDe,s) for estimating individualized treatment rules (ITR) in a randomized trial setting with linear interaction functions and simple treatment-free effect functions. The results are shown for different sample sizes (n=200, 600, 1000) and numbers of covariates (p=20, 40, 60). The table also breaks down the results by whether outcome augmentation was used. Higher accuracy values indicate better performance of the ITR estimation method.
read the caption
Table 2: Average accuracy and their standard deviations (in parenthesis) in the randomized trial in Case 1: Linear interaction functions with simple treatment-free effect functions.

🔼 This table presents the average accuracy and standard deviations of four different ITR estimation methods (AD, ADe,s, SABD, SABDe,s) across various sample sizes (n=200, 600, 1000) and dimensions (p=20, 40, 60). The results are separated into ‘Original’ and ‘Augmented’ sections, representing different treatment of the outcome variable. Each method is evaluated twice for both original and augmented outcome variables to see the effect of augmentation on the accuracy. Case 1 refers to a specific simulation setup within the paper, using linear interaction functions and simple treatment-free effect functions. This allows the researchers to assess the effect of different weighting schemes and optimization techniques on the accuracy of ITR estimation under controlled conditions.
read the caption
Table 2: Average accuracy and their standard deviations (in parenthesis) in the randomized trial in Case 1: Linear interaction functions with simple treatment-free effect functions.

🔼 This table presents the average accuracy and standard deviations of different methods for estimating individualized treatment rules (ITRs) in a randomized trial setting. The trial uses linear interaction functions with simple treatment-free effect functions. Results are shown for different sample sizes (n = 200, 600, 1000) and numbers of covariates (p = 20, 40, 60). The methods compared include AD-Learning, AD-Learning with Energy Balancing Weights (AD_e), AD-Learning with variable screening (AD_s), and AD-Learning with both EBWs and screening (AD_e,s), along with similar variations for SABD-Learning. The table is split to show results for original models and augmented models.
read the caption
Table 2: Average accuracy and their standard deviations (in parenthesis) in the randomized trial in Case 1: Linear interaction functions with simple treatment-free effect functions.
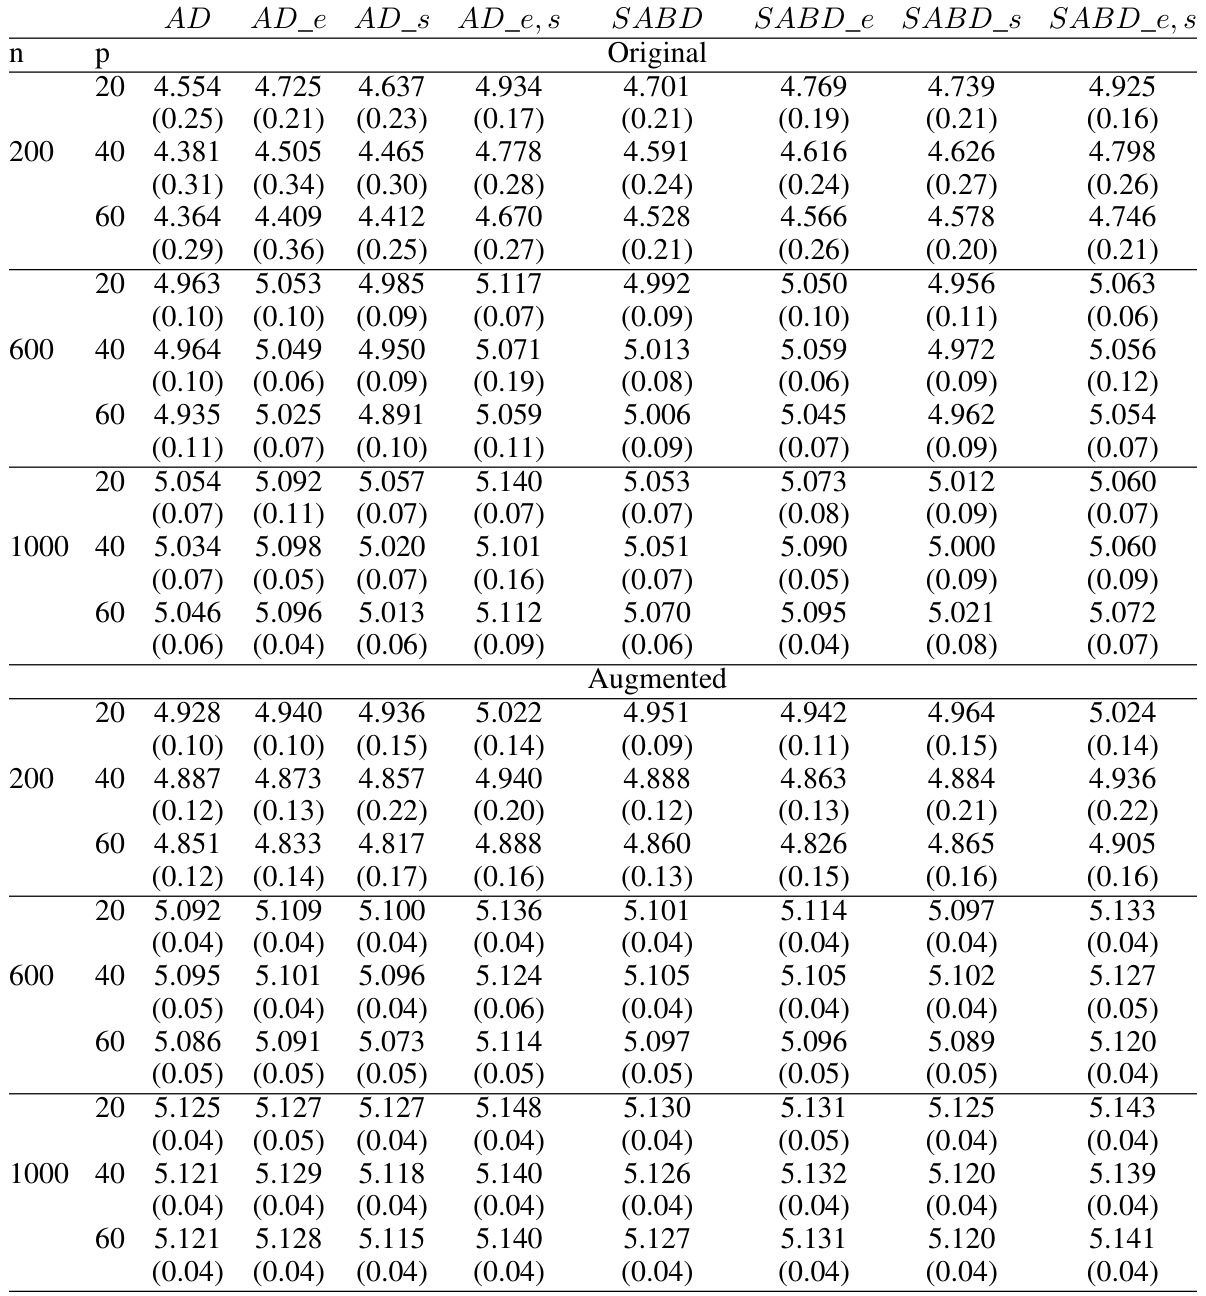
🔼 This table shows the average empirical values and their standard deviations obtained from the randomized trials in Case 1 of the simulation study, where the ITR is linear and treatment-free effects are simple. The results are shown for different sample sizes (n=200, 600, 1000) and numbers of covariates (p=20, 40, 60). The ‘Original’ section shows results without outcome augmentation, while ‘Augmented’ shows results when this technique is applied. The optimal empirical value (5.160) is the maximum expected outcome achievable with the optimal treatment rule. The values for each treatment (1.751, 1.752, etc.) show the average expected outcome if a single treatment is applied to the entire population. The table helps illustrate the improvement in the average empirical value that can be achieved by using the proposed method, particularly with outcome augmentation.
read the caption
Table 10: Average empirical values and their standard deviations (in parenthesis) in the randomized trial in Case 1: Linear interaction functions with simple treatment-free effect functions. The optimal empirical value is 5.160 and the average empirical values when assigning one treatment are 1.751, 1.752, 1.751, and 1.752, respectively.
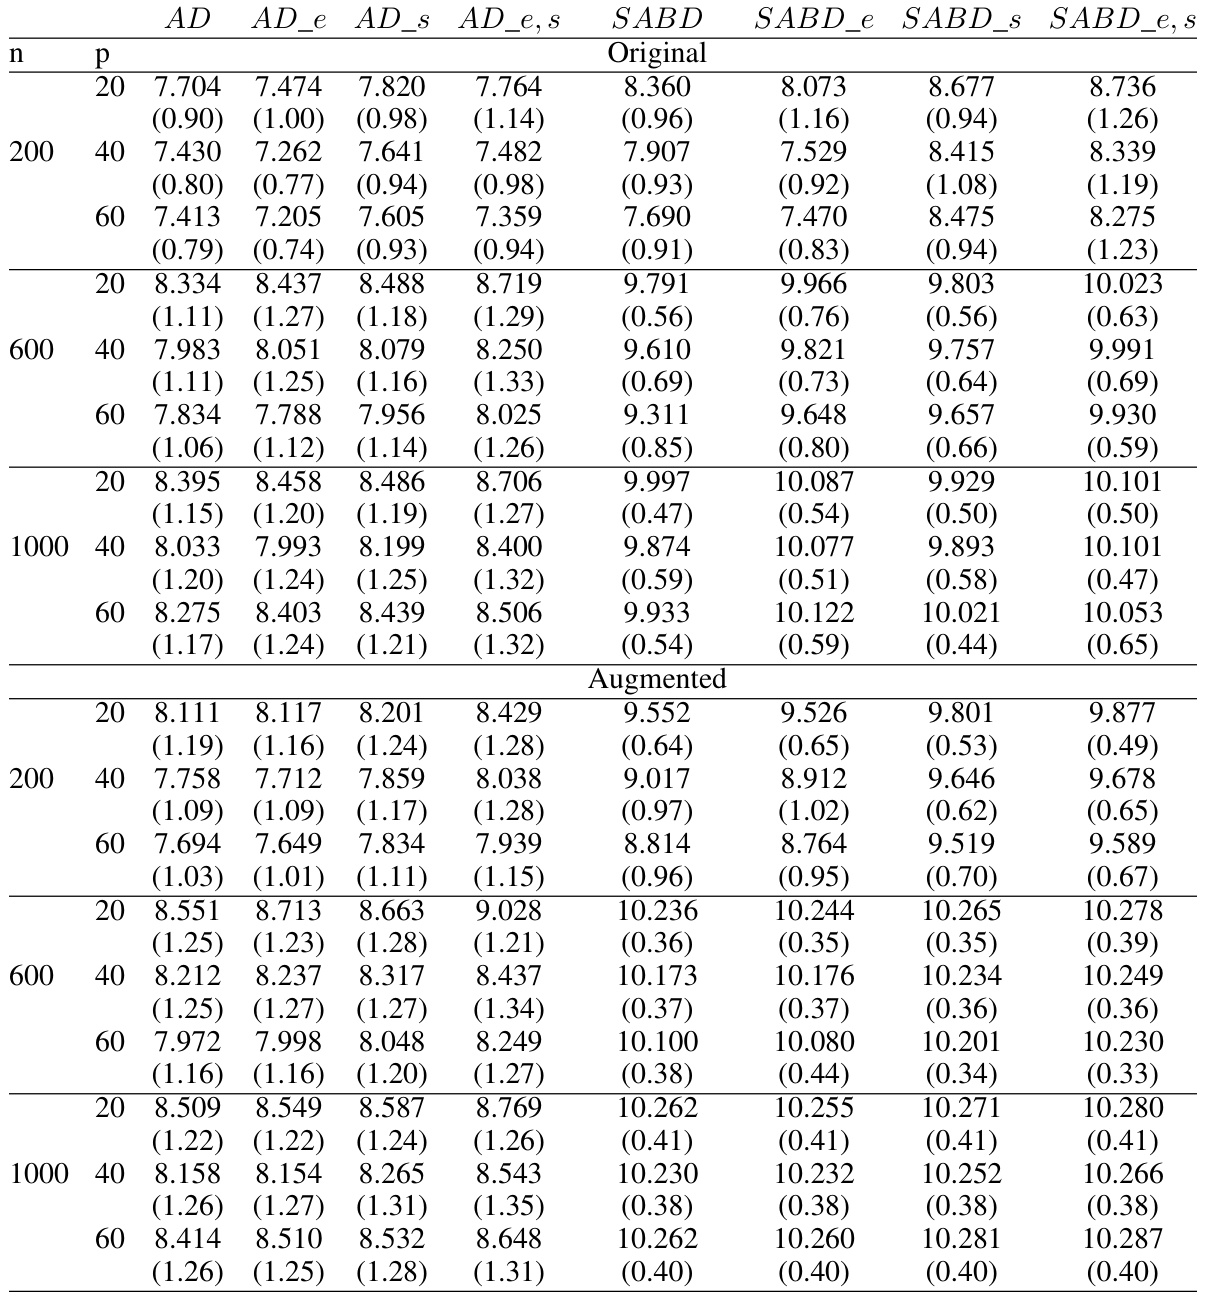
🔼 This table presents the average empirical values and their standard deviations for different ITR estimation methods in a randomized trial setting with linear interaction functions and simple treatment-free effect functions. It compares the performance of the original methods and the augmented versions, across different sample sizes (n) and numbers of covariates (p). The optimal empirical value, representing the highest possible value, is also provided along with the average empirical values when only a single treatment is applied to all subjects. The results offer insights into the effectiveness of various methods in estimating the optimal treatment rule under different conditions.
read the caption
Table 10: Average empirical values and their standard deviations (in parenthesis) in the randomized trial in Case 1: Linear interaction functions with simple treatment-free effect functions. The optimal empirical value is 5.160 and the average empirical values when assigning one treatment are 1.751, 1.752, 1.751, and 1.752, respectively.

🔼 This table presents the average accuracy and standard deviations for different ITR estimation methods in a randomized trial setting where the true optimal individualized treatment rule is linear. It compares the performance of AD-Learning, SABD-Learning, and their augmented versions using inverse probability weighting and energy balancing weights with varying sample sizes (n = 200, 600, 1000) and covariate dimensions (p = 20, 40, 60). The results are divided into ‘Original’ and ‘Augmented’ sections to showcase the impact of incorporating outcome augmentation on model accuracy.
read the caption
Table 2: Average accuracy and their standard deviations (in parenthesis) in the randomized trial in Case 1: Linear interaction functions with simple treatment-free effect functions.

🔼 This table presents the average accuracy and standard deviations obtained from a randomized trial simulation with linear interaction functions and simple treatment-free effect functions. The results are categorized by sample size (n = 200, 600, 1000), number of covariates (p = 20, 40, 60), and method used (AD, ADe, ADs, ADe,s, SABD, SABDe, SABDs, SABDe,s). ‘Original’ and ‘Augmented’ sections show results before and after outcome augmentation, respectively. The data indicates the performance of different ITR estimation methods under various conditions.
read the caption
Table 2: Average accuracy and their standard deviations (in parenthesis) in the randomized trial in Case 1: Linear interaction functions with simple treatment-free effect functions.

🔼 This table presents the average accuracy and standard deviations of different ITR estimation methods in an observational study. The study uses linear interaction functions and simple treatment-free effect functions. The results are broken down by sample size (n) and the number of covariates (p), showing performance for both original and augmented methods. The table allows comparison of various methods like AD, SABD, and their extensions with energy balancing weights (EBW) and variable screening. This comparison helps assess the impact of these techniques on ITR accuracy in the presence of confounding factors.
read the caption
Table 6: Average accuracy and their standard deviations (in parenthesis) in the observational study in Case 1: Linear interaction functions with simple treatment-free effect functions.

🔼 This table presents the average accuracy and standard deviations of different ITR estimation methods in an observational study. The study uses linear interaction functions with simple treatment-free effect functions. Results are shown for different sample sizes (n) and numbers of covariates (p), separated into original and augmented results. The methods compared include AD-Learning, SABD-Learning and their variants using energy balancing weights (EBW) and variable screening.
read the caption
Table 6: Average accuracy and their standard deviations (in parenthesis) in the observational study in Case 1: Linear interaction functions with simple treatment-free effect functions.

🔼 This table presents the average accuracy and standard deviations of four different ITR estimation methods (AD, ADe,s, SABD, SABD_e,s) under two different settings (original and augmented) with different covariate dimensions and sample sizes for a randomized trial with linear ITR as the optimal rule. The results are categorized by the type of weighting method used (original or augmented).
read the caption
Table 2: Average accuracy and their standard deviations (in parenthesis) in the randomized trial in Case 1: Linear interaction functions with simple treatment-free effect functions.
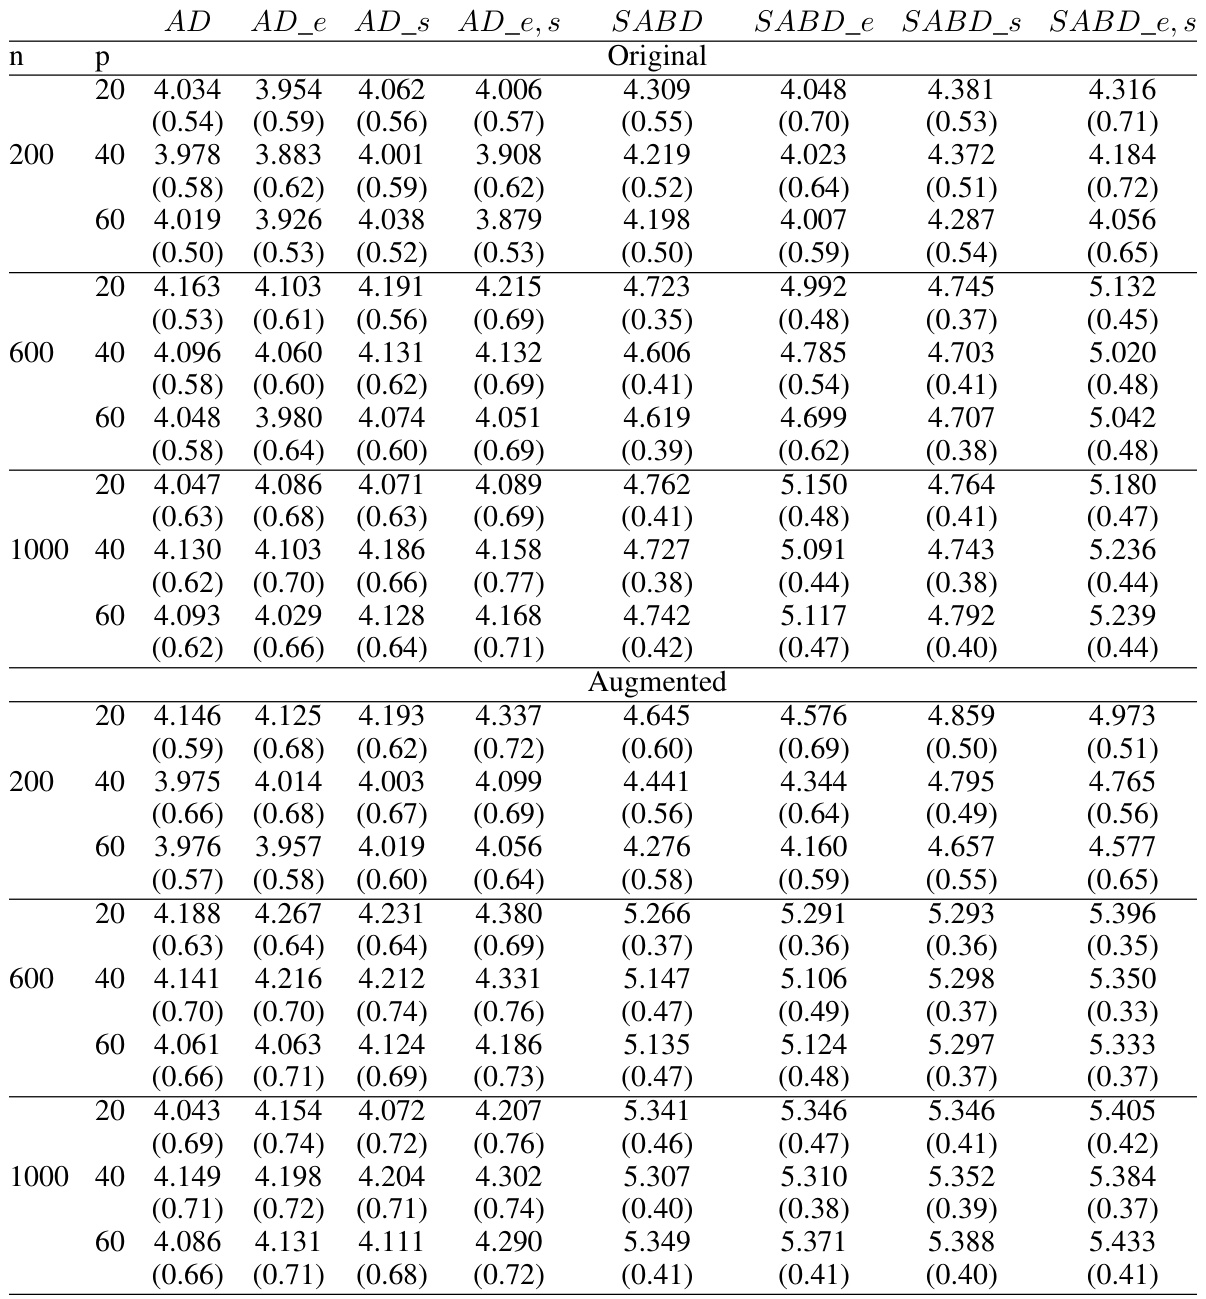
🔼 This table presents the average accuracy and standard deviations for different ITR estimation methods in a randomized trial setting. The trial uses linear interaction functions with simple treatment-free effect functions. Results are shown for various sample sizes (n = 200, 600, 1000) and numbers of covariates (p = 20, 40, 60). The methods compared include AD-Learning, AD-Learning with energy balancing weights (AD_e), AD-Learning with variable screening (AD_s), AD-Learning with both energy balancing weights and variable screening (AD_e,s), SABD-Learning, and their augmented versions.
read the caption
Table 2: Average accuracy and their standard deviations (in parenthesis) in the randomized trial in Case 1: Linear interaction functions with simple treatment-free effect functions.
Full paper#


