TL;DR#
Deep learning models often struggle to adapt to real-world data that differs from their training data (domain shift). Test-time adaptation (TTA) aims to solve this by adapting models on-the-fly using only unlabeled data from the new domain. Many existing TTA methods try to minimize entropy which can be computationally expensive and require processing entire models. This can be problematic in resource-constrained settings.
This paper introduces L-TTA, a new approach that tackles the challenge. Instead of focusing on minimizing entropy, L-TTA innovatively remodels the ‘stem layer’ (the model’s initial layer) to minimize uncertainty. This approach significantly reduces the computational burden, needs only to modify the stem layer, and allows for faster adaptation. The stem layer utilizes a discrete wavelet transform to extract multi-frequency features and minimize uncertainty for better performance. The evaluations demonstrate that L-TTA outperforms other methods by achieving top performance using minimal memory.
Key Takeaways#
Why does it matter?#
This paper is important because it presents a novel and efficient approach to test-time adaptation (TTA) in deep learning, a crucial problem in real-world applications. The method’s focus on minimizing uncertainty rather than entropy, combined with its lightweight design, offers significant advantages over existing methods in terms of memory efficiency and adaptation speed. This opens up new avenues for research in efficient TTA for various tasks and datasets, particularly those with limited resources or real-time constraints.
Visual Insights#

🔼 This figure compares the computational flow of three different test-time adaptation (TTA) methods: TENT, EcoTTA, and the proposed method. TENT and EcoTTA, representing entropy minimization and memory-efficient approaches, respectively, show full forward and backward passes through the network for parameter updates. The proposed method, in contrast, only updates parameters in a reconstructed stem layer, significantly reducing computational overhead. The locked icons highlight the parts of the network not involved in TTA execution in each method.
read the caption
Figure 1: Diagram comparing the forward/backward flow and update process with TENT [59] and EcoTTA [55], illustrated as representative algorithms for entropy minimization and memory-efficient methods, respectively. The red lock icon indicates the absence of TTA execution.

🔼 This table presents a comparison of the prediction error rates (%) achieved by different Test-Time Adaptation (TTA) methods on two benchmark datasets: CIFAR-10-C and ImageNet-C. The results are broken down by corruption type (Noise, Blur, Weather, Digital, etc.) and show the performance of various methods, including the proposed L-TTA method. ResNet-26 was used for CIFAR-10-C and ResNet-50 for ImageNet-C.
read the caption
Table 1: Comparisons of prediction error (%) with prior TTA methods on CIFAR-10-C with ResNet-26 and ImageNet-C with ResNet-50.
In-depth insights#
Lightweight TTA#
Lightweight Test-Time Adaptation (TTA) methods are crucial for deploying deep learning models in real-world scenarios where retraining is infeasible. The core idea is to minimize the computational cost and memory footprint associated with adaptation, focusing on efficiency. This is achieved by limiting the model parameters involved in the adaptation process, often focusing on a small part of the network. Unlike traditional TTA that might involve extensive backward and forward passes through the entire model, lightweight approaches might only update a few layers or utilize clever parameterizations that drastically reduce memory requirements and computation. The key advantage lies in the ability to adapt quickly to new domains without significant overhead, making them suitable for resource-constrained devices or time-sensitive applications. A challenge, however, is to maintain accuracy while reducing model complexity. Effective lightweight TTA methods require careful consideration of which network components to adapt and which criteria to use for adaptation. Successfully balancing efficiency and accuracy remains an active research area.
Stem Layer#
The concept of a ‘stem layer’ in deep learning models, typically referring to the initial convolutional layers, is explored in this paper as a crucial component for efficient test-time adaptation (TTA). The authors propose a novel approach that focuses on modifying only the stem layer, rather than the entire network, to adapt to new domains. This strategy offers significant advantages in terms of reduced memory usage and computational cost, making it a more practical and efficient TTA method. The paper highlights the effectiveness of incorporating a discrete wavelet transform (DWT) and a Gaussian Channel Attention Layer (GCAL) within the redesigned stem layer. The DWT helps extract multi-frequency features, improving robustness and generalization. GCAL’s channel-wise attention mechanism facilitates efficient uncertainty minimization, which is presented as a superior alternative to entropy minimization for TTA. Overall, the lightweight nature and adaptability of the proposed stem layer approach represents a notable contribution to the field, addressing the existing limitations of memory-intensive TTA techniques. The experimental results support the claims, showing the proposed method’s superior performance across several benchmarks.
Uncertainty Min#
The concept of ‘Uncertainty Min’, while not explicitly a heading, strongly suggests a focus on minimizing uncertainty within a model’s predictions. This approach is a significant departure from traditional test-time adaptation (TTA) methods that primarily target entropy minimization. Minimizing uncertainty implies building a model less susceptible to unpredictable or erroneous outputs, particularly when dealing with noisy or out-of-distribution data. This is crucial for real-world applications where perfect data is unavailable. The success of this strategy hinges on the method employed to quantify and reduce uncertainty, which likely involves novel techniques for assessing and adjusting the model’s confidence levels. A well-defined uncertainty metric is essential, along with an efficient mechanism for uncertainty reduction. This approach’s effectiveness in handling domain shift scenarios and improving model robustness under real-world conditions would be a key area of investigation and validation.
DWT#
The Discrete Wavelet Transform (DWT) is a crucial technique in the paper, enhancing test-time adaptation (TTA) by enabling the extraction of multi-frequency features from input images. DWT’s ability to decompose signals into different frequency components allows the model to learn domain-invariant features from multiple perspectives. This is particularly important in addressing domain shift, where the distribution of data in the target domain differs from the source domain. By focusing on minimizing the uncertainty within each frequency band, the model can improve its adaptability to unseen data, making it robust against various corruptions and variations in image quality. The use of DWT is a key innovation, setting this TTA method apart from previous approaches that rely heavily on minimizing entropy. The integration of DWT with other components like the Gaussian Channel Attention Layer (GCAL) shows a synergistic effect leading to improved performance and efficiency. Overall, the strategic application of DWT demonstrates a thoughtful consideration of the unique challenges presented by real-world domain shift scenarios in image processing.
Ablation Studies#
The Ablation Studies section is crucial for evaluating the individual contributions of different components within a proposed model. In this context, it would systematically remove or deactivate certain parts (e.g., the Gaussian Channel Attention Layer, Domain Embedding Layer, or specific DWT configurations) to understand their impact on overall performance. Key insights would be revealed by comparing the performance of the full model against these simplified versions. For instance, removing the GCAL might demonstrate the importance of uncertainty minimization in achieving robust test-time adaptation. Similarly, the ablation of DEL could quantify the benefits of multi-frequency feature extraction via DWT. Analyzing the performance trade-offs would highlight the effectiveness and necessity of each component, helping to refine the model architecture and justify design choices. Such results would support the claims of the paper by validating the proposed model’s design, demonstrating that its constituent elements are not merely additive but synergistically contribute to improved adaptation in challenging scenarios.
More visual insights#
More on figures

🔼 This figure illustrates the architecture of the proposed method’s reconstructed stem layer. The input image undergoes a Discrete Wavelet Transform (DWT) using DEL (Domain Embedding Layer) which decomposes it into multiple frequency domains. These are then processed by a convolutional layer and fed into GCAL (Gaussian Channel Attention Layer). GCAL calculates channel-wise attention and uncertainty, which is then minimized during training to improve adaptation. Finally, an Inverse Discrete Wavelet Transform (IDWT) reconstructs the output to match the original input shape. The figure details the operations performed within the stem layer, highlighting the DWT, convolution, GCAL, and IDWT operations, as well as element-wise multiplication.
read the caption
Figure 2: Overview of our method including the reconstructed stem layer. * and ⊗ denote element-wise multiplication and CONV operation, respectively, while ψl and ψh respectively denote the low and high filters for DWT, described in Appendix B.

🔼 This figure shows the proposed Omnidirectional Decomposition (ODD) process and the variance of uncertainty of Low Frequency Component (LFC) and High Frequency Component (HFC) according to domain shift. The left panel (a) illustrates how ODD decomposes the input image into multiple frequency components (LFC_LL, HFC_LH, HFC_HL, HFC_HH) using a two-level Discrete Wavelet Transform (DWT), aiming to extract more diverse features for enhanced domain adaptation. The right panel (b) displays the uncertainty changes in LFC and HFC during Test-Time Adaptation (TTA). The variance of uncertainty (ΔγΣ) is visualized, showing how sensitive ODD is to changes in the input domain, and demonstrating its ability to maximize data utilization for better adaptation.
read the caption
Figure 3: (a) visualizes the proposed ODD process in detail on a given input. (b) shows the variance of uncertainty according to the domain shift of LFC (=LFCLL) and HFC (=HFCLH).

🔼 This figure compares the memory usage of various test-time adaptation (TTA) methods on two datasets: CIFAR-100-C and ImageNet-C. The bar chart shows that the proposed method (‘Ours’) uses significantly less memory than other state-of-the-art (SOTA) methods, especially those based on entropy minimization or batch normalization statistics adaptation. The percentage reductions in memory usage compared to the SOTA methods are clearly indicated on the chart.
read the caption
Figure 4: Comparison of memory usage in a single iteration on CIFAR-100-C and ImageNet-C datasets.

🔼 This figure shows the comparison of prediction error rates (%) across different numbers of TTA iterations on CIFAR-10-C dataset using ResNet-26 as the backbone network. Two variations of the proposed method are compared: one using both DEL and GCAL (DEL+GCAL), and the other using only GCAL. A horizontal dashed line indicates the average error rate achieved by the REALM method. The figure demonstrates that the proposed method (DEL+GCAL) consistently achieves lower error rates compared to using GCAL only, and surpasses the performance of REALM after 10 iterations, reaching a 5.7% performance improvement after a full epoch of training.
read the caption
Figure 6: Comparison of prediction error (%) across increasing TTA iterations on CIFAR-10-C with ResNet-26.

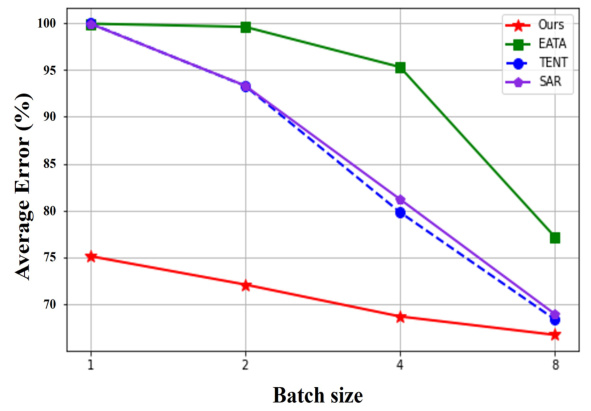
🔼 This figure compares the performance of the proposed TTA method with several other entropy minimization-based methods (TENT, EATA, and SAR) across various batch sizes (1, 2, 4, and 8) on the ImageNet-C dataset. The y-axis represents the average error rate, and the x-axis represents the batch size. The results show that the proposed method maintains relatively stable performance even with very small batch sizes (1 and 2), while the other methods show a significant increase in error rate as the batch size decreases. This demonstrates that the proposed method is more robust and efficient in handling small batch sizes, which is important for real-world applications where data may be limited.
read the caption
Figure 7: Assessment of TTA effectiveness for small batch sizes in comparison with entropy minimization baselines on ImageNet-C.

🔼 This figure shows the mean error rates for different corruption types (Noise, Blur, Weather, Digital) on ImageNet-C and CIFAR-100-C datasets as the number of TTA iterations increases. It illustrates the performance of the proposed method over time in handling various types of image corruptions in the two datasets. The x-axis represents the number of iterations and the y-axis represents the mean error rate. The graphs help visualize the model’s adaptation capability during the TTA process and how the performance stabilizes or converges after a certain number of iterations.
read the caption
Figure 8: Mean error rates (%) by corruption type on ImageNet-C and CIFAR-100-C with increasing TTA iterations in ResNet-50.
More on tables

🔼 This table compares the mean Intersection over Union (mIoU) scores achieved by different test-time adaptation (TTA) methods on the Cityscapes-C dataset, which contains semantic segmentation images with various weather conditions. The methods compared include the baseline (Source), the proposed method with and without specific components (Ours w/o GCAL, Ours w/o DEL, Ours), and other state-of-the-art (SOTA) TTA methods (BN STAT, TENT, EcoTTA). The results are presented for each weather condition (Bright, Foggy, Frost, Snow), as well as the average mIoU across all conditions. The memory usage (Mem.) of each method is also reported in MB to highlight the memory efficiency of the proposed method.
read the caption
Table 2: Comparison of mIoU (%) for semantic segmentation in Cityscapes-C using DeepLabV3Plus with prior TTA methods.

🔼 This table presents the results of evaluating the proposed method’s robustness on three challenging ImageNet series: ImageNet-Sketch, ImageNet-R, and ImageNet-A. The results are shown as prediction error percentages. The ‘Source’ column indicates the baseline performance of a ResNet-50 model pre-trained on ImageNet. The ‘Ours w/o GCAL’ column shows the performance of the model with the proposed method, excluding the Gaussian Channel Attention Layer (GCAL). The ‘Ours’ column represents the performance with the full proposed method. The values in parentheses show the improvement compared to the ‘Source’ column, illustrating the method’s ability to mitigate performance degradation in challenging scenarios.
read the caption
Table 3: Evaluation of the proposed method using ResNet-50 on challenging ImageNet series.

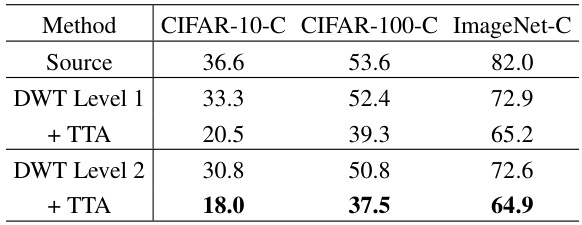
🔼 This table presents the ablation study on the effect of different DWT levels (1 and 2) on the performance of the proposed TTA method. It compares the average prediction errors on three datasets (CIFAR-10-C, CIFAR-100-C, and ImageNet-C) for the source model (without DWT), the model with DWT level 1, the model with DWT level 1 and TTA, the model with DWT level 2, and the model with DWT level 2 and TTA. The results demonstrate the impact of multi-level decomposition using DWT in improving TTA performance.
read the caption
Table 4: Comparison of TTA results in terms of average prediction errors for source, DWT level 1, and level 2 decompositions using ResNet-50 on CIFAR-10-C, CIFAR-100-C, and ImageNet-C.

🔼 This table shows the ablation study on the reduction size hyperparameter of the SE block in GCAL. The results for CIFAR-10-C, CIFAR-100-C, and ImageNet-C datasets are shown, indicating that reduction sizes of 8, 4, and 32 achieve the best results respectively. However, there is no significant difference except when the reduction size is 16 in CIFAR-10-C. Even with the different reduction sizes, the results exceed the SOTA.
read the caption
Table 5: Comparison TTA results in terms of average prediction errors using ResNet-50 on CIFAR-10-C, CIFAR-100-C, and ImageNet-C, focusing on the influence of the SE block's reduction scale.

🔼 This table presents a comparison of the prediction error rates (%) achieved by various test-time adaptation (TTA) methods on two benchmark datasets: CIFAR-10-C and ImageNet-C. The results are broken down by different types of image corruptions (e.g., noise, blur, weather effects, digital corruptions) applied to the datasets. The table allows for a direct comparison of the performance of the proposed L-TTA method with existing state-of-the-art (SOTA) TTA techniques. Additionally, it shows the memory usage (in MB) for each method, highlighting the memory efficiency of the proposed approach. ResNet-26 and ResNet-50 are used as backbone networks for the CIFAR-10-C and ImageNet-C experiments, respectively.
read the caption
Table 1: Comparisons of prediction error (%) with prior TTA methods on CIFAR-10-C with ResNet-26 and ImageNet-C with ResNet-50.

🔼 This table presents a comparison of the prediction error rates (%) achieved by various Test-Time Adaptation (TTA) methods on two benchmark datasets: CIFAR-10-C and ImageNet-C. The datasets are corrupted versions of CIFAR-10 and ImageNet, respectively, designed to evaluate model robustness to various image corruptions. The table shows the average error rates across 15 different corruption types for each method, using ResNet-26 for CIFAR-10-C and ResNet-50 for ImageNet-C. It allows for a quantitative comparison of the proposed L-TTA method against state-of-the-art (SOTA) TTA techniques in terms of prediction accuracy.
read the caption
Table 1: Comparisons of prediction error (%) with prior TTA methods on CIFAR-10-C with ResNet-26 and ImageNet-C with ResNet-50.

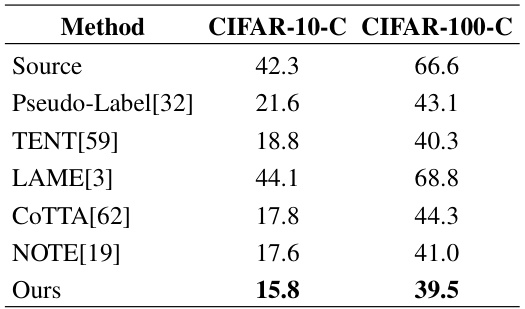
🔼 This table compares the prediction error rates of different Test-Time Adaptation (TTA) methods, including the proposed method, on the ResNet-50 model for CIFAR-10-C and CIFAR-100-C datasets. It shows the average prediction error across 15 types of corruptions for each method and also lists the memory usage. This allows for a comparison of accuracy and efficiency between various TTA approaches.
read the caption
Table 6: Comparisons of prediction error (%) with prior TTA methods on ResNet-50.

🔼 This table compares the prediction error rates (%) of the proposed L-TTA method with those of several other high-cost TTA methods. The comparison is made using the ResNet-50 model on two datasets: CIFAR-10-C and CIFAR-100-C, which are corrupted versions of the CIFAR-10 and CIFAR-100 datasets, respectively. The table highlights that the proposed method achieves competitive or superior performance compared to existing methods, while significantly reducing memory usage.
read the caption
Table 8: Comparison of Prediction Errors (%) between the proposed method and high-cost methodologies on ResNet-50.
Full paper#


