TL;DR#
The challenge of efficiently discovering and integrating new materials from widely dispersed scientific literature is addressed by this research. Traditional methods are costly and time-consuming, hindering rapid innovation. This necessitates advanced methods for information integration.
This research introduces the Materials Knowledge Graph (MKG) which utilizes large language models and natural language processing techniques to structure a decade’s worth of high-quality research. The MKG systematically organizes information into a structured format, enhancing data usability, streamlining materials research, and improving link prediction. This structured approach significantly reduces the reliance on traditional experimental methods and establishes the foundation for more sophisticated science knowledge graphs.
Key Takeaways#
Why does it matter?#
This paper is crucial for materials science researchers as it introduces a novel Materials Knowledge Graph (MKG) that efficiently integrates and organizes materials science knowledge. The MKG leverages large language models to overcome the challenges of scattered information, enabling more efficient discovery and potentially accelerating innovation in the field. This resource offers improved data usability, reduces reliance on traditional experimental methods, and lays the groundwork for more sophisticated science knowledge graphs, making it a valuable tool for researchers across multiple disciplines.
Visual Insights#

🔼 This figure shows the pipeline used for building the Materials Knowledge Graph (MKG). It starts with fine-tuning a Large Language Model (LLM) using a small amount of annotated data. Then, knowledge extraction is performed, integrating Named Entity Recognition (NER) and Entity Resolution (ER) tasks. The extracted concepts are organized into a well-defined ontology. Finally, the knowledge graph is completed through node similarity algorithms, enhancing its accuracy and predictive power. The three main tasks in the pipeline are Ontology Design, Knowledge Extraction, and Entity Resolution, each broken down into sub-tasks to show the methodology’s complexity.
read the caption
Figure 1: Pipeline of the fine-tuned LLM for knowledge graph tasks.

🔼 This table presents the performance of different fine-tuned Large Language Models (LLMs) on three tasks: Named Entity Recognition (NER), Relation Extraction (RE), and Entity Resolution (ER). The models are evaluated using precision, recall, and F1-score metrics for each task. The results demonstrate the relative effectiveness of each LLM in extracting and resolving entities and relations within the materials science domain.
read the caption
Table 1: Result of NER, RE, and ER through Fine-tuned LLMs.
In-depth insights#
MKG Architecture#
The Materials Knowledge Graph (MKG) architecture is centered around a meticulously designed ontology that categorizes materials information into key attributes like name, formula, structure, properties, and applications. This structure, likely represented as a graph database, facilitates efficient data integration and retrieval by connecting these attributes through well-defined relationships. The core strength lies in its ability to systematically organize vast quantities of materials science data from diverse sources. The use of advanced NLP techniques and large language models is crucial for extracting this information and converting unstructured textual data into structured triples for efficient storage and querying within the graph. This approach significantly improves data accessibility and usability. Furthermore, the architecture supports sophisticated network-based algorithms, enabling efficient link prediction and a reduced reliance on traditional experimental methods. The overall design emphasizes data traceability, ensuring that information within the graph is linked directly to its source.
LLM-NER-RE#
The heading ‘LLM-NER-RE’ suggests a methodology combining Large Language Models (LLMs) with Named Entity Recognition (NER) and Relation Extraction (RE). This approach likely leverages the power of LLMs for improved accuracy and efficiency in information extraction from unstructured text, particularly within a specific domain. LLMs provide contextual understanding, surpassing traditional methods that rely heavily on pattern matching. NER helps identify key entities within the text (e.g., materials, properties, applications), and RE establishes relationships between these entities. This integration is crucial for building knowledge graphs, which systematically organize information for easier access and analysis. The combined approach promises to streamline the creation of structured datasets, reduce manual annotation efforts, and facilitate advanced analysis within the targeted domain. The success of this methodology depends on the quality and quantity of training data, as well as the sophistication of the chosen LLM and NER/RE models. Scalability and generalizability are also key factors to consider.
Graph Completion#
Graph completion, in the context of knowledge graph construction for materials science, aims to predict missing links within the graph’s structure. This is crucial because real-world knowledge is inherently incomplete. The process typically involves sophisticated algorithms that leverage node similarity and contextual information to estimate the likelihood of relationships between entities. Effective graph completion enhances the graph’s predictive power, enabling more accurate inference of material properties and applications. Furthermore, it mitigates the reliance on purely experimental approaches, significantly accelerating materials discovery. However, it introduces complexities, requiring careful consideration of data quality, algorithm selection, and performance evaluation. The accuracy of the predictions directly impacts the overall reliability of the knowledge graph for downstream tasks such as material recommendation and hypothesis generation.
Experimental Setup#
An ‘Experimental Setup’ section in a research paper would detail the specifics of the methods used to conduct the experiments. This would include a description of the materials, instruments, and procedures employed. Crucially, it should provide enough detail that another researcher could replicate the study. This necessitates precision in specifying quantities, parameters, versions of software, and any relevant settings. Important considerations for a strong experimental setup include addressing potential biases and confounding variables, ensuring data quality through appropriate controls, and outlining the statistical methods for data analysis. Reproducibility is paramount; if a reader cannot replicate the experiment, the findings’ validity is compromised. The setup must be rigorously described to allow for critical evaluation and facilitate future research building upon the present work. Transparency is vital, thus disclosing any limitations or potential sources of error within the experimental design are essential.
Future Directions#
The future of materials science research hinges on advancing knowledge graph technologies to better integrate and analyze the vast amount of existing data. This requires addressing challenges in data standardization, efficient knowledge extraction from unstructured text, and developing more sophisticated algorithms for relationship prediction and inference. Incorporating temporal dynamics will provide a more comprehensive understanding of material evolution and behavior. Furthermore, exploring new data sources and integrating diverse data types (experimental, computational, and text-based) is crucial. This necessitates developing hybrid methods that combine the strengths of natural language processing with other machine learning approaches. Collaboration and interdisciplinary research will be paramount to successful knowledge graph development. The resulting integrated knowledge graphs will not only facilitate efficient material discovery but also enhance our understanding of fundamental scientific principles. Finally, ethical considerations must guide future development and usage of these powerful tools.
More visual insights#
More on figures

🔼 This figure illustrates the schema of the Materials Knowledge Graph (MKG) and a sample path within the graph. The schema (a) depicts the relationships between different node types including ‘Name’, ‘Formula’, ‘Acronym’, ‘Structure/Phase’, ‘Synthesis’, ‘Characterization’, ‘Property’, ‘Descriptor’, ‘Application’, and ‘DOI’. The example path (b) shows how the node ‘Copper Indium Gallium Selenide’ is connected to the node ‘Thin Films’ through intermediate nodes, indicating the material’s properties, synthesis methods, and applications.
read the caption
Figure 2: This schematic represents the (a) MKG schema and (b) an example of path in MKG between the 'Name' node 'Copper Indium Gallium Selenide' and 'Application' node 'Thin Films'.

🔼 This figure illustrates the process of graph completion in the Materials Knowledge Graph (MKG). Panel (a) details the four primary stages: graph splitting, similarity calculation, validation and evaluation, and parameter optimization. Each stage is shown schematically to explain the MKG refinement process. Panel (b) shows a schematic illustrating how node comparisons are made for link prediction, focusing on the similarity between Materials and Applications and incorporating components S(m,a), F(m,a), and T(m,a) for improved prediction specificity.
read the caption
Figure 3: (a)The process of MKG graph completion and (b) the schematic diagram of nodes comparison.

🔼 This figure compares the methodologies of MKG and MatKG2 for building knowledge graphs from materials science literature. MatKG2 uses a multi-step process for named entity recognition (NER) and relation extraction (RE), which does not preserve the original source information. In contrast, MKG uses a single large language model (LLM) for both NER and RE simultaneously, preserving the source and improving data quality. The figure visually depicts the different stages involved in both approaches, highlighting the differences in their processes and the resulting triples (subject, relation, object).
read the caption
Figure 4: Schematic comparison of MKG and MatKG2.

🔼 This figure shows two schematic diagrams of the Materials Knowledge Graph (MKG). Figure 5(a) presents a global view of the entire MKG, illustrating its vast interconnectedness and complexity. Figure 5(b) offers a more focused view, zooming in on a localized section of the graph to highlight the relationships between specific nodes (materials, applications, properties, etc.). The diagrams visually represent how the MKG integrates and organizes information from a wide range of materials science research.
read the caption
Figure 5: (a) Global schematic diagram of MKG; (b) Local schematic diagram of MKG.

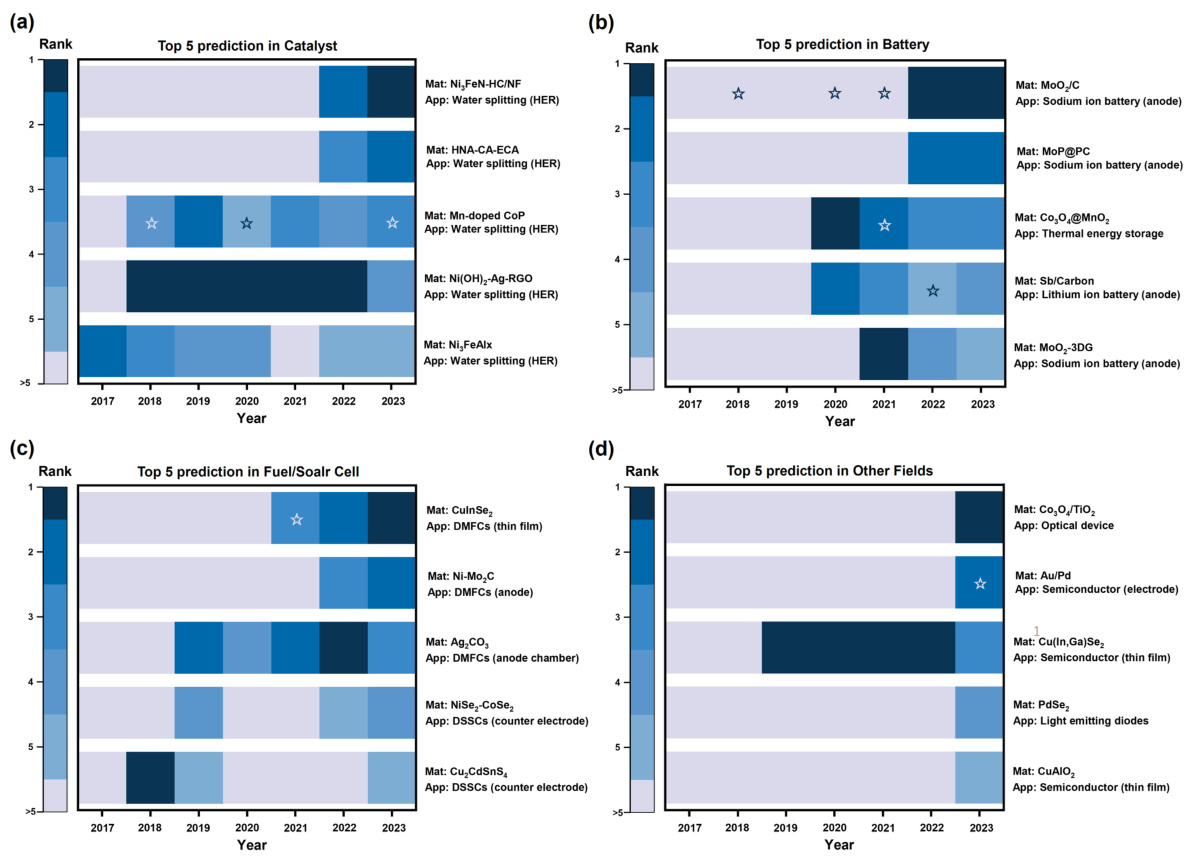
🔼 This figure presents the validation results for the graph completion process. Subfigure (a) shows a line graph illustrating the percentage of predicted material-application pairs that were subsequently reported in the literature over a period of 10 years, comparing three different similarity metrics used in the prediction. Subfigure (b) provides a table listing specific examples of predicted material-application pairs based on data from before 2018 that were later confirmed in the literature within 5 years.
read the caption
Figure 6: Validation of the graph completion. (a) Percentage of reported prediction after years. (b) Example of predicted material-application using data before 2018.

🔼 This figure illustrates the process of Materials Knowledge Graph (MKG) completion, which involves link prediction. (a) shows the four stages: graph splitting, similarity calculation, validation and evaluation, and parameter optimization. The enhanced Jaccard similarity metric is used, which consists of three components: structural similarity, feature overlap ratio, and time-based relevance. (b) provides a schematic diagram of the comparison between nodes in the graph for the link prediction process, highlighting the similarity between materials and applications.
read the caption
Figure 3: (a)The process of MKG graph completion and (b) the schematic diagram of nodes comparison.
More on tables

🔼 This table presents the results of an ablation study evaluating the impact of different entity resolution (ER) methods on the overall performance of the named entity recognition (NER), relation extraction (RE), and entity resolution tasks. The baseline is the Darwin model with normalization. Subsequent rows show the performance when removing components of the ER process: ER-N/F (removing Name/Formula entity resolution), ER-NF/A (removing Name/Formula/Acronym entity resolution), and ER-ED (removing the expert dictionary). The F1 score and the difference (Δ) from the baseline are reported for each task.
read the caption
Table 2: Result of the ablation experiment in normalization.

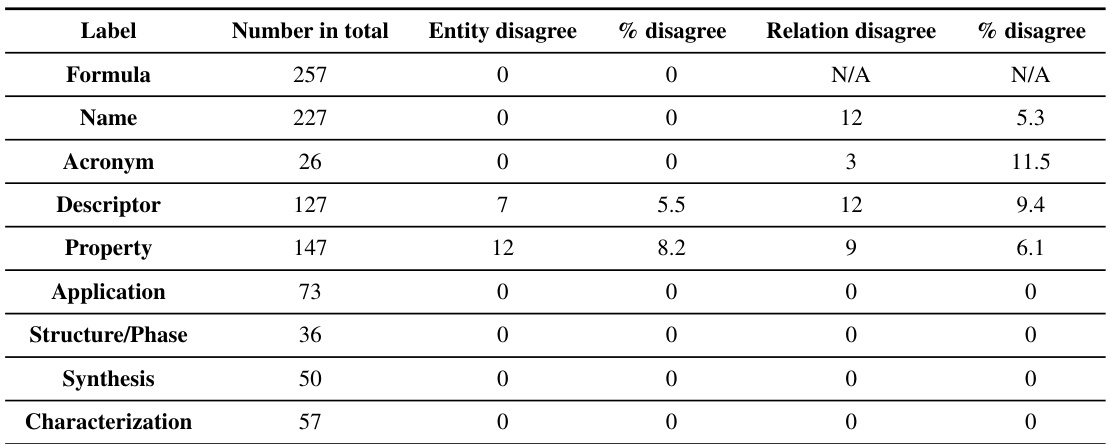
🔼 This table presents the results of a human evaluation performed on a randomly selected subset of 500 triples from the Materials Knowledge Graph (MKG). The evaluation assesses the accuracy of entity and relation labeling for various categories within the MKG, including ‘Formula’, ‘Name’, ‘Acronym’, ‘Descriptor’, ‘Property’, ‘Application’, ‘Structure/Phase’, ‘Synthesis’, and ‘Characterization’. The table shows the total number of instances for each category, the number of entities with disagreements, the percentage disagreement for entities, the number of relations with disagreements, and the percentage disagreement for relations. This data offers insights into the reliability and accuracy of the automated knowledge extraction and normalization processes used to construct the MKG.
read the caption
Table 3: Human evaluation metric on randomly selected triples.
Full paper#


