TL;DR#
Current methods for Intervention Target Estimation (ITE) struggle with collaborative learning from distinct intervention instances and incorporating insights from labeled data. This often leads to re-estimation when data or causal graphs change. This inefficiency hinders applications like root cause analysis in complex systems where similar incidents may have shared causal mechanisms.
DeepITE tackles this by using a variational graph autoencoder to concurrently learn from labeled and unlabeled data. This allows it to identify intervention targets immediately on unseen samples and new causal graphs, without retraining. The model significantly improves Recall@k metrics compared to existing methods, especially for large graphs, and benefits greatly from even small amounts of labeled data, thereby enhancing its practicality.
Key Takeaways#
Why does it matter?#
This paper is crucial for researchers working on causal inference and root cause analysis, particularly in complex systems. DeepITE’s innovative approach to intervention target estimation offers significant advantages in terms of efficiency and accuracy, addressing limitations of existing methods. The framework also opens new avenues for research in semi-supervised learning and variational graph autoencoders. This work will likely influence the development of more sophisticated and robust causal analysis methods applicable across various domains.
Visual Insights#

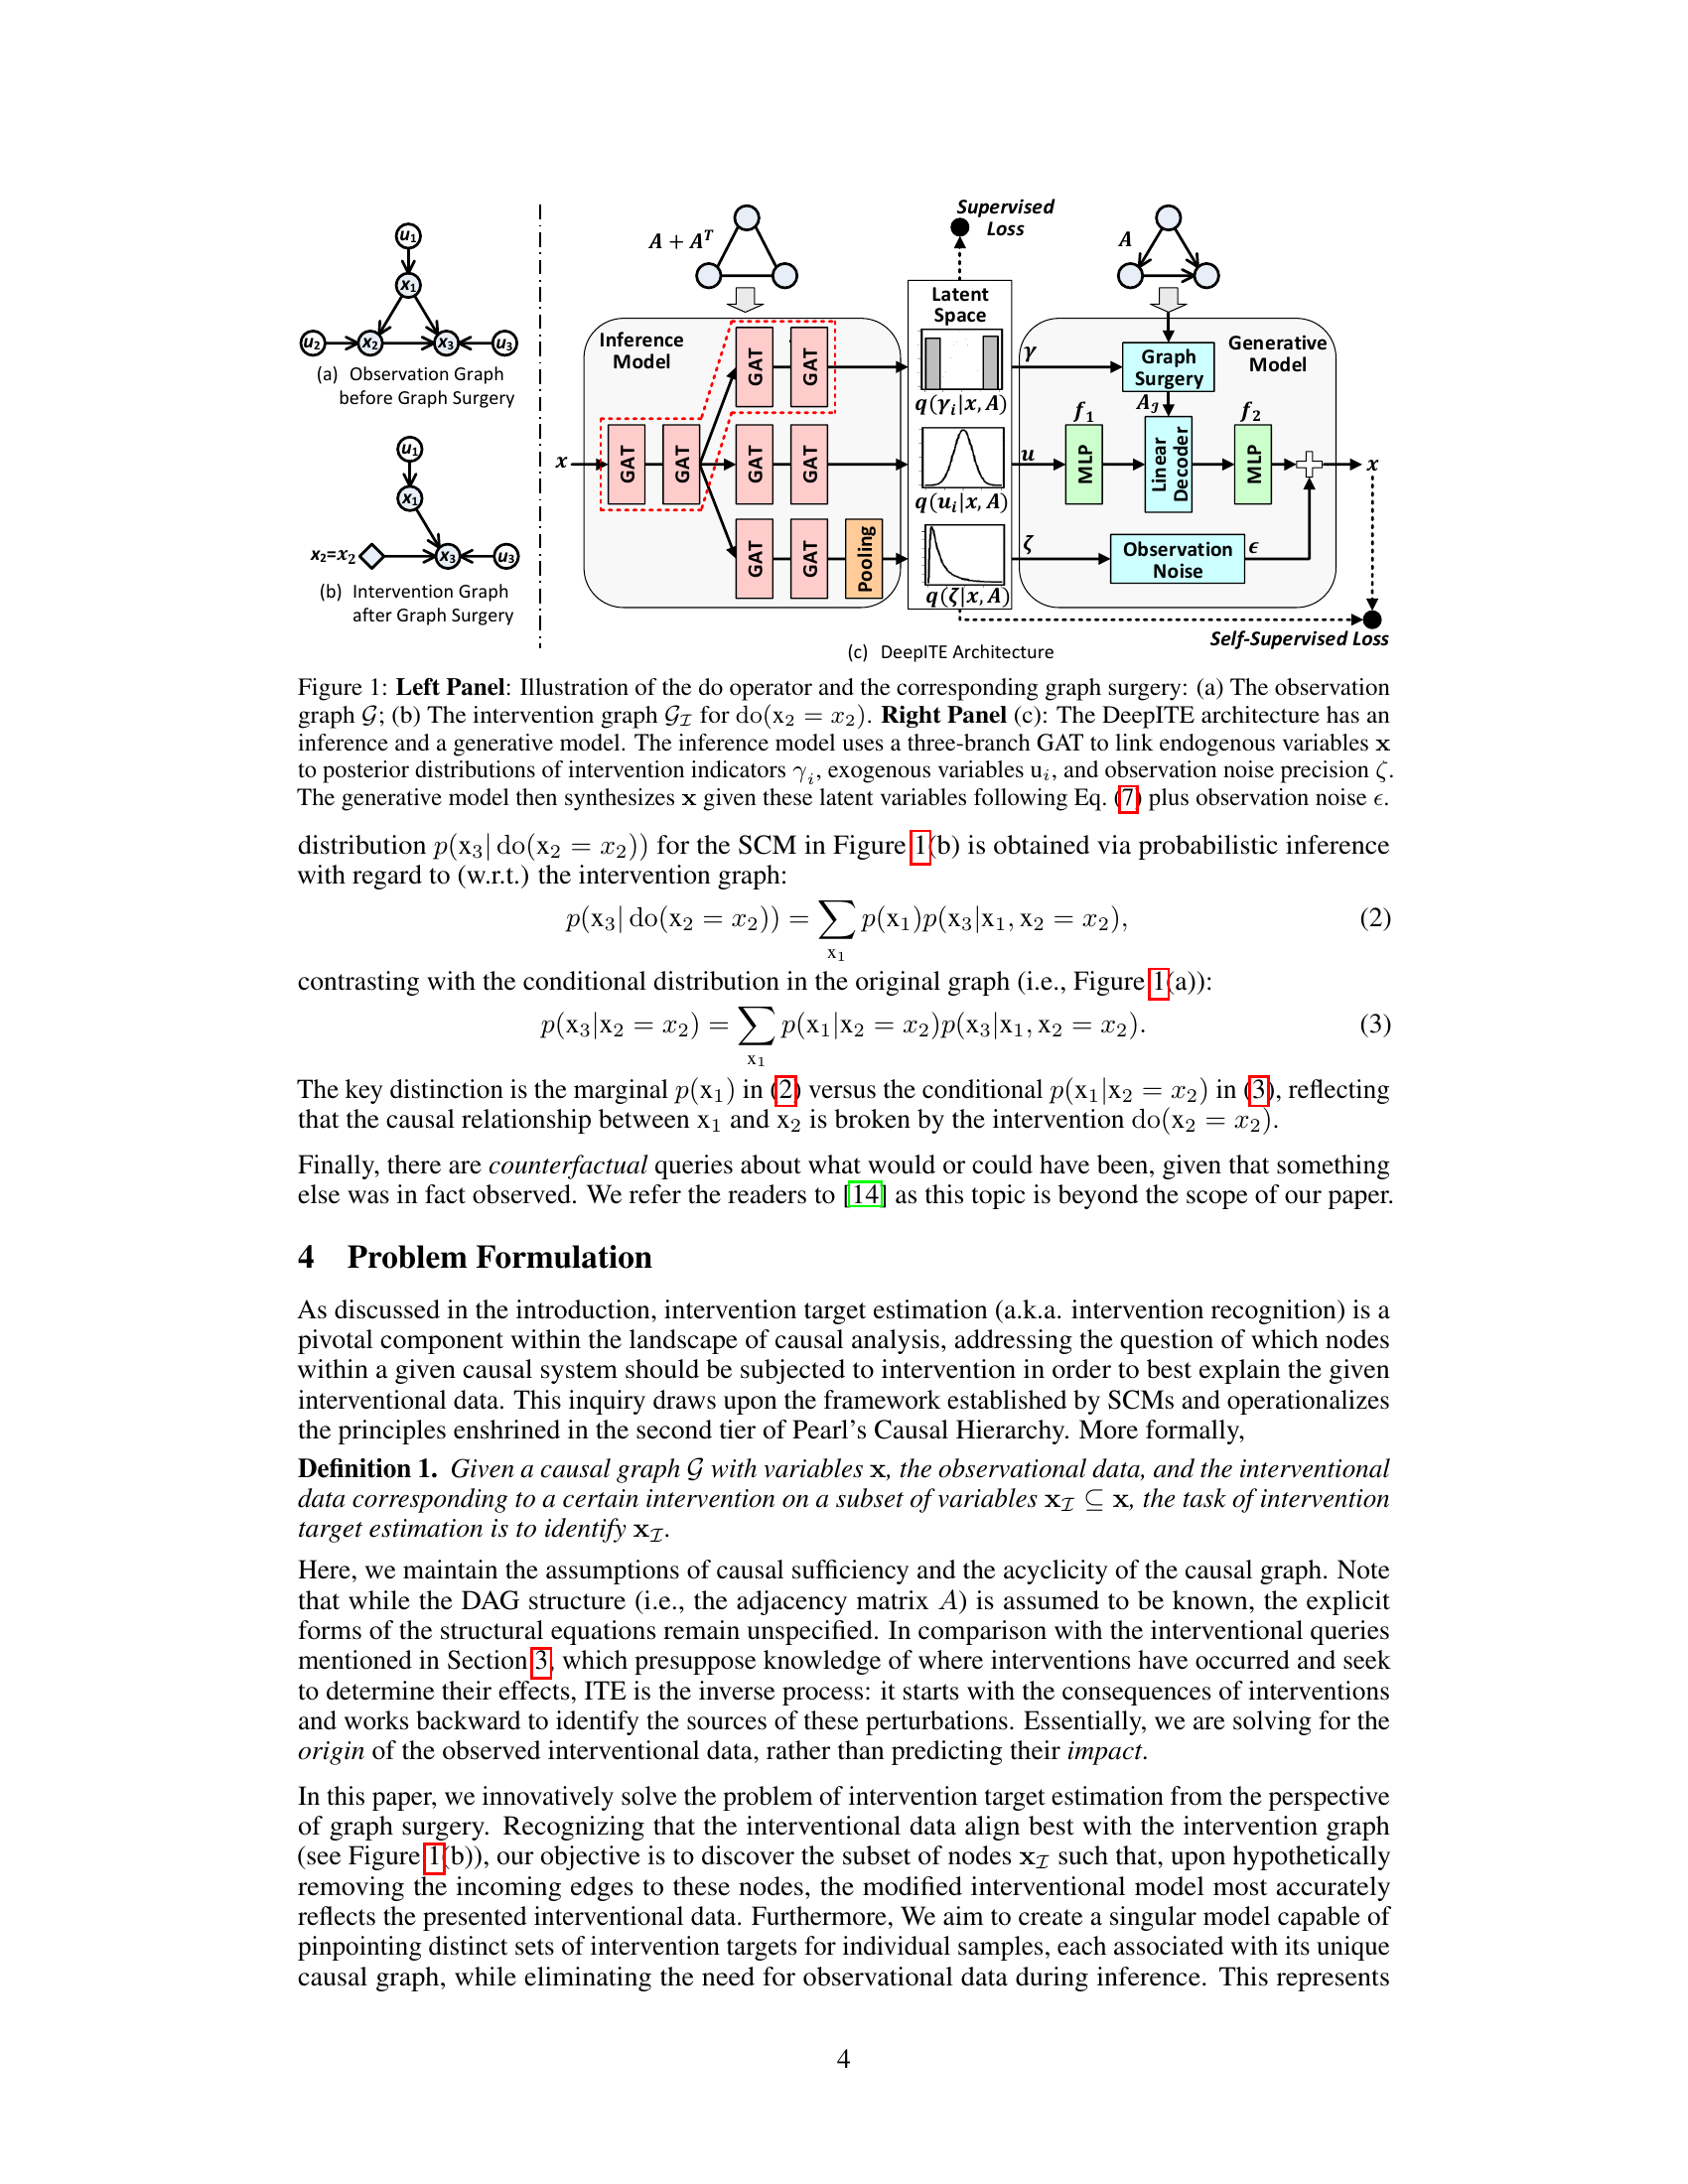
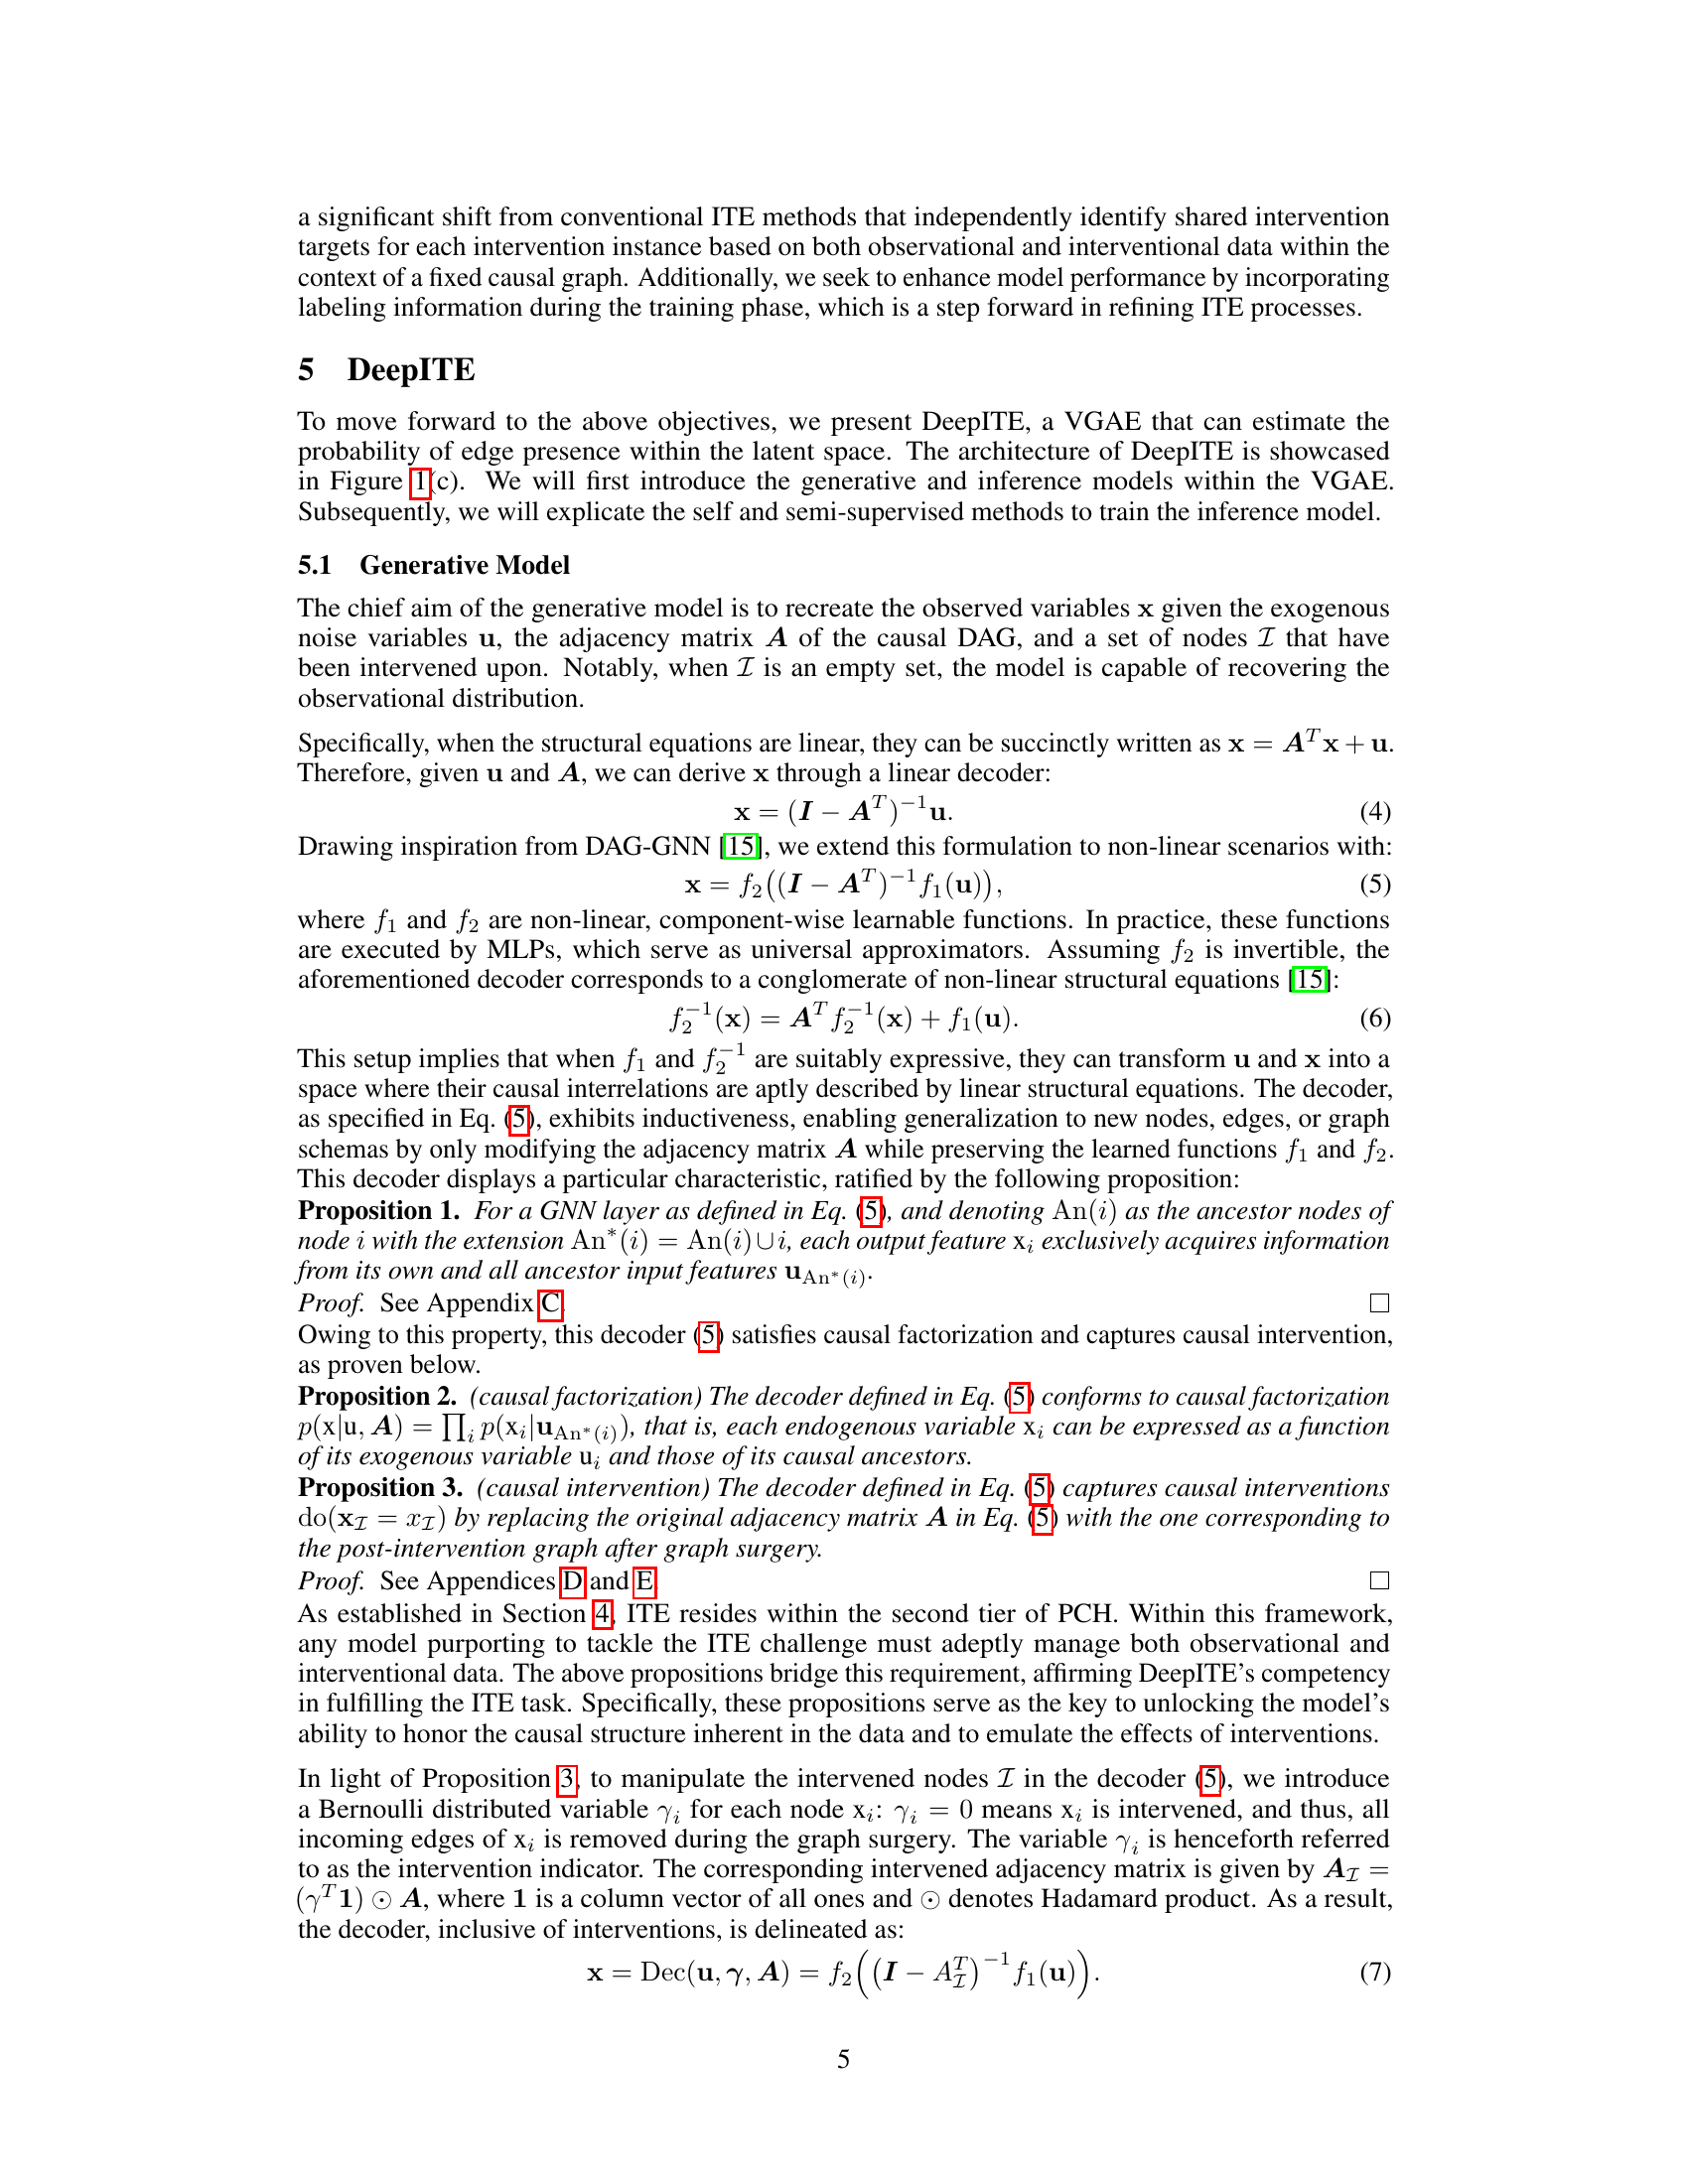
🔼 This figure illustrates the concept of graph surgery, showing how an intervention on a node in a causal graph modifies the graph structure. The left panel displays an observation graph and its modified version after an intervention. The right panel depicts the architecture of DeepITE, a variational graph autoencoder. DeepITE consists of an inference model and a generative model using Graph Attention Networks (GATs) to learn intervention targets from data. The inference model infers intervention indicators, exogenous variables, and observation noise. The generative model reconstructs the observed variables.
read the caption
Figure 1: Left Panel: Illustration of the do operator and the corresponding graph surgery: (a) The observation graph G; (b) The intervention graph G1 for do(X2 = x2). Right Panel (c): The DeepITE architecture has an inference and a generative model. The inference model uses a three-branch GAT to link endogenous variables x to posterior distributions of intervention indicators Yi, exogenous variables uż, and observation noise precision ζ. The generative model then synthesizes x given these latent variables following Eq. (7) plus observation noise €.
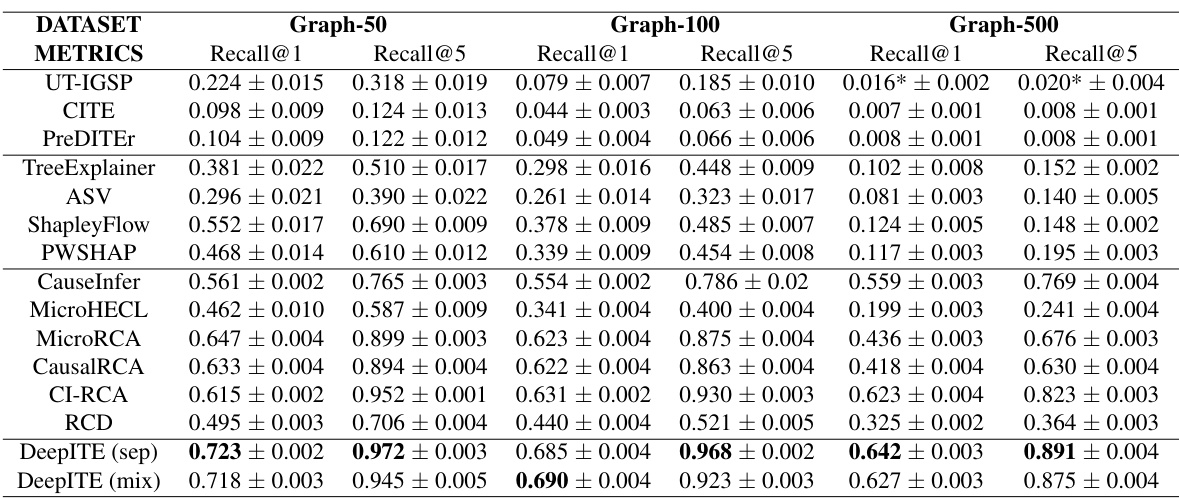
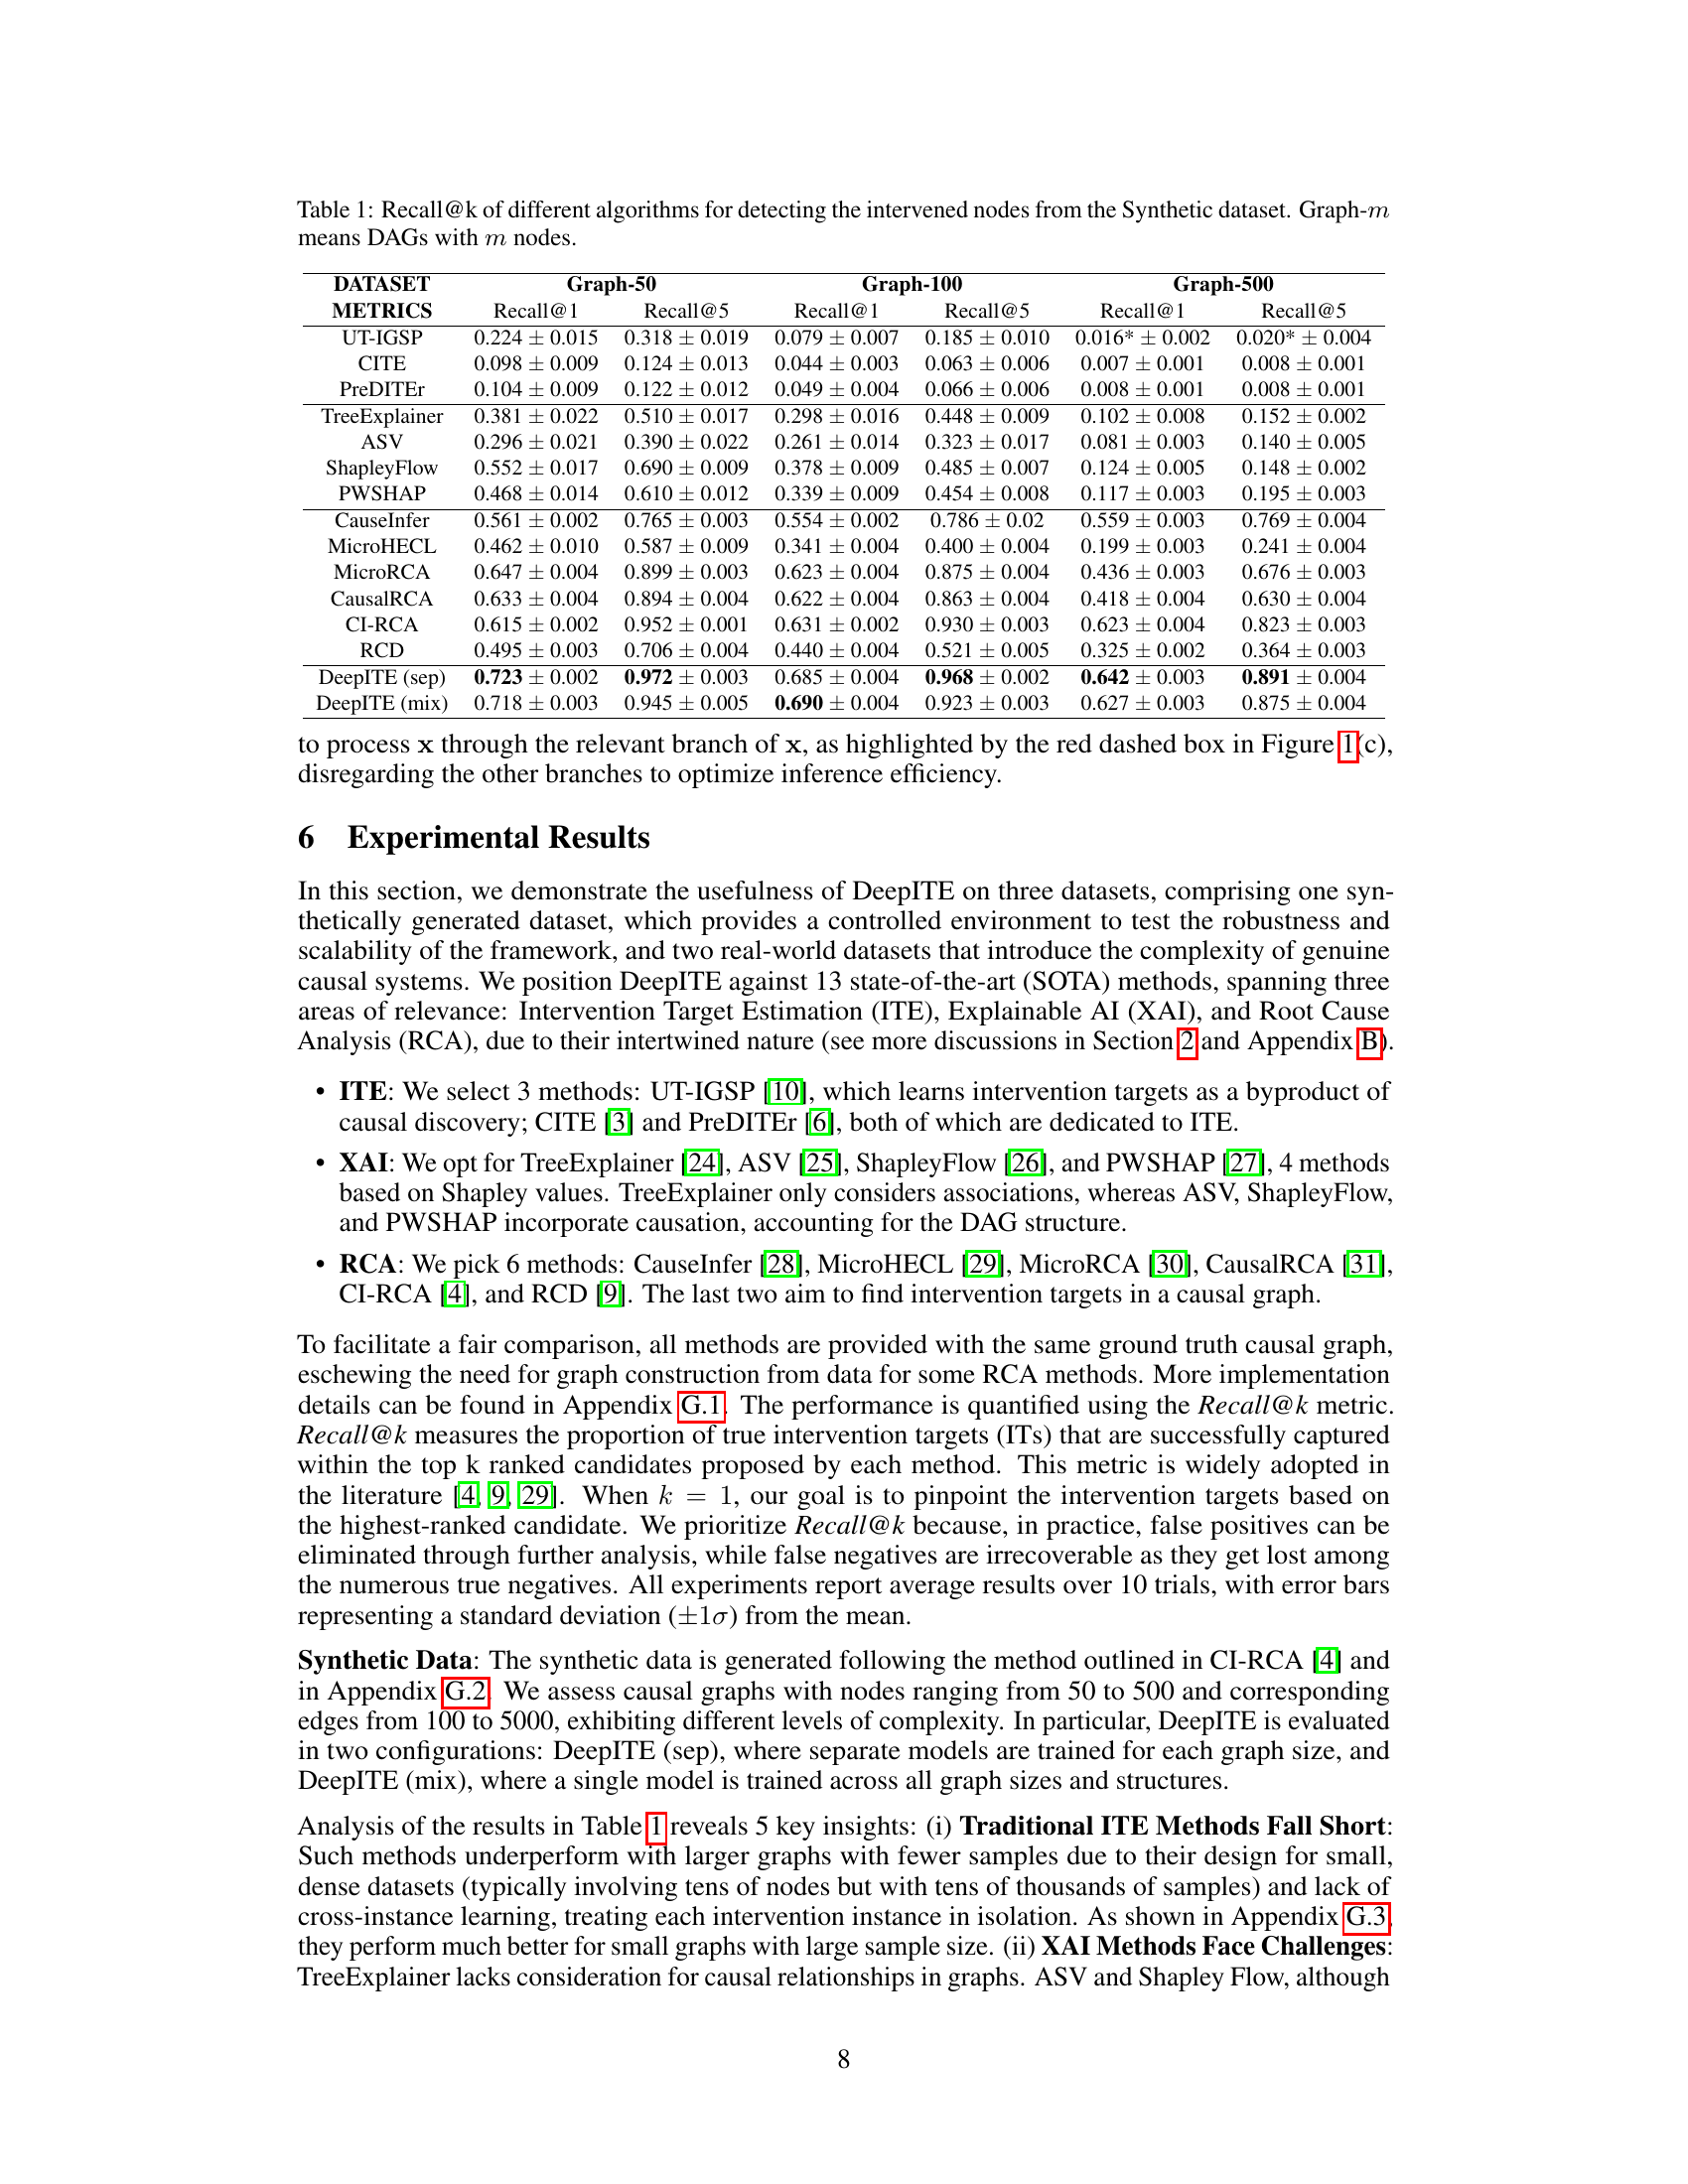
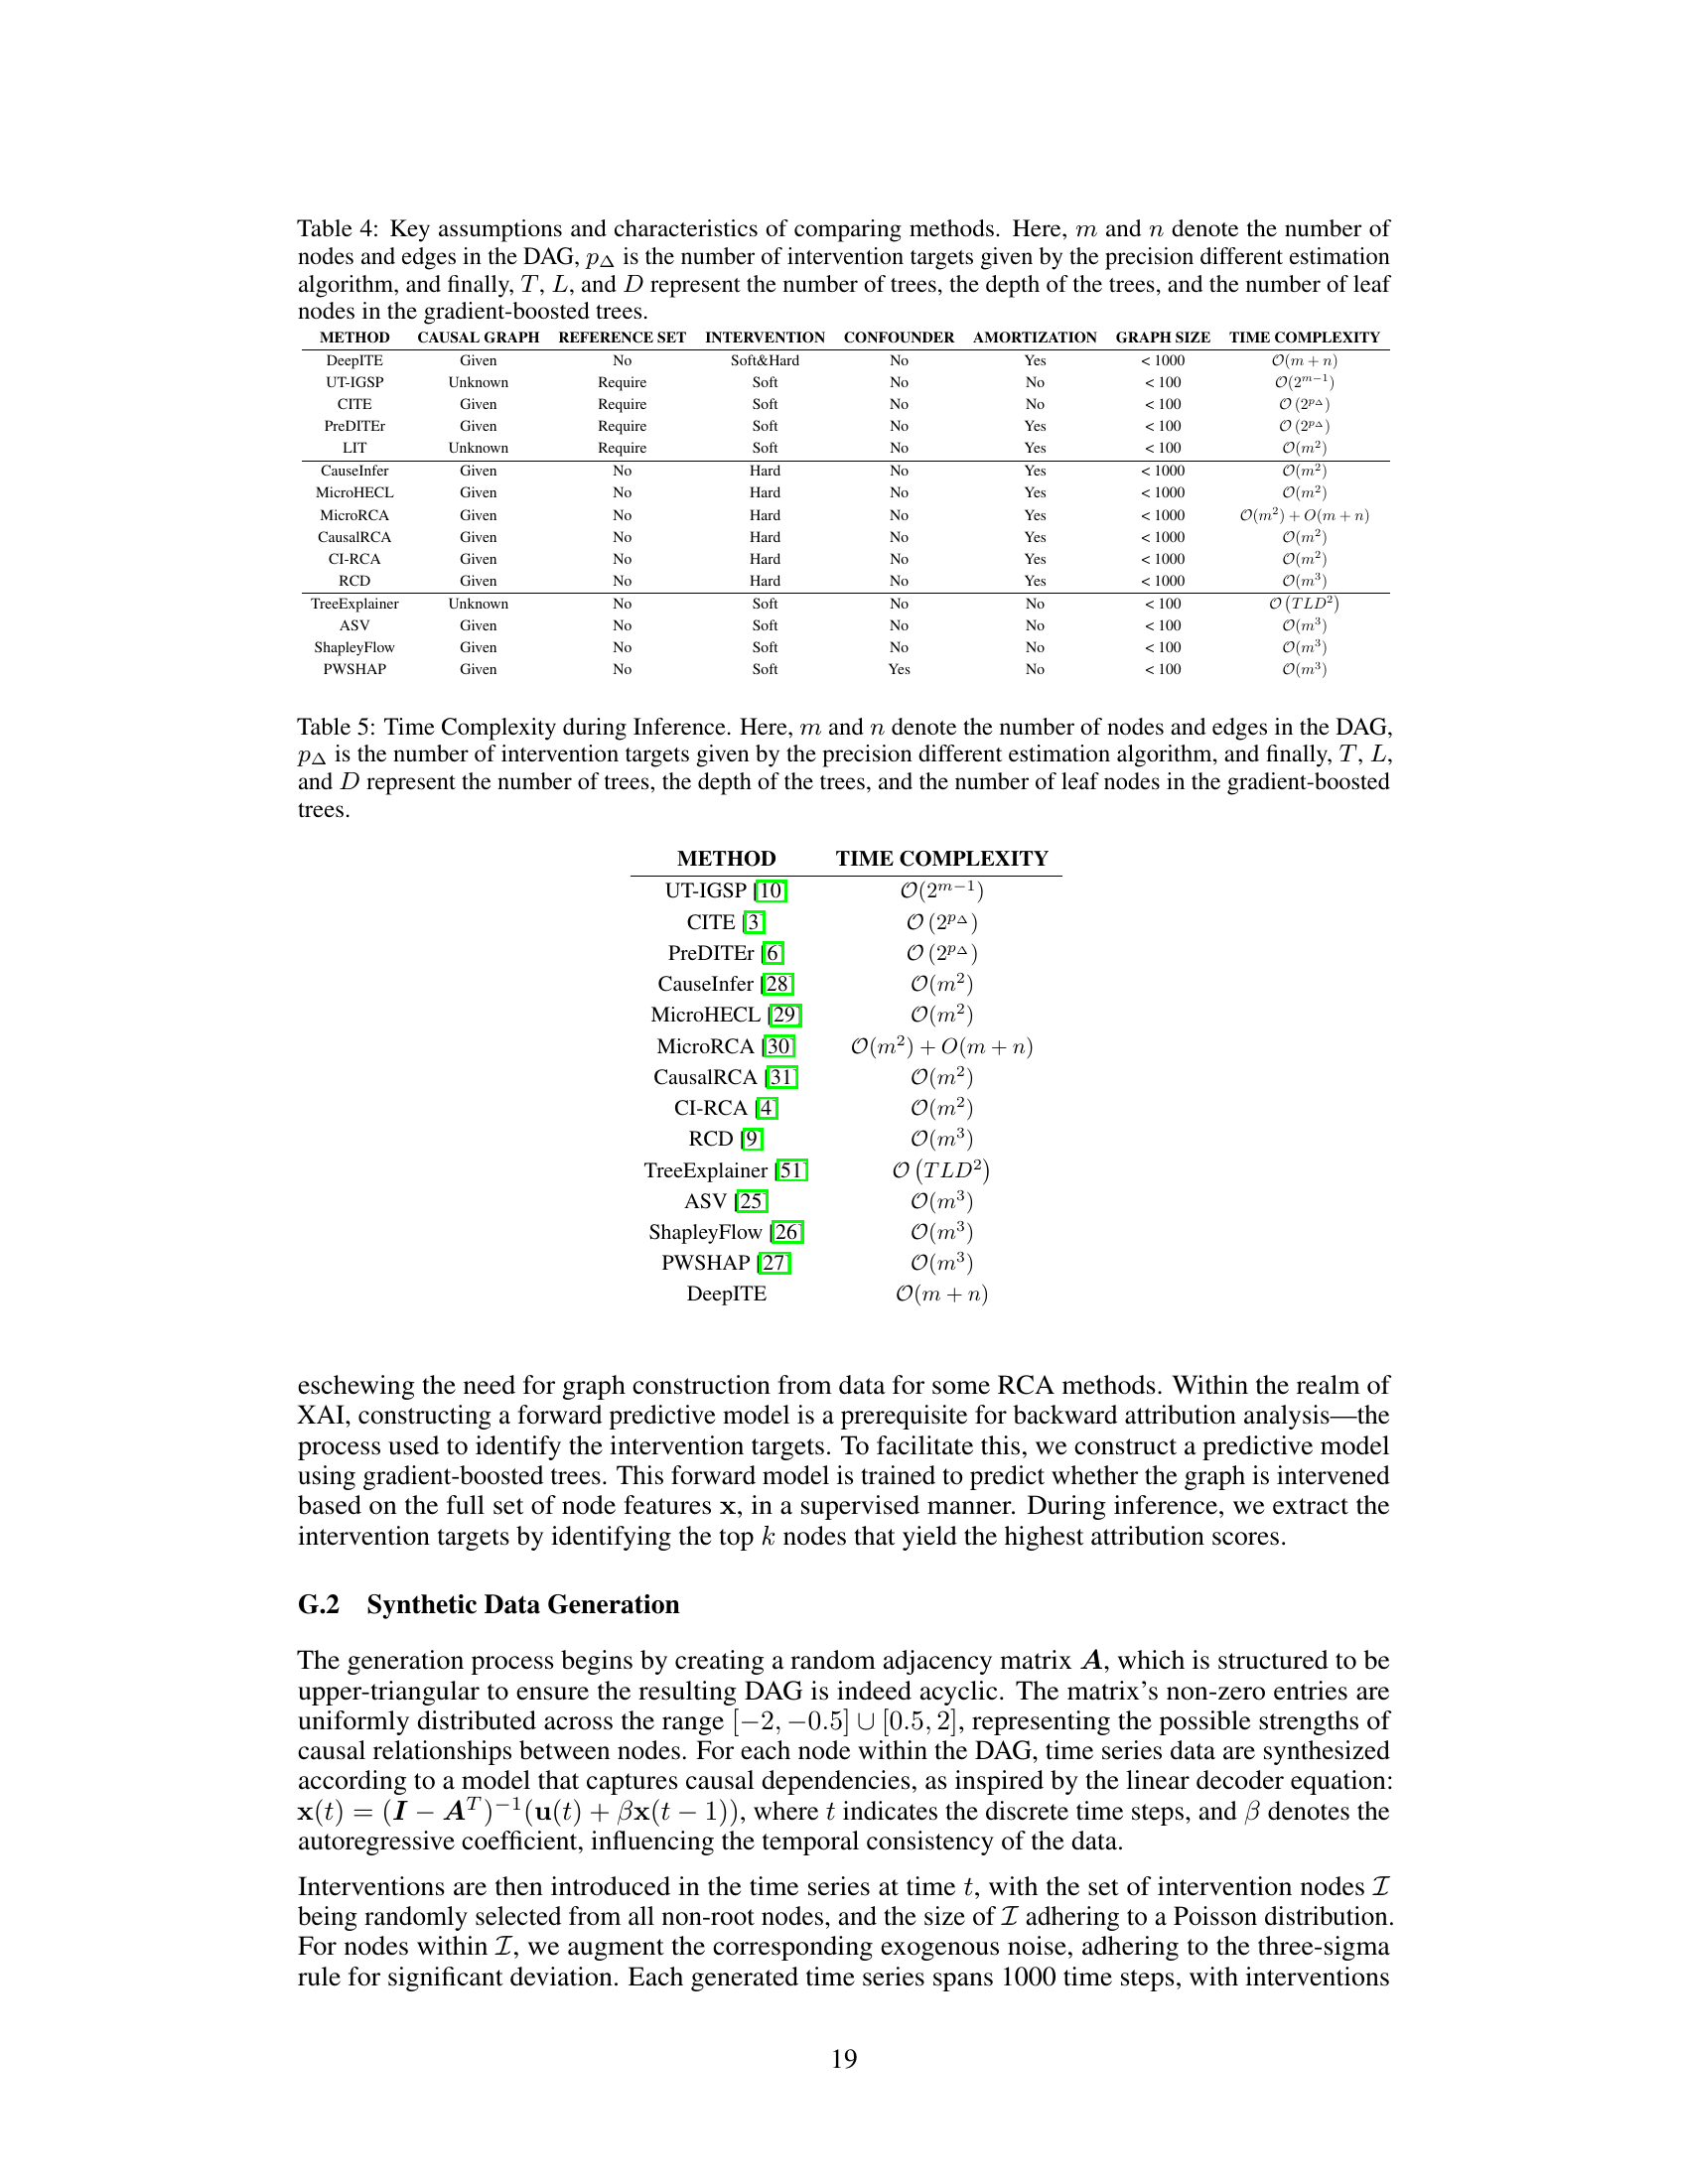
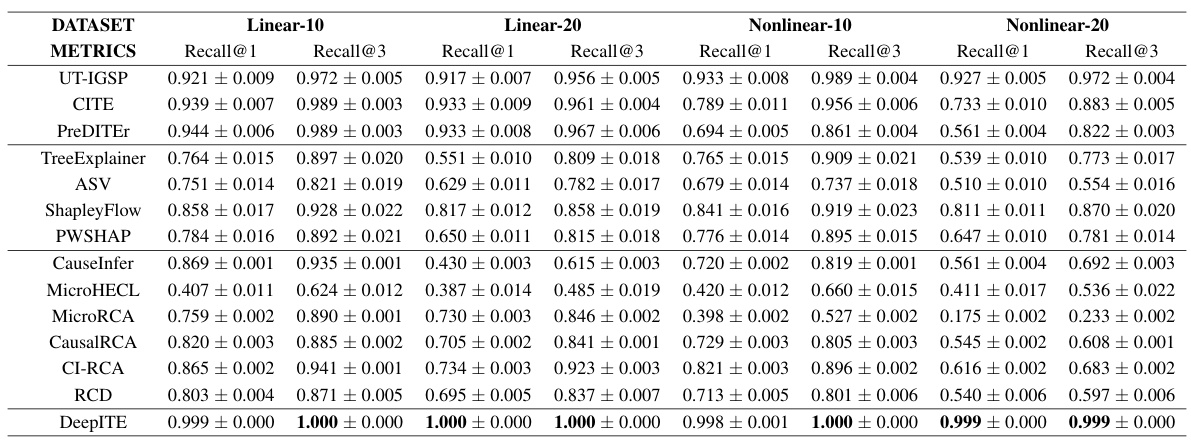
🔼 This table presents the Recall@k performance of different algorithms on synthetic datasets with varying graph sizes (50, 100, and 500 nodes). Recall@k measures how well the algorithms identify the top k intervened nodes. The algorithms are categorized into Intervention Target Estimation (ITE), Explainable AI (XAI), and Root Cause Analysis (RCA) methods. The table shows that DeepITE significantly outperforms all other methods, particularly in larger graphs.
read the caption
Table 1: Recall@k of different algorithms for detecting the intervened nodes from the Synthetic dataset. Graph-m means DAGs with m nodes.
In-depth insights#
DeepITE Framework#
The DeepITE framework, as described in the research paper, is a novel variational graph autoencoder (VGAE) designed for intervention target estimation (ITE). DeepITE’s core innovation lies in its ability to collaboratively learn from both labeled and unlabeled data across diverse causal graphs. This collaborative learning approach is crucial as it allows DeepITE to leverage correlations between different intervention instances, thereby avoiding the need for retraining when minor data changes or alterations in causal graphs occur. The framework’s inference capabilities enable swift identification of intervention targets on unseen samples and novel causal graphs without the requirement of retraining, a significant improvement over existing ITE methods. DeepITE’s architecture incorporates a generative and inference model, with the former constructing outputs given latent variables and the latter inferring latent variables from data and the causal graph. This design enables both self-supervised and semi-supervised learning, making DeepITE versatile and practical. The use of graph neural networks (GNNs) within the VGAE enhances the model’s adaptability to varied graph structures and sizes, further improving performance and scaling capabilities.
VGAE Architecture#
A Variational Graph Autoencoder (VGAE) architecture for intervention target estimation (ITE) would leverage the strengths of both Variational Autoencoders (VAEs) and Graph Neural Networks (GNNs). The VAE component would learn a latent representation of the input graph, capturing its underlying structure and relationships between nodes. Crucially, this latent space would need to be designed to explicitly model interventions, perhaps by incorporating a mechanism to represent the removal or addition of edges representing causal influences. The GNN component would operate on this latent representation, potentially using message-passing techniques to learn complex relationships between nodes and update the latent representation based on local neighborhoods. The decoder would then reconstruct the original graph from the latent representation. A key design consideration would be the ability to effectively capture the impact of interventions on the graph structure, enabling the model to accurately identify the intervention targets. The self-supervised learning approach could be implemented using techniques like the evidence lower bound (ELBO) to learn the latent representations from unlabeled data. Finally, this architecture can be extended for semi-supervised learning by incorporating labeled data in the training process, enhancing the model’s performance and accuracy.
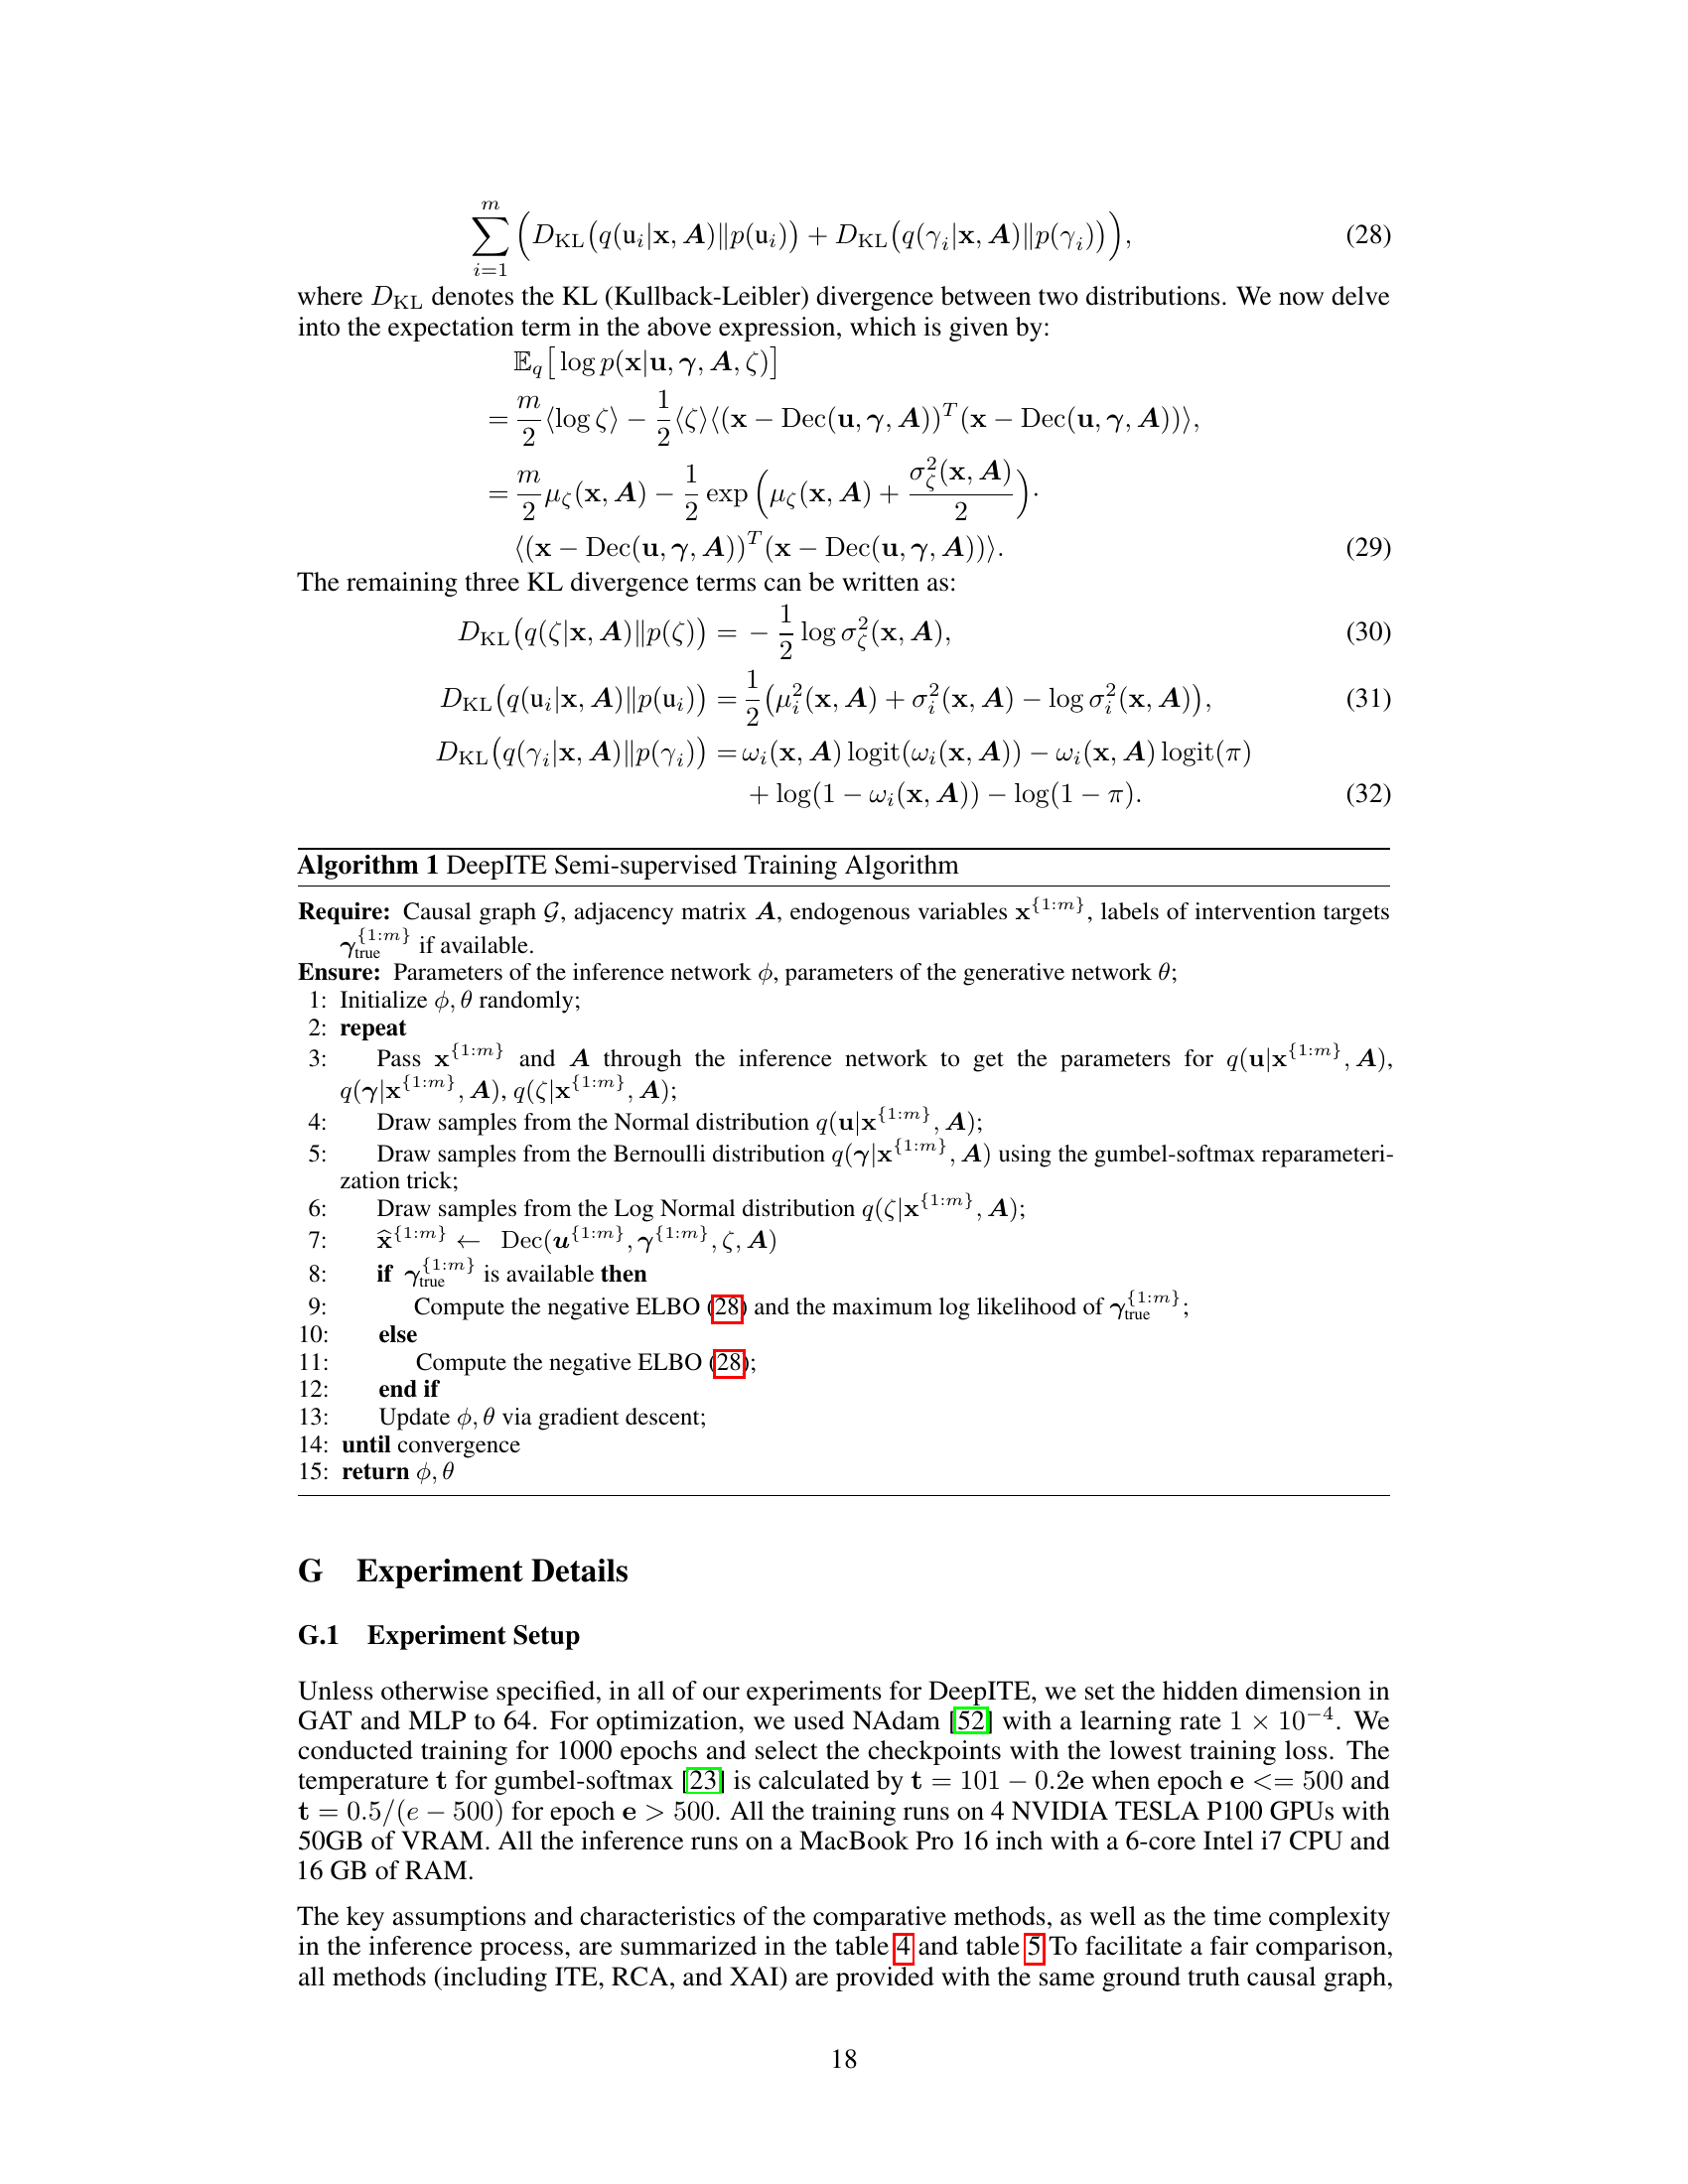
ITE Method Comparison#
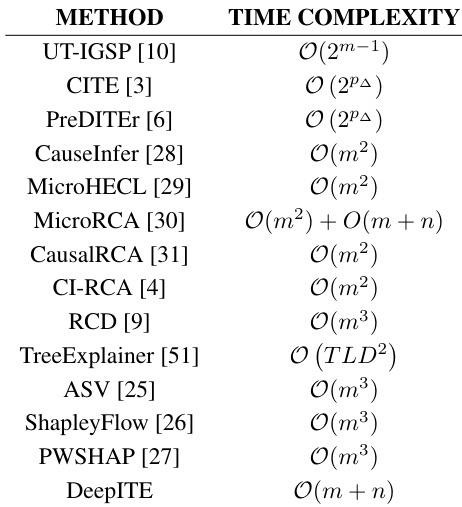
An ITE method comparison section would be crucial for evaluating DeepITE’s performance. It should involve a rigorous comparison against a wide range of existing methods, categorized by their approach (e.g., linear vs. non-linear SCMs, causal discovery-based, XAI-based, RCA-based). Key metrics for comparison should include Recall@k, inference time, and scalability to large graphs. The analysis should carefully consider the strengths and weaknesses of each method to provide a fair comparison. DeepITE’s advantages, such as collaborative learning and fast inference, should be highlighted relative to baseline methods with the aid of tables and graphs. The use of both synthetic and real-world datasets would build confidence in DeepITE’s generalizability and practical applicability. Finally, a discussion of limitations of both DeepITE and the alternative methods is critical for a balanced evaluation. This section would ultimately demonstrate DeepITE’s competitive edge and its suitability for real-world applications.
Ablation Study#
An ablation study systematically removes components of a model to assess their individual contributions. In the context of this research paper, an ablation study on DeepITE would likely involve removing or modifying parts of the variational graph autoencoder (VGAE) architecture, such as the graph attention networks (GATs), the generative model, the inference model, or the way interventions are incorporated. The goal is to isolate the impact of each component and quantify its effect on performance. For example, removing the generative model would test the inference model’s robustness, or changing the GATs may measure the influence of graph structure on accurate intervention target identification. By comparing the performance of the original model against these modified versions, the researchers can obtain a deeper understanding of the mechanisms underlying DeepITE’s success and pinpoint which aspects are most crucial for optimal results. Moreover, this methodology could assess the model’s efficiency, identifying potential redundancy or bottlenecks, leading to a more streamlined design. Finally, ablation studies are essential for demonstrating the model’s overall robustness and for suggesting areas for potential improvement in future iterations.
Future Directions#
Future research could explore DeepITE’s applicability to more complex causal structures, such as those with hidden confounders or cyclic relationships, which are prevalent in real-world systems. Addressing these scenarios would significantly broaden DeepITE’s applicability and enhance its practical value. Another promising direction is investigating DeepITE’s performance with different types of interventions, beyond the hard and soft interventions considered in this work. This would involve evaluating DeepITE’s ability to learn from interventions that affect the system’s dynamics in less-defined ways. Furthermore, research could focus on developing more efficient inference methods for DeepITE, especially for extremely large-scale graphs where computational cost becomes a significant bottleneck. Finally, combining DeepITE with techniques for automatic causal structure learning could create a fully automated system for intervention target estimation, eliminating the need for manual graph specification. This would improve usability and scalability, bringing automated causal analysis to more widespread adoption.
More visual insights#
More on tables
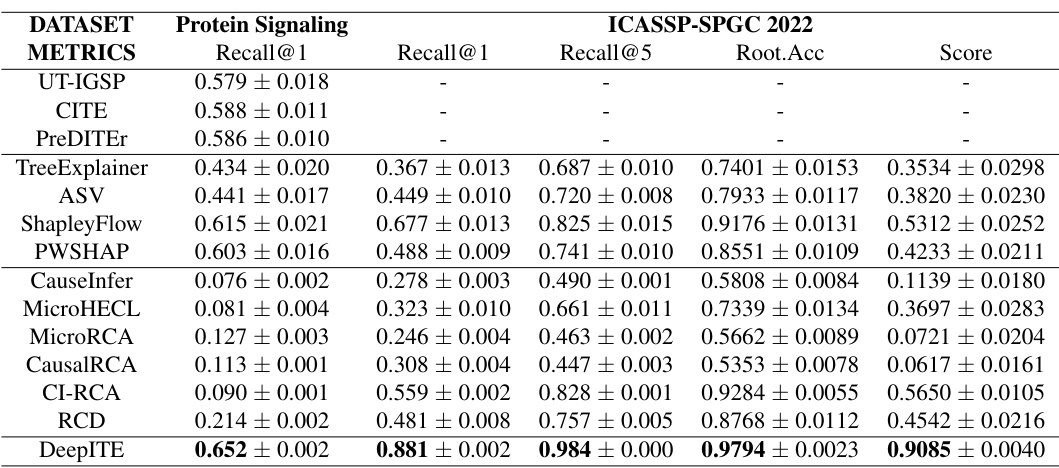
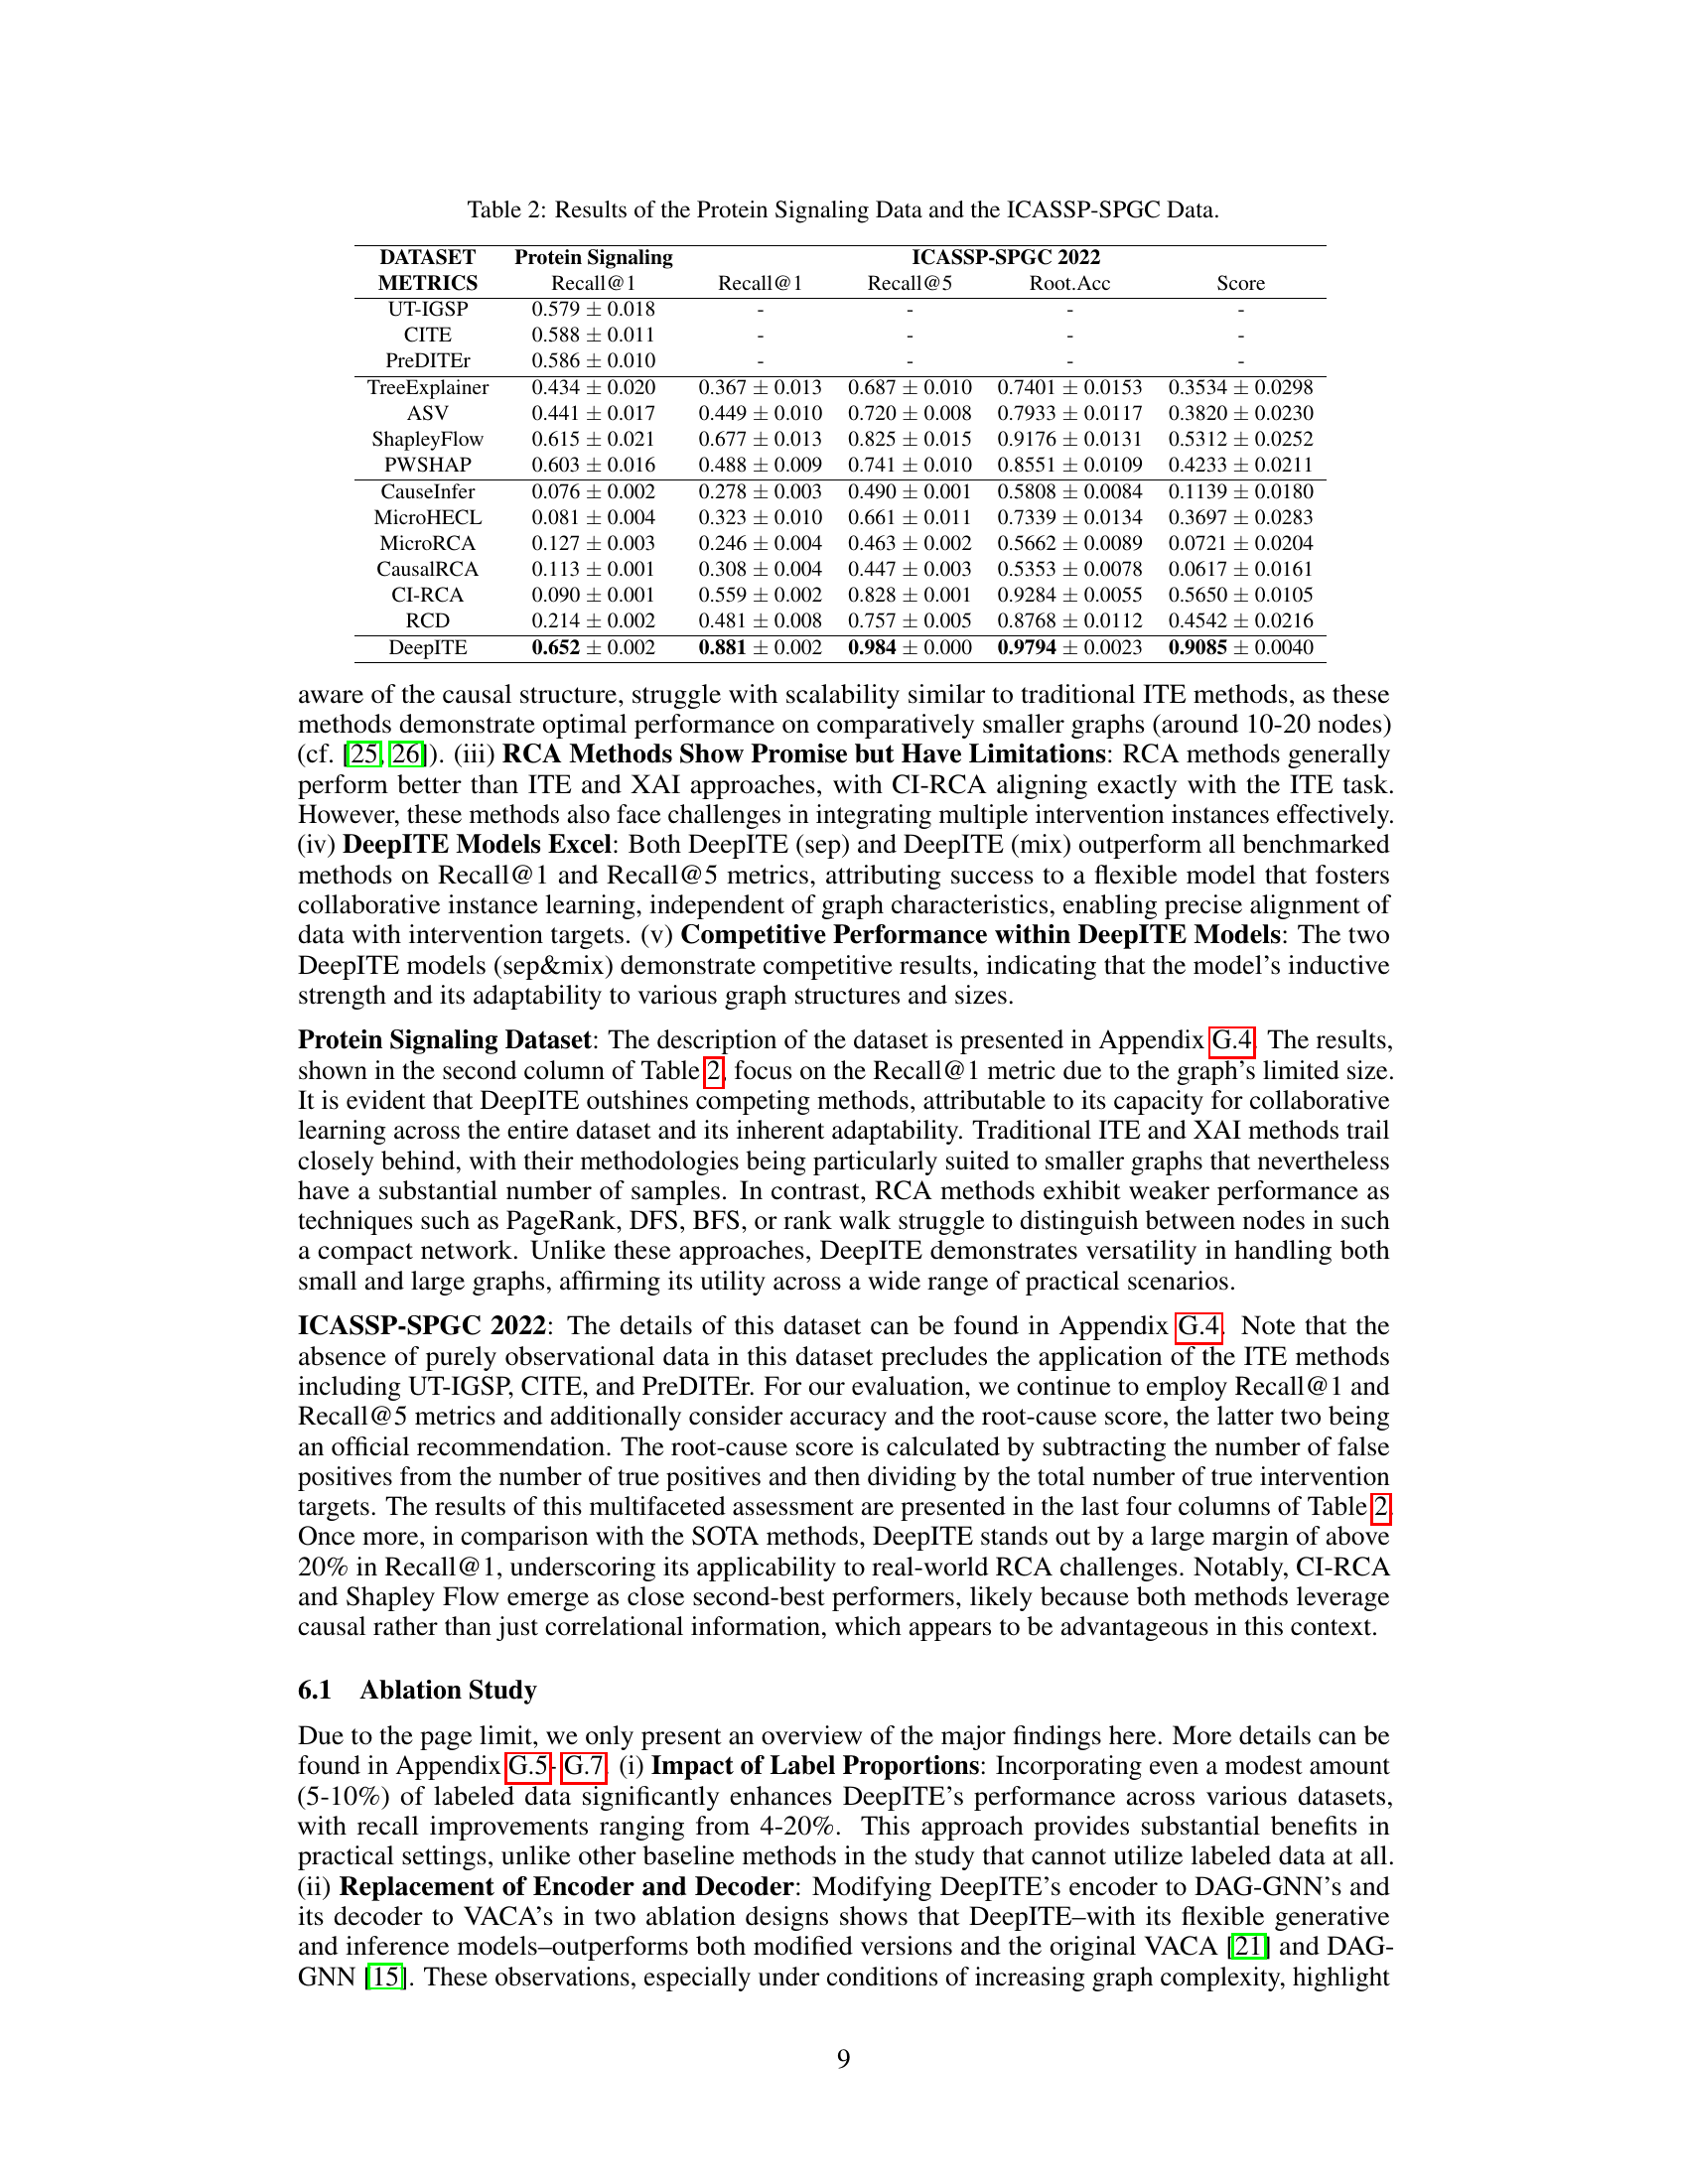
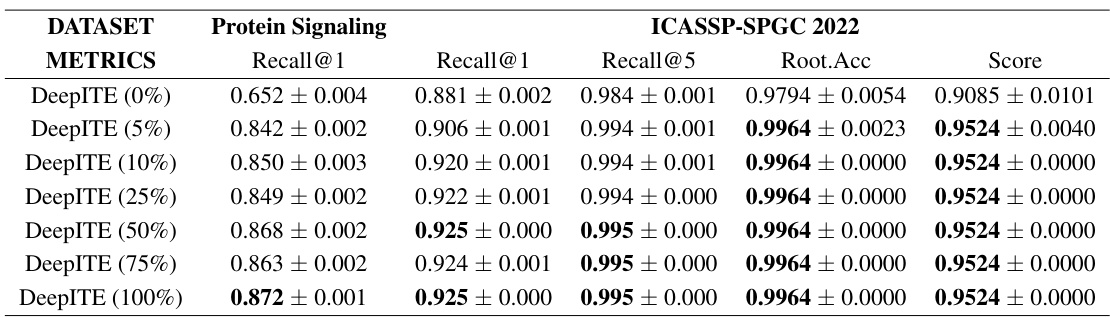
🔼 This table presents the results of the proposed DeepITE model and thirteen baseline methods on two real-world datasets: Protein Signaling and ICASSP-SPGC 2022. The metrics used for evaluation include Recall@1, Recall@5, Root Accuracy, and a combined Score. The table compares the performance of DeepITE against methods from Intervention Target Estimation (ITE), Explainable AI (XAI), and Root Cause Analysis (RCA).
read the caption
Table 2: Results of the Protein Signaling Data and the ICASSP-SPGC Data.
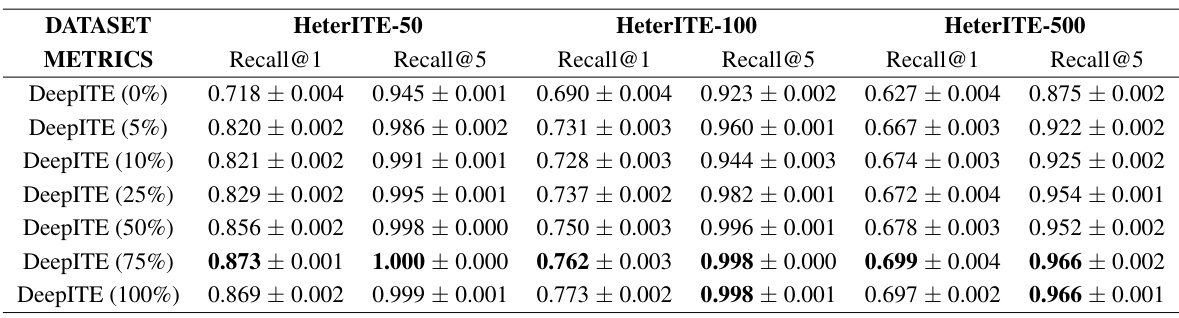
🔼 This table presents the Recall@k scores for thirteen different algorithms (including DeepITE) across three different graph sizes (50, 100, and 500 nodes) in a synthetic dataset. Recall@k measures the proportion of correctly identified intervened nodes among the top k ranked nodes by each algorithm. The results demonstrate DeepITE’s superior performance compared to existing methods, particularly for larger graphs.
read the caption
Table 1: Recall@k of different algorithms for detecting the intervened nodes from the Synthetic dataset. Graph-m means DAGs with m nodes.
🔼 This table presents the Recall@k scores achieved by DeepITE and 13 other baseline methods on a synthetic dataset. The dataset consists of synthetically generated directed acyclic graphs (DAGs) with varying numbers of nodes (50, 100, 500). Recall@k measures the proportion of correctly identified intervened nodes among the top k ranked nodes. The results demonstrate DeepITE’s superior performance compared to the baseline methods in identifying intervened nodes across different graph sizes.
read the caption
Table 1: Recall@k of different algorithms for detecting the intervened nodes from the Synthetic dataset. Graph-m means DAGs with m nodes.
🔼 This table presents the Recall@k scores of 14 different algorithms (including DeepITE) for identifying intervened nodes in synthetic datasets. Recall@k measures the proportion of correctly identified intervened nodes among the top k ranked nodes. The datasets vary in size (Graph-50, Graph-100, Graph-500), representing different complexities of the causal graphs. The results show DeepITE’s superior performance compared to the other methods across different graph sizes.
read the caption
Table 1: Recall@k of different algorithms for detecting the intervened nodes from the Synthetic dataset. Graph-m means DAGs with m nodes.
🔼 This table presents the Recall@k values for 13 different algorithms in identifying intervened nodes within synthetic datasets. The datasets vary in size (Graph-50, Graph-100, Graph-500) representing the number of nodes in the directed acyclic graphs (DAGs) used to generate the data. Recall@k is a metric that measures the percentage of correctly identified intervened nodes among the top k ranked nodes predicted by each algorithm. Higher Recall@k values indicate better performance.
read the caption
Table 1: Recall@k of different algorithms for detecting the intervened nodes from the Synthetic dataset. Graph-m means DAGs with m nodes.
🔼 This table presents the Recall@k (the proportion of correctly identified intervention targets within the top k ranked candidates) achieved by DeepITE and 13 other baseline methods across three synthetic datasets of varying graph sizes (50, 100, 500 nodes). The baseline methods represent state-of-the-art approaches in Intervention Target Estimation (ITE), Explainable AI (XAI), and Root Cause Analysis (RCA). DeepITE significantly outperforms all baselines, especially for larger graphs.
read the caption
Table 1: Recall@k of different algorithms for detecting the intervened nodes from the Synthetic dataset. Graph-m means DAGs with m nodes.
🔼 This table presents the Recall@k performance of DeepITE and 13 other baseline methods across three synthetic datasets with varying graph sizes (50, 100, and 500 nodes) for intervention target estimation. Recall@k measures the proportion of correctly identified intervention targets within the top k ranked candidates. The results show DeepITE’s superiority in Recall@k compared to the baseline methods.
read the caption
Table 1: Recall@k of different algorithms for detecting the intervened nodes from the Synthetic dataset. Graph-m means DAGs with m nodes.
🔼 This table presents the Recall@k values for various algorithms in identifying intervened nodes within a synthetic dataset, comparing their performance across different graph sizes (50, 100, 500 nodes). Recall@k represents the proportion of correctly identified intervened nodes among the top k ranked predictions. The table highlights DeepITE’s superior performance compared to 13 baseline methods.
read the caption
Table 1: Recall@k of different algorithms for detecting the intervened nodes from the Synthetic dataset. Graph-m means DAGs with m nodes.
🔼 This table presents the Recall@k metric (a measure of the ability to correctly identify the intervened nodes) for 14 different algorithms on synthetic datasets with varying graph sizes (50, 100, and 500 nodes). The results show DeepITE’s superior performance compared to other methods.
read the caption
Table 1: Recall@k of different algorithms for detecting the intervened nodes from the Synthetic dataset. Graph-m means DAGs with m nodes.
Full paper#