↗ OpenReview ↗ NeurIPS Homepage ↗ Chat
TL;DR#
Single-cell genomics, while powerful, faces challenges in data integration due to limitations of current Optimal Transport (OT) methods. Existing neural OT solvers often lack flexibility and struggle with scalability and out-of-sample estimation. Discrete OT solvers suffer from scalability and privacy issues. This paper introduces GENOT (Generative Entropic Neural Optimal Transport), a novel framework designed to address these challenges.
GENOT learns stochastic transport maps (plans), allowing flexible cost function choices, relaxing mass conservation constraints, and integrating quadratic solvers to handle the complexities of (Fused) Gromov-Wasserstein problems. It leverages flow matching for efficient computation and demonstrates improved versatility and robustness across various single-cell applications, showcasing significant potential for advancements in therapeutic strategies. The approach is evaluated in different single-cell scenarios and surpasses existing neural OT solvers.
Key Takeaways#
Why does it matter?#
This paper is crucial for single-cell genomics researchers as it presents GENOT, a novel and versatile neural optimal transport framework. GENOT addresses limitations of existing methods by providing flexibility in cost functions, handling of unbalanced data, and adaptability to both linear and quadratic optimal transport problems. This opens new avenues for analyzing complex single-cell data, improving model interpretability, and facilitating the development of enhanced therapeutic strategies.
Visual Insights#

This figure illustrates the task of generating RNA cell profiles from ATAC measurements and additional cell features using the Fused Gromov-Wasserstein (FGW) formulation. The left panel shows a schematic overview of the problem, while the right panel details the generative approach used by GENOT, demonstrating how a learned flow maps from a noise distribution to a conditional distribution which captures both structural and feature information about the cells.

This table presents the average ranks of different optimal transport methods in estimating the ground-truth entropic optimal transport coupling between Gaussian distributions in various dimensions and entropic regularization parameters. The performance is measured using two metrics: Bures-Wasserstein Unexplained Variance Percentage (BW2-UVP) and conditional Bures-Wasserstein Unexplained Variance Percentage (cBW2-UVP). Detailed results for each metric are provided in Tables 2 and 3.
In-depth insights#
Entropic Gromov Flow#
Entropic Gromov flows offer a powerful framework for analyzing complex data distributions where traditional methods fail. By combining the strength of optimal transport with the flexibility of Gromov-Wasserstein distance, they address the challenge of comparing probability measures supported on spaces with differing geometries. The entropic regularization ensures numerical tractability and enables the estimation of stochastic transport plans, providing a probabilistic view of the underlying relationships. This approach finds applications in various fields, including single-cell genomics, where it allows for the alignment of data across multiple modalities and the reconstruction of cellular trajectories. The ability to handle unbalanced settings is particularly valuable in biological applications, where cellular growth, death, and variations in the total amount of mass are common. Overall, entropic Gromov flows provide a significant advancement in handling complex data analysis problems while offering robustness and flexibility.
Neural OT Solvers#
Neural Optimal Transport (OT) solvers represent a significant advancement in addressing the limitations of traditional discrete OT methods, particularly within the context of large-scale single-cell genomics data. Traditional discrete solvers struggle with scalability, privacy concerns, and out-of-sample estimation. Neural OT solvers offer a solution by leveraging neural networks to parameterize the OT maps, enabling faster computation and improved flexibility. However, existing neural OT methods often lack the flexibility needed for broader applications, frequently restricting themselves to specific cost functions or neglecting the stochastic nature of biological processes. Specifically, many models restrict their focus to Monge maps (deterministic mappings), while single-cell systems exhibit stochastic behavior. Therefore, a key improvement is to focus on learning stochastic maps (i.e., transport plans) to capture the inherent uncertainty in biological data. Furthermore, the capacity to handle various cost functions and to relax mass conservation constraints is crucial for effectively modeling complex biological phenomena such as cell growth and death. Ultimately, the flexibility and robustness of neural OT methods are essential for unlocking the full potential of OT in diverse fields like single-cell genomics.
Single-Cell Genomics#
Single-cell genomics is a revolutionary field that enables the study of individual cells within a complex biological system. Its power lies in its ability to overcome the limitations of traditional bulk analysis, which averages the signals from millions of cells, obscuring the heterogeneity and subtle differences between individual cells. This technique allows researchers to uncover the diversity of cell types, states, and functions within a tissue or organism. It has greatly advanced our understanding of cellular behavior in health and disease, leading to breakthroughs in developmental biology, immunology, cancer research, and neuroscience. Technological advancements in single-cell sequencing, particularly in RNA sequencing and other omics technologies, continue to push the boundaries of what is possible in this field. However, challenges remain, including data processing, scalability, and cost, necessitating the development of new computational methods, such as the ones presented in the paper, that can efficiently analyze and interpret the complex single-cell data sets generated by modern single cell technologies. The future of single-cell genomics holds enormous potential for personalized medicine and the development of novel therapies.
GENOT Framework#
The GENOT framework offers a novel approach to neural optimal transport, addressing limitations of existing methods in single-cell genomics. GENOT’s key innovation lies in its ability to learn stochastic transport plans (couplings), rather than deterministic mappings. This allows for a more realistic representation of cellular behavior, incorporating inherent stochasticity and uncertainty. Furthermore, GENOT provides flexibility in choosing cost functions, accommodating the non-Euclidean nature of biological data. Its ability to handle unbalanced optimal transport enables modeling of cell growth, death, and outliers. Finally, GENOT’s extension to the (fused) Gromov-Wasserstein problem facilitates cross-modality alignment, a crucial task in single-cell genomics where multiple data modalities need to be integrated. This comprehensive framework makes GENOT a powerful tool for advancing single-cell analysis and precision medicine.
Future Directions#
Future research could explore improving GENOT’s scalability to handle even larger single-cell datasets, perhaps through more efficient neural network architectures or by leveraging distributed computing. Another promising direction lies in developing more sophisticated cost functions that better capture the complex relationships between different cellular modalities. Incorporating additional biological information into the OT framework, such as prior knowledge about cell lineages or regulatory networks, could further enhance the accuracy and interpretability of the results. Investigating the theoretical properties of GENOT, such as its convergence rate and generalization capabilities, would strengthen its foundation. Finally, applying GENOT to a wider array of single-cell genomics problems beyond those presented in the paper would solidify its value as a versatile and powerful tool for the field.
More visual insights#
More on figures

This figure shows the results of applying GENOT to model cell trajectories. The left panel displays the source cells from the early time points, samples of the conditional distributions learned using GENOT with geodesic and Euclidean distances (projected onto a UMAP), and biological assessments (TSI and CT error). The right panel shows a UMAP colored by the uncertainty score of each source cell, illustrating the uncertainty estimation capability of GENOT.

This figure demonstrates two key aspects of the proposed GENOT model. The left panel shows the accuracy of the U-GENOT-L model for predicting cellular responses to various cancer drugs under different levels of unbalancedness, showing its robustness. The right panel illustrates GENOT-Q’s ability to map a complex 3D data distribution (Swiss roll) to a 2D one (spiral), successfully minimizing distortion and preserving the structure of the data through a learned quadratic optimal transport coupling. This showcases its effectiveness in handling non-Euclidean data and non-linear mappings.

This figure presents a benchmark of GENOT-Q against discrete Gromov-Wasserstein for translating between ATAC and RNA modalities. The left panel shows the performance metrics (FOSCTTM and Sinkhorn divergence) for both l2 and geodesic distance cost functions across different dimensions. The right panel shows UMAP visualizations comparing GENOT-F (using optimal transport) and a GENOT model trained without optimal transport (randomly mixed cells). The results demonstrate the effectiveness of GENOT-Q and the importance of optimal transport for accurate cell type clustering.

This figure compares the performance of GENOT and OT-CFM in learning the optimal transport coupling between two Gaussian mixtures using the Coulomb cost. The left panel shows the ground truth diagonal coupling, the middle panel shows GENOT’s accurate reconstruction of this coupling, and the right panel illustrates OT-CFM’s failure to preserve the structure of the mini-batch couplings, highlighting GENOT’s superiority.

This figure shows the impact of batch size on the Bures-Wasserstein Unexplained Variance Percentage (BW2-UVP). It demonstrates the influence of batch size on the accuracy of the GENOT-L model in approximating entropic optimal transport couplings. The results are compared to a larger batch size (2048, dotted line) for various dimensions and entropy regularization parameters.

This figure displays the results of an ablation study on the number of samples drawn from the conditional distribution for each source data point. The study evaluates how well GENOT performs when varying the number of samples used to estimate the conditional distribution. The results are compared to the performance of the model when only one sample per point is used (k=1), as presented in Table 3. The study assesses the impact of this parameter on accuracy, and how well the model performs in different dimensions and with various entropy regularization parameters.

This figure shows the results of applying GENOT to model cell trajectory in the mouse pancreas. The left panel shows a UMAP visualization of a source cell and samples from its conditional distributions using two different cost functions (geodesic and Euclidean). The TSI score and CT error (discussed in section C.2 and Figure 9) assess the accuracy of the model’s predicted cell trajectory. The right panel shows the same UMAP colored by the uncertainty score (cos-var) for each source cell, indicating the confidence in the predicted trajectory.

This figure demonstrates the impact of choosing different cost functions on the quality of the generated samples. The left side displays samples from the Ngn3 Low EP population and generated samples using the geodesic cost function and the squared Euclidean distance. The right side shows the proportions of each cell type (alpha, beta, delta, epsilon) that originate from the Ngn3 Low and Ngn3 High populations. The results highlight the superior performance of the geodesic cost function in capturing the underlying biological dynamics.

This figure shows a schematic of the proposed method GENOT. The left panel illustrates the overall goal: generating RNA cell profiles from ATAC measurements and additional cell features. This involves mapping between two partially incomparable spaces (ATAC and RNA), using Fused Gromov-Wasserstein (FGW) to handle the structural differences between the spaces while using the cell features as a shared component. The right panel details the approach: GENOT learns a stochastic map, represented as a flow, to transport samples from a noise distribution to the conditional distribution of the target space, allowing the generation of both structural information (RNA) and features.

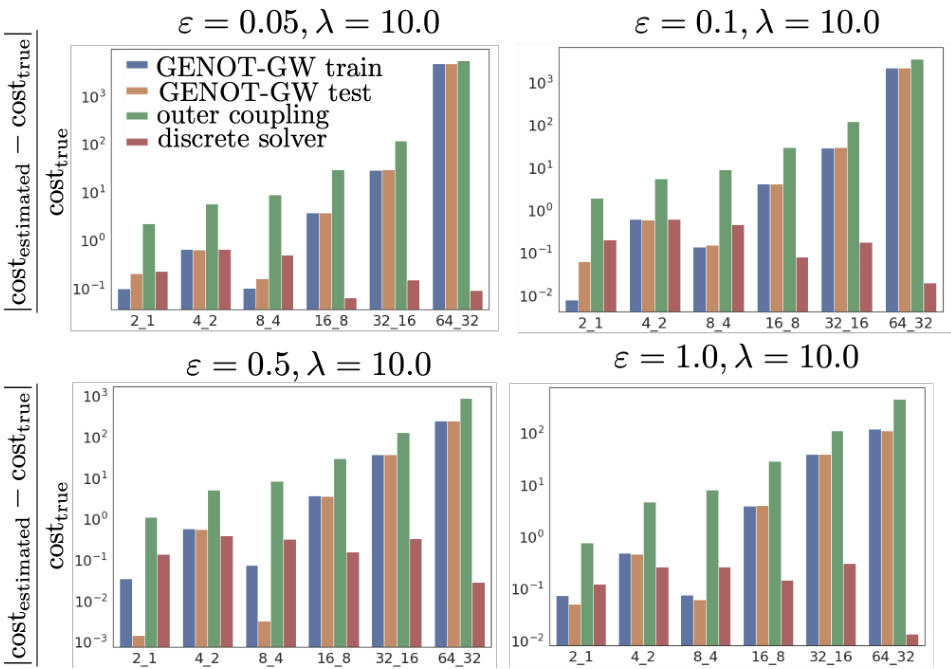
This figure compares the performance of U-GENOT-L and SUOT (a baseline method) on learning unbalanced entropic optimal transport plans between Gaussian distributions. The comparison is done across various dimensions, entropy regularization strengths (ε), and unbalancedness parameters (λ). The results highlight the effectiveness of U-GENOT-L in this challenging task, showcasing its ability to handle unbalanced optimal transport and learn accurate couplings even with varying parameter settings.

This figure shows the calibration score for the predictions made by GENOT-L on a dataset of cellular responses to 163 cancer drugs. The calibration score measures the agreement between the model’s predicted uncertainty and the actual accuracy of its predictions. A calibration score of 1 indicates perfect calibration (high uncertainty for incorrect predictions, low uncertainty for correct predictions). The figure shows a histogram of the calibration scores for each drug, indicating that the model is well-calibrated for a majority of the drugs, though some drugs exhibit lower calibration scores. This analysis suggests that the model provides reliable uncertainty estimates, which is important for decision-making in single-cell genomics.

This figure illustrates the task and method of GENOT. The left panel shows the overall task: generating RNA cell profiles from ATAC measurements and additional cell features using Fused Gromov-Wasserstein (FGW). The right panel details the method by showing how GENOT learns a flow from noise to conditional distributions to sample structural and feature information, highlighting this process for a specific example.

This figure demonstrates the accuracy and versatility of the proposed methods. The left panel shows the accuracy of U-GENOT-L for predicting cellular responses to cancer drugs with varying degrees of unbalancedness, highlighting the model’s robustness. The right panel illustrates the ability of GENOT-Q to map complex, non-Euclidean data distributions (a Swiss roll in 3D space) to a simpler space (a spiral in 2D space) while preserving the relationships between data points. The center and right panels provide visualizations of this mapping, showcasing the model’s capacity to learn meaningful and accurate relationships between data points, even when the data lies on a non-Euclidean manifold.

This figure visualizes the influence of the entropy regularization parameter (ε) on the conditional distributions generated by GENOT-Q for a specific task: mapping a 3D Swiss roll to a 2D spiral. It shows how different values of ε affect the resulting conditional distributions, with higher values leading to more spread out distributions, and how choosing an outer coupling instead of an entropic optimal transport (EOT) coupling impacts the results. The source distribution and conditioned data points from Figure 3 are also referenced for comparison.

This figure illustrates the task and methodology of the GENOT model. The left panel describes the task of generating RNA cell profiles from ATAC measurements and additional cell features, leveraging the Fused Gromov-Wasserstein (FGW) formulation to handle the partially incomparable nature of the data. The right panel details the method, showing how the model learns a flow from noise to conditional distributions for each (x, u) pair, allowing for simultaneous sampling of structural information and features.

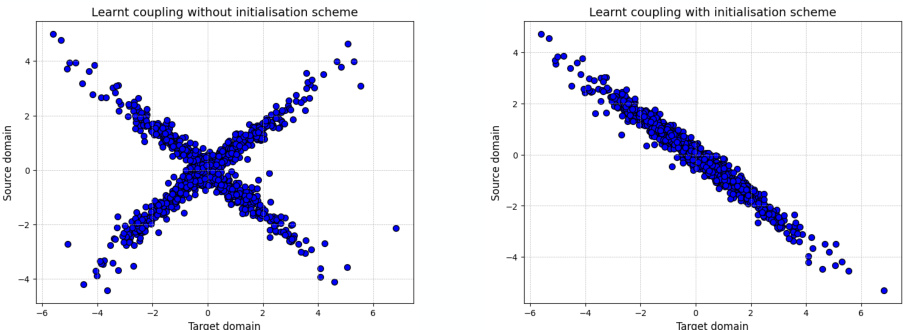
The figure compares the results of learning an optimal transport plan using the GENOT-Q model with and without an initialization scheme. The left panel shows that without initialization, the learned coupling is a mixture of valid transport plans. The right panel demonstrates that with the initialization scheme, the model successfully learns a single valid transport plan.

This figure compares the variance of conditional distributions obtained from different optimal transport methods for both simulated Gaussian data and real single-cell data. It demonstrates that the proposed GENOT method, along with its fused and geodesic cost variants, show lower variance compared to baselines, particularly in the single-cell data. This suggests improved stability and reliability in real-world applications where data is noisy and high dimensional.

This figure illustrates the proposed method GENOT for generating RNA cell profiles from ATAC measurements and additional cell features. The left panel provides a high-level overview of the task, highlighting the use of Fused Gromov-Wasserstein (FGW) to handle the partially incomparable nature of ATAC and RNA data. The right panel details the method’s mechanism, showing how a learned flow maps from a noise distribution to a conditional distribution, allowing for the simultaneous sampling of structural and feature information.

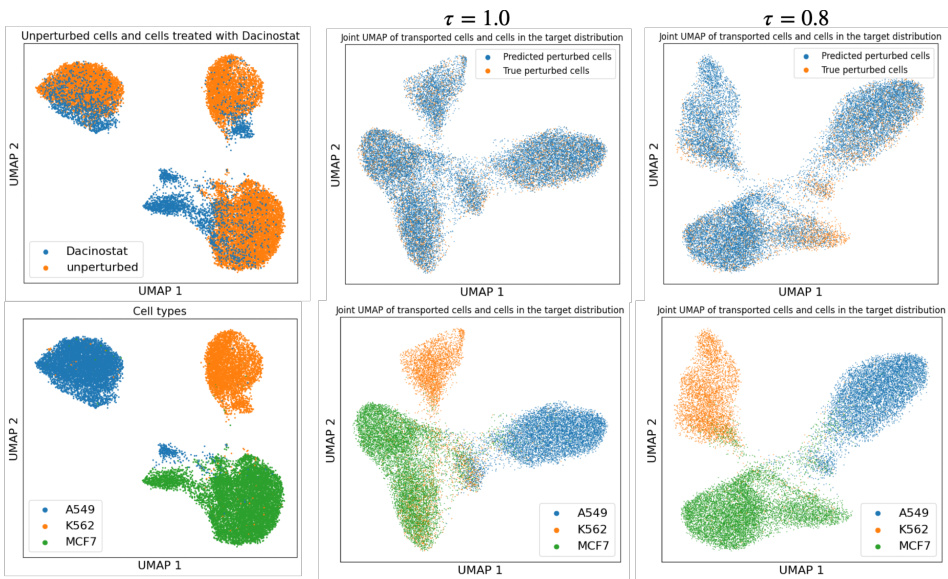
This figure visualizes the unbalanced entropic optimal transport plans learned by U-GENOT-L for different unbalancedness parameters τ, entropy regularization parameters ε, and dimensions. The dotted line represents the outer coupling, while SUOT denotes the method proposed in Yang and Uhler [93].

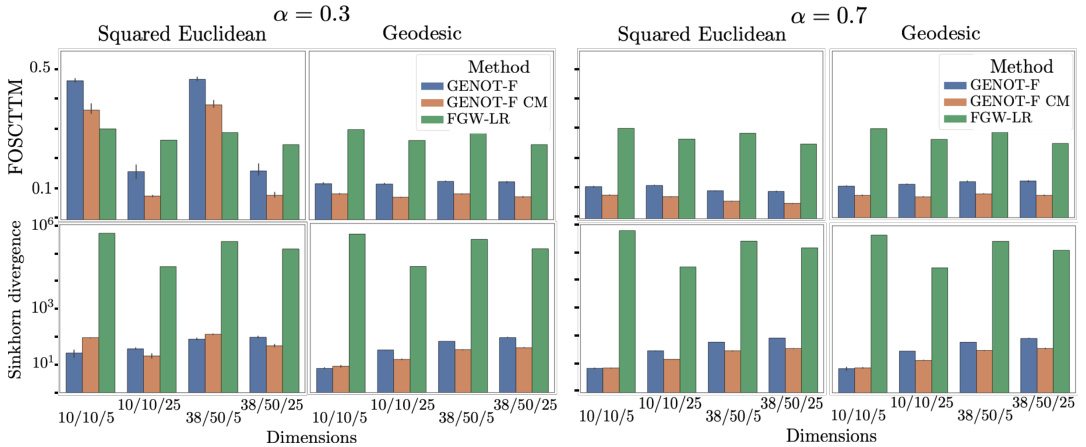
This figure compares the performance of GENOT-F and FGW-LR (a linear regression approach for out-of-sample extension of FGW) on the task of modality translation. The comparison is done using FOSCTTM score (measuring the fraction of samples that are mapped more accurately than a random mapping) and Sinkhorn divergence (measuring the distance between probability distributions). The results are shown for different dimensions of input and output spaces (d1/d2/d3) and different settings of the fusion parameter alpha (α = 0.3 and α = 0.7). Each setting uses either a squared Euclidean or geodesic distance as the underlying cost function.

This figure presents a benchmark comparing GENOT-Q to discrete Gromov-Wasserstein methods for translating between ATAC and RNA spaces. The left panel shows quantitative results (FOSCTTM score and Sinkhorn divergence) for different cost functions (L2 and geodesic distance), demonstrating GENOT-Q’s superior performance. The right panel uses UMAP to visualize the spatial relationships of the translated cells. The top section shows GENOT-F which clusters cells by type, while the bottom section shows a model trained without optimal transport, resulting in random cell mixing.

This figure visualizes the result of applying GENOT-F to translate ATAC-seq data (source) to RNA-seq data (target). The top panel shows the ATAC-seq data, with a single Erythroblast cell highlighted. The bottom panels display the corresponding RNA-seq data, with the left panel showing cell types and the right panel showing the conditional density. The conditional density highlights the areas in the RNA-seq data that are most likely to correspond to the highlighted Erythroblast cell in the ATAC-seq data, demonstrating the accuracy of the GENOT-F model in translating between these two modalities.

This figure illustrates the core idea of GENOT, showing how it generates RNA cell profiles from ATAC measurements and additional cell features. It uses the Fused Gromov-Wasserstein (FGW) formulation to handle the partially incomparable spaces of ATAC and RNA data, leveraging cell features as comparable information. The right panel details the generative process: for each source data point, GENOT learns a flow mapping noise to a conditional distribution that includes both structural (RNA) and feature information. This is shown for a specific example with 2-dimensional noise and 3-dimensional target space.

This figure illustrates the task and method of the GENOT model. The left panel shows the task of generating RNA cell profiles from ATAC measurements and an additional cell feature using the Fused Gromov-Wasserstein formulation. The right panel illustrates the method by showing how, for each (x, u) in the source distribution, a flow is learned from noise to the conditional distribution, allowing for the generation of structural and feature information.
More on tables

This table shows the average ranking of different optimal transport methods across various experiments measuring the quality of the estimated optimal transport coupling using two different metrics, BW2-UVP and cBW2-UVP. The experiments varied the dimension of the data and the entropy regularization parameter. GENOT-L consistently achieves the lowest rank (best performance).

This table presents the average ranking of various methods for estimating optimal transport (OT) couplings in different dimensions and entropy regularization parameters. The ranking is based on two metrics: BW2-UVP and cBW2-UVP. Lower ranks indicate better performance.

This table presents a comparison of different optimal transport methods on a benchmark dataset. The methods are ranked based on two metrics: Bures-Wasserstein Unexplained Variance Percentage (BW2-UVP) and conditional Bures-Wasserstein Unexplained Variance Percentage (cBW2-UVP). The results are shown for various dimensions and entropy regularization parameters. GENOT-L achieves the best overall rank.

This table presents the results of experiments on modality translation using both U-GENOT-F and discrete unbalanced FGW. The mean rescaling function value for each cell type (Normoblast, Erythroblast, Proerythroblast, Other) and the FOSCTTM score are reported. The FOSCTTM score measures the quality of the alignment. Lower values indicate better alignment. The table highlights the superior performance of U-GENOT-F in terms of both rescaling function values and FOSCTTM scores.

This table presents the results of comparing U-GENOT-F and discrete unbalanced FGW models on a specific task. It shows the mean rescaling function values (a measure of how much the model adjusts the mass of each cell cluster) for different cell types (Normoblast, Erythroblast, Proerythroblast, Other). The FOSCTTM score, a measure of accuracy, is also provided. A separate table (Table 5) gives the variances of these results across three different runs to show model stability.
Full paper#


