↗ arXiv ↗ Hugging Face ↗ Hugging Face ↗ Chat
TL;DR#
Large Language Models (LLMs) show impressive mathematical abilities, but how they compute basic arithmetic like addition remains unclear. This paper investigates how pre-trained LLMs perform this seemingly simple task. Previous research often focuses on smaller, simpler models or models trained from scratch, providing limited insight into the mechanisms of complex pre-trained LLMs. This paper addresses the limitations by directly analyzing a pre-trained, state-of-the-art LLM and its internal workings.
This study reveals that pre-trained LLMs surprisingly employ Fourier features to perform addition. Specifically, it discovers that Multi-Layer Perceptrons (MLPs) primarily approximate the magnitude of the answer, leveraging low-frequency features, while attention mechanisms focus on modular addition (e.g., checking if the result is even or odd), using high-frequency features. Importantly, the study demonstrates that pre-training is essential for this mechanism; randomly initialized models struggle to learn this method. The research provides a detailed, mechanistic explanation, offering a significant contribution to our understanding of LLM capabilities.
Key Takeaways#
Why does it matter?#
This paper is crucial for researchers working with large language models (LLMs) and their applications in mathematical reasoning. It uncovers the previously unknown mechanism by which pre-trained LLMs perform addition using Fourier features, a finding that challenges existing assumptions about LLM mathematical capabilities and opens new avenues for improving LLM performance on algorithmic tasks. This mechanistic understanding will inform future LLM design and improve their ability to perform complex mathematical tasks, pushing the boundaries of AI capabilities.
Visual Insights#

🔼 This figure visualizes the model’s prediction accuracy at different layers, showing that it initially approximates the answer before refining it. Heatmaps illustrate the logits from MLP and attention layers, revealing that MLP layers primarily approximate the magnitude of the answer using low-frequency features, while attention layers primarily perform modular addition using high-frequency features.
read the caption
Figure 1: (a) Visualization of predictions extracted from fine-tuned GPT-2-XL at intermediate layers. Between layers 20 and 30, the model's accuracy is low, but its prediction is often within 10 of the correct answer: the model first approximates the answer, then refines it. (b) Heatmap of the logits from different MLP layers for the running example, “Put together 15 and 93. Answer: 108”. The y-axis represents the subset of the number space around the correct prediction, while the x-axis represents the layer index. The 33-rd layer performs mod 2 operations (favoring even numbers), while other layers perform other modular addition operations, such as mod 10 (45-th layer). Additionally, most layers allocate more weight to numbers closer to the correct answer, 108. (c) Analogous plot for attention layers. Nearly all attention modules perform modular addition.

🔼 This table presents the results of an ablation study where different frequency components were removed from either the attention or MLP modules of a fine-tuned GPT-2-XL model. The experiment evaluated the impact of removing low-frequency components from the attention modules, high-frequency components from the MLP modules, both low and high frequency components from attention and MLP modules, and no filtering. The results are presented as validation loss and accuracy. The key observation is that removing low-frequency components from attention or high-frequency components from MLP has little impact on accuracy while removing high-frequency components from attention significantly reduces performance.
read the caption
Table 1: Impact of Filtering out Fourier Components on Model Performance. Removing low-frequency components from attention modules (blue) or high-frequency components from MLP modules (red) does not impact performance
In-depth insights#
Fourier Feature Use#
The research paper reveals the intriguing use of Fourier features by pre-trained large language models (LLMs) to perform addition. LLMs don’t simply memorize answers; they employ a layered computational process. Initially, they approximate the answer’s magnitude using low-frequency Fourier components, primarily through MLP layers. Subsequently, attention layers refine this approximation by employing high-frequency components to perform modular arithmetic (e.g., determining even/odd). This dual approach, leveraging complementary strengths of MLPs and attention mechanisms, allows for precise calculation. Crucially, pre-training is essential, as models trained from scratch lack this capability and only exploit low-frequency features. The pre-trained token embeddings appear to be the key source of inductive bias that enables this sophisticated computational strategy. The analysis is supported by ablations demonstrating that removing low-frequency components from attention mechanisms or high-frequency components from MLPs significantly impacts accuracy, confirming their distinct roles in the process. This work sheds light on the internal workings of LLMs, revealing sophisticated mechanisms previously unknown. The findings open up new avenues for improving the reasoning abilities of LLMs by focusing on the development of suitable pre-trained representations.
Pre-trained LLM Adds#
The heading ‘Pre-trained LLM Adds’ suggests a focus on how large language models (LLMs), after pre-training, perform the fundamental arithmetic operation of addition. A deeper exploration would likely investigate the internal mechanisms employed by these models, potentially revealing whether they utilize learned patterns, symbolic reasoning, or a hybrid approach. The research could explore whether the models’ ability to add stems from memorization during pre-training or if it represents a more fundamental understanding of numerical relationships. A key aspect would be determining whether the model performs addition directly or uses an indirect method involving intermediate steps, such as converting numbers to text representations, performing operations on the textual form, and then converting the result back to a numerical value. Investigating the model’s reliance on specific architectural components, like attention mechanisms or multilayer perceptrons, to perform different aspects of addition would provide crucial insights into the underlying algorithmic procedures involved. Finally, understanding how the pre-training data influences the model’s approach to addition is critical. Determining whether the addition capabilities are a byproduct of the pre-training process or are specifically learned through focused fine-tuning would be essential.
Ablation Study#
An ablation study systematically removes or deactivates components of a model to assess their individual contributions and understand the model’s behavior. In the context of this research paper, an ablation study might involve selectively removing or disabling specific layers (e.g., MLP or attention layers), frequency components (low or high), or pre-trained components (like token embeddings) to determine their impact on the model’s ability to perform addition accurately. The results would reveal the relative importance of these components, possibly showing that certain layers are crucial for approximation while others handle modular addition, and that pre-trained embeddings are essential for enabling the model to exploit Fourier features. By observing performance drops after removing specific components, researchers can pinpoint which parts of the model are essential for the task and gain insight into the internal mechanisms. Such analysis is crucial for confirming that the observed Fourier features are not merely artifacts but are truly causal factors underlying the model’s mathematical capabilities. The study likely would show interactions between different model components and the importance of pre-training in providing necessary inductive biases.
Pre-training Effects#
The paper’s analysis of pre-training effects reveals its crucial role in enabling LLMs to effectively compute addition using Fourier features. Models trained from scratch, lacking the inductive bias provided by pre-training, fail to utilize Fourier features and exhibit significantly lower accuracy. This highlights the importance of pre-trained token embeddings, which introduce the necessary Fourier components into the model’s representation of numbers. These pre-trained embeddings act as a crucial source of inductive bias, guiding the network towards learning the efficient computational mechanisms observed in the fine-tuned models. The study demonstrates that even when freezing the pre-trained embeddings, models initialized randomly can still achieve high accuracy when trained on an addition task, emphasizing the critical role of pre-trained representations in unlocking the computational capabilities of Transformers.
Future Work#
Future research could explore the generalizability of Fourier feature utilization across diverse mathematical tasks and LLM architectures. Investigating whether similar mechanisms are employed for more complex mathematical operations beyond addition and multiplication would be valuable. A key area to examine is the role of model size and training data in shaping the emergence of Fourier features. Does the prevalence of Fourier features increase with model scale, and how does the nature of the training data influence the representation? Furthermore, exploring alternative training methods that explicitly encourage the learning of Fourier features, potentially leading to more efficient and accurate solutions for algorithmic tasks, represents a significant area of potential advancement. Finally, understanding the interaction between Fourier features and other mechanisms within LLMs used for mathematical reasoning would enhance our understanding of the overall computational process.
More visual insights#
More on figures

🔼 This figure visualizes the prediction accuracy and logit distributions across different layers of a fine-tuned GPT-2-XL model performing addition. Panel (a) shows that the model initially approximates the answer before iteratively refining it, achieving high accuracy in later layers. Panels (b) and (c) are heatmaps showing the logits from MLP and attention layers respectively. These heatmaps reveal that MLP layers primarily focus on approximating the magnitude of the answer using low-frequency features, while attention layers primarily perform modular arithmetic operations (e.g., checking if the number is even or odd) using high-frequency features.
read the caption
Figure 1: (a) Visualization of predictions extracted from fine-tuned GPT-2-XL at intermediate layers. Between layers 20 and 30, the model's accuracy is low, but its prediction is often within 10 of the correct answer: the model first approximates the answer, then refines it. (b) Heatmap of the logits from different MLP layers for the running example, 'Put together 15 and 93. Answer: 108'. The y-axis represents the subset of the number space around the correct prediction, while the x-axis represents the layer index. The 33-rd layer performs mod 2 operations (favoring even numbers), while other layers perform other modular addition operations, such as mod 10 (45-th layer). Additionally, most layers allocate more weight to numbers closer to the correct answer, 108. (c) Analogous plot for attention layers. Nearly all attention modules perform modular addition.

🔼 This figure visualizes the prediction accuracy and logits of a fine-tuned GPT-2-XL model at intermediate layers during the addition task. Panel (a) shows that the model’s accuracy improves progressively layer by layer, initially approximating the answer before refining it. Panels (b) and (c) are heatmaps illustrating the logits from MLP and attention layers respectively. They reveal that MLP layers mainly contribute to approximating the answer’s magnitude, while attention layers perform modular addition (e.g., determining even/odd, modulo 10).
read the caption
Figure 1: (a) Visualization of predictions extracted from fine-tuned GPT-2-XL at intermediate layers. Between layers 20 and 30, the model's accuracy is low, but its prediction is often within 10 of the correct answer: the model first approximates the answer, then refines it. (b) Heatmap of the logits from different MLP layers for the running example, 'Put together 15 and 93. Answer: 108'. The y-axis represents the subset of the number space around the correct prediction, while the x-axis represents the layer index. The 33-rd layer performs mod 2 operations (favoring even numbers), while other layers perform other modular addition operations, such as mod 10 (45-th layer). Additionally, most layers allocate more weight to numbers closer to the correct answer, 108. (c) Analogous plot for attention layers. Nearly all attention modules perform modular addition.
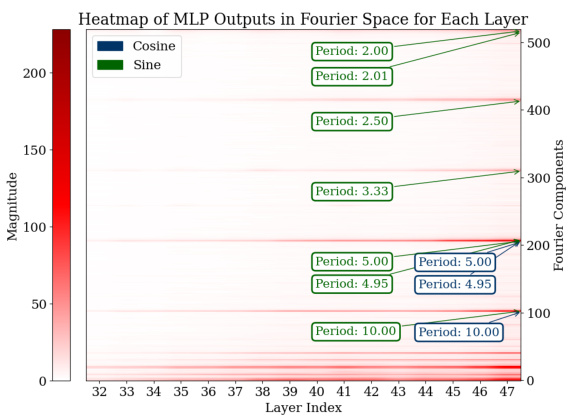
🔼 This figure visualizes the Fourier transforms of the logits from the last 15 layers of the model for all test data points. It shows the magnitudes of different frequency components (periods) within the MLP and attention modules. The heatmaps clearly indicate prominent Fourier components with periods around 2, 2.5, 5, and 10, demonstrating that the model uses these specific frequencies to represent its predictions during addition tasks. This sparsity in the Fourier domain is a key characteristic of how the model solves the task.
read the caption
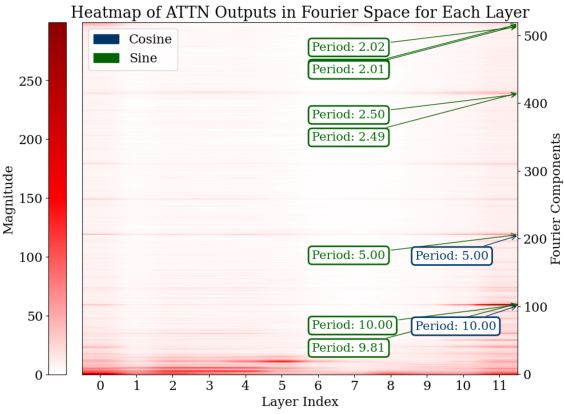
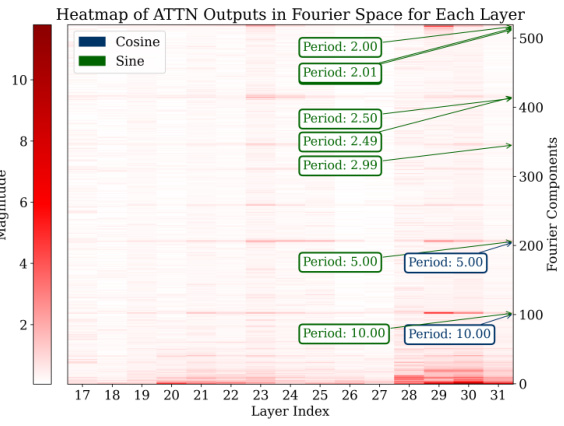
Figure 3: Analysis of logits in Fourier space for all the test data across the last 15 layers. For both the MLP and attention modules, outlier Fourier components have periods around 2, 2.5, 5, and 10.
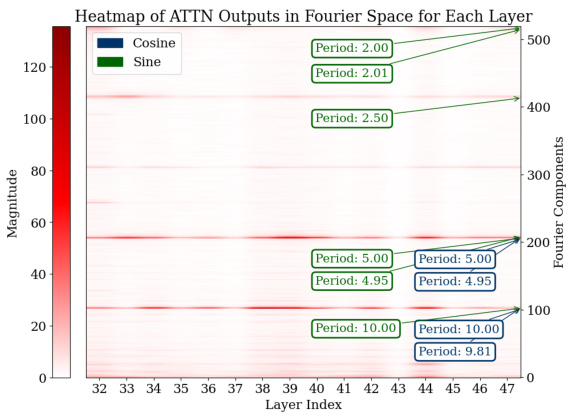
🔼 This figure shows heatmaps visualizing the magnitude of Fourier components (sine and cosine waves of different periods) in the logits of the MLP and attention modules across the last 15 layers of the GPT-2-XL model. The x-axis represents the layer index, and the y-axis represents the Fourier component index, which corresponds to the frequency of the component. The color intensity represents the magnitude. The heatmaps reveal that specific components with periods around 2, 2.5, 5, and 10 consistently have higher magnitudes across multiple layers for both the MLP and attention modules. This indicates that these Fourier features, sparse in the frequency domain, play a significant role in the model’s computation of addition.
read the caption
Figure 3: Analysis of logits in Fourier space for all the test data across the last 15 layers. For both the MLP and attention modules, outlier Fourier components have periods around 2, 2.5, 5, and 10.

🔼 This figure visualizes how a small set of Fourier components contribute to the model’s prediction of the sum. Panel (a) shows the top five Fourier components (low and high frequency) individually, demonstrating their individual contribution to the magnitude and the modularity. Panel (b) shows the sum of these five components, illustrating how their combination accurately predicts the answer (108). This demonstrates that the model uses a sparse representation in the Fourier space to compute addition.
read the caption
Figure 4: Visualization of how a sparse subset Fourier components can identify the correct answer. (a) Shows the top-5 Fourier components for the final logits. (b) Shows the sum of these top-5 Fourier components, highlighting how the cumulative effect identifies the correct answer, 108.

🔼 This figure visualizes how a small set of Fourier components contributes to the model’s prediction. Panel (a) displays the top 5 Fourier components of the final logits. These components represent different frequency patterns in the model’s internal representation of numbers. Panel (b) shows the sum of these top 5 components, demonstrating how their combined effect accurately identifies the correct answer (108). The low-frequency components approximate the magnitude of the answer, while the high-frequency components are responsible for modular addition (computing whether the answer is even or odd).
read the caption
Figure 4: Visualization of how a sparse subset Fourier components can identify the correct answer. (a) Shows the top-5 Fourier components for the final logits. (b) Shows the sum of these top-5 Fourier components, highlighting how the cumulative effect identifies the correct answer, 108.

🔼 This figure shows two subfigures. Subfigure (a) displays the magnitude of different Fourier components across all token embedding dimensions for fine-tuned GPT-2-XL model. It highlights components with periods of 2, 2.5, 5, and 10, suggesting the model uses these frequencies to represent numbers. Subfigure (b) visualizes the clustering of token embeddings using t-SNE and k-means. It reveals that numbers cluster not only by magnitude but also by their multiples of 10, indicating that the model incorporates structural information about numerical relationships into its representations.
read the caption
Figure 5: (a) Number embedding in Fourier space for fine-tuned GPT-2-XL. T stands for the period of that Fourier component.(b) Visualization of token embedding clustering of GPT-2 using T-SNE and k-means with 10 clusters. The numbers are clustered based on their magnitude and whether they are multiples of 10.

🔼 This figure visualizes the predictions of a fine-tuned GPT-2-XL model at different layers during addition. It shows that the model initially approximates the answer, then refines it layer by layer using different mechanisms. Specifically, MLP layers mainly focus on approximating the magnitude, while attention layers perform modular addition (e.g., mod 2, mod 10).
read the caption
Figure 1: (a) Visualization of predictions extracted from fine-tuned GPT-2-XL at intermediate layers. Between layers 20 and 30, the model's accuracy is low, but its prediction is often within 10 of the correct answer: the model first approximates the answer, then refines it. (b) Heatmap of the logits from different MLP layers for the running example, “Put together 15 and 93. Answer: 108”. The y-axis represents the subset of the number space around the correct prediction, while the x-axis represents the layer index. The 33-rd layer performs mod 2 operations (favoring even numbers), while other layers perform other modular addition operations, such as mod 10 (45-th layer). Additionally, most layers allocate more weight to numbers closer to the correct answer, 108. (c) Analogous plot for attention layers. Nearly all attention modules perform modular addition.
🔼 This figure visualizes the prediction accuracy and logit distributions across layers in a fine-tuned GPT-2-XL model solving an addition problem. Panel (a) shows that the model initially makes a rough approximation of the answer, then refines it layer by layer. Panels (b) and (c) are heatmaps showing logit distributions for MLP and attention layers respectively. These demonstrate that MLP layers mainly focus on magnitude approximation while attention layers perform modular arithmetic (e.g., checking if the answer is even or odd).
read the caption
Figure 1: (a) Visualization of predictions extracted from fine-tuned GPT-2-XL at intermediate layers. Between layers 20 and 30, the model's accuracy is low, but its prediction is often within 10 of the correct answer: the model first approximates the answer, then refines it. (b) Heatmap of the logits from different MLP layers for the running example, 'Put together 15 and 93. Answer: 108'. The y-axis represents the subset of the number space around the correct prediction, while the x-axis represents the layer index. The 33-rd layer performs mod 2 operations (favoring even numbers), while other layers perform other modular addition operations, such as mod 10 (45-th layer). Additionally, most layers allocate more weight to numbers closer to the correct answer, 108. (c) Analogous plot for attention layers. Nearly all attention modules perform modular addition.

🔼 This figure shows two plots. The left plot is a bar chart showing the magnitude of sine and cosine waves of different frequencies in the Fourier space for the number embedding of a GPT-2 model trained from scratch. The right plot shows the validation accuracy over epochs for a GPT-2-small model trained from scratch, with and without pre-trained token embeddings. The key observation is the lack of high-frequency components in the Fourier transform of the from-scratch model, and the significantly higher accuracy achieved when pre-trained token embeddings are included. This highlights the importance of pre-trained embeddings for learning Fourier features which enable effective addition.
read the caption
Figure 7: (a) The number embedding in Fourier space for GPT-2-XL trained from scratch. There are no high-frequency outlier components, in contrast with the pre-trained embeddings (Figure 5a). (b) Validation accuracy of GPT-2-small trained from scratch either with or without pre-trained token embeddings. We show the mean and the standard deviation of the validation accuracy across 5 random seeds. GPT-2-small with pre-trained token embedding consistently achieves 100% accuracy, while GPT-2-small without pre-trained token embedding only achieves less than 60% accuracy.

🔼 This figure shows the accuracy change and the heatmap of logits from different MLP and attention layers. The heatmaps show how the model’s predictions change over layers. The model first approximates the answer and then refines it layer by layer. MLP layers mostly contribute to approximation while attention layers contribute to classification (modular addition).
read the caption
Figure 1: (a) Visualization of predictions extracted from fine-tuned GPT-2-XL at intermediate layers. Between layers 20 and 30, the model's accuracy is low, but its prediction is often within 10 of the correct answer: the model first approximates the answer, then refines it. (b) Heatmap of the logits from different MLP layers for the running example, 'Put together 15 and 93. Answer: 108'. The y-axis represents the subset of the number space around the correct prediction, while the x-axis represents the layer index. The 33-rd layer performs mod 2 operations (favoring even numbers), while other layers perform other modular addition operations, such as mod 10 (45-th layer). Additionally, most layers allocate more weight to numbers closer to the correct answer, 108. (c) Analogous plot for attention layers. Nearly all attention modules perform modular addition.

🔼 This figure visualizes the model’s prediction accuracy and the logits from different layers of a fine-tuned GPT-2-XL model on an addition task. (a) Shows the model’s accuracy progressively improving layer by layer, suggesting an iterative process rather than memorization. (b) and (c) are heatmaps showing the logits distribution across MLP and attention layers respectively. They highlight that MLP layers focus on approximating the magnitude of the answer, while attention layers perform modular addition (e.g., determining even/odd numbers).
read the caption
Figure 1: (a) Visualization of predictions extracted from fine-tuned GPT-2-XL at intermediate layers. Between layers 20 and 30, the model's accuracy is low, but its prediction is often within 10 of the correct answer: the model first approximates the answer, then refines it. (b) Heatmap of the logits from different MLP layers for the running example, 'Put together 15 and 93. Answer: 108'. The y-axis represents the subset of the number space around the correct prediction, while the x-axis represents the layer index. The 33-rd layer performs mod 2 operations (favoring even numbers), while other layers perform other modular addition operations, such as mod 10 (45-th layer). Additionally, most layers allocate more weight to numbers closer to the correct answer, 108. (c) Analogous plot for attention layers. Nearly all attention modules perform modular addition.
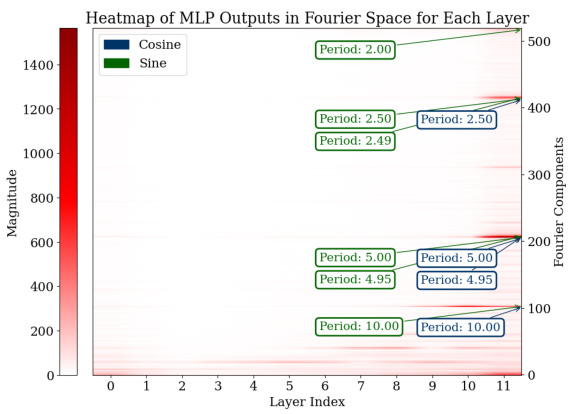
🔼 This figure visualizes the analysis of logits in the Fourier space for the last 15 layers of a model processing the test dataset. It shows heatmaps representing the magnitude of sine and cosine waves (Fourier components) for both MLP and attention modules. The key observation is the presence of outlier Fourier components with periods approximately around 2, 2.5, 5, and 10, suggesting the model utilizes these specific frequencies for computation.
read the caption
Figure 3: Analysis of logits in Fourier space for all the test data across the last 15 layers. For both the MLP and attention modules, outlier Fourier components have periods around 2, 2.5, 5, and 10.
🔼 This figure visualizes the Fourier transform of the logits for the last 15 layers of the model. It shows that for both the MLP (multi-layer perceptron) and attention modules, there are a few Fourier components with periods near 2, 2.5, 5 and 10 that have high magnitude. This indicates that the model uses these components, representing different frequencies, to compute addition.
read the caption
Figure 3: Analysis of logits in Fourier space for all the test data across the last 15 layers. For both the MLP and attention modules, outlier Fourier components have periods around 2, 2.5, 5, and 10.

🔼 This figure visualizes the Fourier transforms of the logits from the last 15 layers of a fine-tuned language model processing addition problems. Separate heatmaps are shown for the Multi-Layer Perceptron (MLP) and attention modules. The heatmaps show the magnitude of Fourier components across different frequencies. The key observation is that several components with frequencies corresponding to periods of 2, 2.5, 5, and 10 consistently show high magnitudes, suggesting that these specific frequencies are important for the model’s addition computation. The sparsity in the Fourier space indicates that the model leverages a relatively small set of Fourier features for this task.
read the caption
Figure 3: Analysis of logits in Fourier space for all the test data across the last 15 layers. For both the MLP and attention modules, outlier Fourier components have periods around 2, 2.5, 5, and 10.
🔼 This figure visualizes the Fourier transforms of the logits (model’s prediction probabilities) for the last 15 layers of a fine-tuned GPT-2-XL model across all test examples. The heatmaps show the magnitude of different frequency components (periods) for both MLP (Multi-Layer Perceptron) and attention layers. The consistent appearance of strong components with periods around 2, 2.5, 5, and 10 in both types of layers suggests that these periods play a crucial role in the model’s addition computation. The sparsity in the Fourier space indicates that the model uses a relatively small number of frequency components for its calculation.
read the caption
Figure 3: Analysis of logits in Fourier space for all the test data across the last 15 layers. For both the MLP and attention modules, outlier Fourier components have periods around 2, 2.5, 5, and 10.

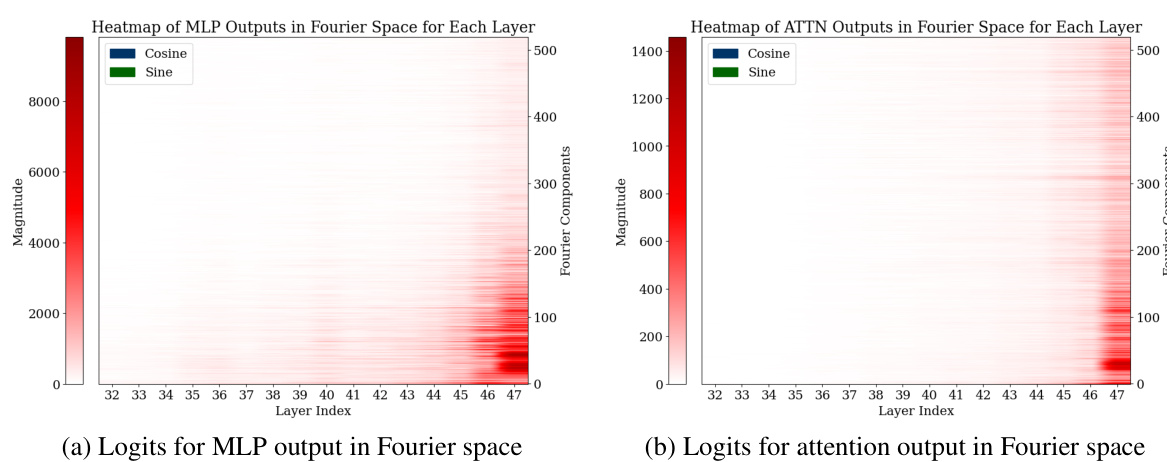
🔼 This figure visualizes the Fourier analysis of the last 15 layers of the GPT-2-XL model during the addition task. It shows heatmaps of the MLP (a) and Attention (b) modules’ outputs in Fourier space. The heatmaps show the magnitude of the top 50 Fourier components across different layers. The key observation is that MLP layers show more pronounced low-frequency components (sparse in the frequency domain and show periodic patterns), while attention layers exhibit less clear low-frequency components. This suggests that the MLP primarily handles low-frequency approximation tasks (approximating the magnitude of the answer), whereas attention layers are more focused on high-frequency classification tasks (such as computing the answer modulo certain numbers).
read the caption
Figure 10: We analyzed the logits in Fourier space for all the test data across the last 15 layers. For both the MLP and attention modules. We only plot the first 50 Fourier components (a) The MLP exhibits some outlier low-frequency Fourier components. (b) The attention module’s low-frequency Fourier components are not as obvious as the ones in MLP.

🔼 This figure shows heatmaps visualizing the magnitudes of Fourier components for MLP and attention modules across the final 15 layers of the model for the addition task. The heatmaps display the average logits transformed into Fourier space. The x-axis represents the layer index (32-47), and the y-axis shows the Fourier components. The color intensity represents the magnitude of each component. Noticeably, specific Fourier components with periods around 2, 2.5, 5, and 10 show high magnitudes, indicating the model’s reliance on these periodic features for addition.
read the caption
Figure 3: Analysis of logits in Fourier space for all the test data across the last 15 layers. For both the MLP and attention modules, outlier Fourier components have periods around 2, 2.5, 5, and 10.

🔼 This figure visualizes the prediction accuracy of a fine-tuned GPT-2-XL model at different layers during the addition task. It shows that the model initially approximates the answer before refining it layer by layer. Heatmaps illustrate the logits from MLP and attention layers, revealing that MLP layers mainly contribute to magnitude approximation, while attention layers focus on modular addition (computing whether the answer is even or odd).
read the caption
Figure 1: (a) Visualization of predictions extracted from fine-tuned GPT-2-XL at intermediate layers. Between layers 20 and 30, the model's accuracy is low, but its prediction is often within 10 of the correct answer: the model first approximates the answer, then refines it. (b) Heatmap of the logits from different MLP layers for the running example, 'Put together 15 and 93. Answer: 108'. The y-axis represents the subset of the number space around the correct prediction, while the x-axis represents the layer index. The 33-rd layer performs mod 2 operations (favoring even numbers), while other layers perform other modular addition operations, such as mod 10 (45-th layer). Additionally, most layers allocate more weight to numbers closer to the correct answer, 108. (c) Analogous plot for attention layers. Nearly all attention modules perform modular addition.

🔼 This figure visualizes the predictions of a fine-tuned GPT-2-XL model at different layers during addition. The accuracy starts low but improves as the model refines its approximation towards the correct answer. Heatmaps show the logits from MLP and attention layers, illustrating their distinct roles: MLP layers primarily approximate the magnitude while attention layers perform modular addition.
read the caption
Figure 1: (a) Visualization of predictions extracted from fine-tuned GPT-2-XL at intermediate layers. Between layers 20 and 30, the model's accuracy is low, but its prediction is often within 10 of the correct answer: the model first approximates the answer, then refines it. (b) Heatmap of the logits from different MLP layers for the running example, 'Put together 15 and 93. Answer: 108'. The y-axis represents the subset of the number space around the correct prediction, while the x-axis represents the layer index. The 33-rd layer performs mod 2 operations (favoring even numbers), while other layers perform other modular addition operations, such as mod 10 (45-th layer). Additionally, most layers allocate more weight to numbers closer to the correct answer, 108. (c) Analogous plot for attention layers. Nearly all attention modules perform modular addition.

🔼 This figure visualizes the model’s prediction accuracy and the logits of MLP and attention layers at different stages of processing. It shows that the model first approximates the answer before refining it layer by layer, with MLP layers focusing on approximation and attention layers on modular addition.
read the caption
Figure 1: (a) Visualization of predictions extracted from fine-tuned GPT-2-XL at intermediate layers. Between layers 20 and 30, the model's accuracy is low, but its prediction is often within 10 of the correct answer: the model first approximates the answer, then refines it. (b) Heatmap of the logits from different MLP layers for the running example, 'Put together 15 and 93. Answer: 108'. The y-axis represents the subset of the number space around the correct prediction, while the x-axis represents the layer index. The 33-rd layer performs mod 2 operations (favoring even numbers), while other layers perform other modular addition operations, such as mod 10 (45-th layer). Additionally, most layers allocate more weight to numbers closer to the correct answer, 108. (c) Analogous plot for attention layers. Nearly all attention modules perform modular addition.

🔼 This figure visualizes the model’s prediction accuracy at different layers, showing that it first approximates the answer before refining it. Heatmaps illustrate the logits for MLP and attention layers in a specific example, revealing how MLP layers focus on approximating the magnitude of the answer and attention layers on modular addition (e.g., determining even/odd).
read the caption
Figure 1: (a) Visualization of predictions extracted from fine-tuned GPT-2-XL at intermediate layers. Between layers 20 and 30, the model's accuracy is low, but its prediction is often within 10 of the correct answer: the model first approximates the answer, then refines it. (b) Heatmap of the logits from different MLP layers for the running example, 'Put together 15 and 93. Answer: 108'. The y-axis represents the subset of the number space around the correct prediction, while the x-axis represents the layer index. The 33-rd layer performs mod 2 operations (favoring even numbers), while other layers perform other modular addition operations, such as mod 10 (45-th layer). Additionally, most layers allocate more weight to numbers closer to the correct answer, 108. (c) Analogous plot for attention layers. Nearly all attention modules perform modular addition.

🔼 This figure visualizes how a small set of Fourier components contribute to the model’s prediction of the sum of two numbers. Panel (a) shows the individual magnitudes of the top 5 Fourier components in the final prediction logits. Panel (b) shows the sum of these components, demonstrating how their combined effect accurately predicts the correct answer (108). The figure highlights that low-frequency components (larger periods) approximate the magnitude of the answer, while high-frequency components (smaller periods) refine the prediction by classifying the result modulo various numbers.
read the caption
Figure 4: Visualization of how a sparse subset Fourier components can identify the correct answer. (a) Shows the top-5 Fourier components for the final logits. (b) Shows the sum of these top-5 Fourier components, highlighting how the cumulative effect identifies the correct answer, 108.

🔼 This figure shows the magnitude of different Fourier components in the token embedding of four different pre-trained models: pre-trained GPT-2-XL, fine-tuned GPT-2-XL, pre-trained ROBERTa, and pre-trained Phi-2. The x-axis represents the Fourier component, and the y-axis represents the magnitude of that component. The plots show that all four models exhibit outlier components with periods around 2, 2.5, 5, and 10. This suggests that Fourier features are a common attribute in the token embedding of pre-trained LLMs, supporting the paper’s central hypothesis.
read the caption
Figure 15: Number embedding in Fourier space for different pre-trained models.

🔼 This figure visualizes the Fourier transform of the logits (model’s predictions) for the last 15 layers of a Transformer model trained on an addition task. Separate heatmaps are shown for MLP (multilayer perceptron) and attention layers. The heatmaps show the magnitude of Fourier components across different frequencies. The key observation is that prominent Fourier components have periods around 2, 2.5, 5, and 10, indicating that the model uses these frequencies to solve the addition problem, potentially for modular arithmetic and magnitude approximation.
read the caption
Figure 3: Analysis of logits in Fourier space for all the test data across the last 15 layers. For both the MLP and attention modules, outlier Fourier components have periods around 2, 2.5, 5, and 10.

🔼 This figure visualizes the Fourier transform of the logits (predicted probabilities) from the last 15 layers of a transformer model. The heatmaps show the magnitude of different frequency components (periods) for both the MLP (multilayer perceptron) and attention layers. The consistent appearance of strong components with periods around 2, 2.5, 5, and 10 across many layers suggests that these specific frequencies play a crucial role in the model’s computation of addition.
read the caption
Figure 3: Analysis of logits in Fourier space for all the test data across the last 15 layers. For both the MLP and attention modules, outlier Fourier components have periods around 2, 2.5, 5, and 10.

🔼 This figure visualizes the model’s prediction accuracy at different layers, showing that it first approximates the answer before refining it layer by layer. Heatmaps illustrate the logits from MLP and attention layers, revealing that MLPs mainly approximate the magnitude of the answer using low-frequency features, while attention layers perform modular addition using high-frequency features.
read the caption
Figure 1: (a) Visualization of predictions extracted from fine-tuned GPT-2-XL at intermediate layers. Between layers 20 and 30, the model's accuracy is low, but its prediction is often within 10 of the correct answer: the model first approximates the answer, then refines it. (b) Heatmap of the logits from different MLP layers for the running example, 'Put together 15 and 93. Answer: 108'. The y-axis represents the subset of the number space around the correct prediction, while the x-axis represents the layer index. The 33-rd layer performs mod 2 operations (favoring even numbers), while other layers perform other modular addition operations, such as mod 10 (45-th layer). Additionally, most layers allocate more weight to numbers closer to the correct answer, 108. (c) Analogous plot for attention layers. Nearly all attention modules perform modular addition.

🔼 This figure visualizes the model’s prediction accuracy and the logits of MLP and attention layers at intermediate steps. It shows that the model initially approximates the answer and then refines it through modular addition, with MLP layers focusing on approximation and attention layers on classification.
read the caption
Figure 1: (a) Visualization of predictions extracted from fine-tuned GPT-2-XL at intermediate layers. Between layers 20 and 30, the model's accuracy is low, but its prediction is often within 10 of the correct answer: the model first approximates the answer, then refines it. (b) Heatmap of the logits from different MLP layers for the running example, 'Put together 15 and 93. Answer: 108'. The y-axis represents the subset of the number space around the correct prediction, while the x-axis represents the layer index. The 33-rd layer performs mod 2 operations (favoring even numbers), while other layers perform other modular addition operations, such as mod 10 (45-th layer). Additionally, most layers allocate more weight to numbers closer to the correct answer, 108. (c) Analogous plot for attention layers. Nearly all attention modules perform modular addition.
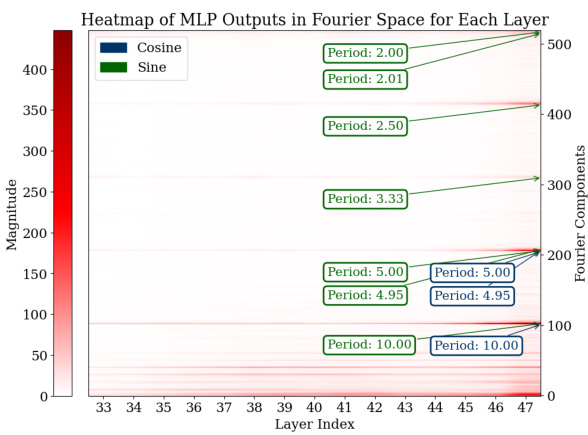
🔼 This figure visualizes the Fourier transforms of the logits (the model’s pre-softmax predictions) for the final 15 layers of a fine-tuned GPT-2-XL model. Separate heatmaps are shown for MLP and attention layers. The x-axis represents the layer index (32 to 47), and the y-axis represents the Fourier component (frequency). The color intensity represents the magnitude of each Fourier component at each layer. The heatmaps clearly show that components with periods around 2, 2.5, 5, and 10 have high magnitudes (lighter colors). These components are identified as important features related to approximation (lower frequency) and modular arithmetic (higher frequency) during addition.
read the caption
Figure 3: Analysis of logits in Fourier space for all the test data across the last 15 layers. For both the MLP and attention modules, outlier Fourier components have periods around 2, 2.5, 5, and 10.
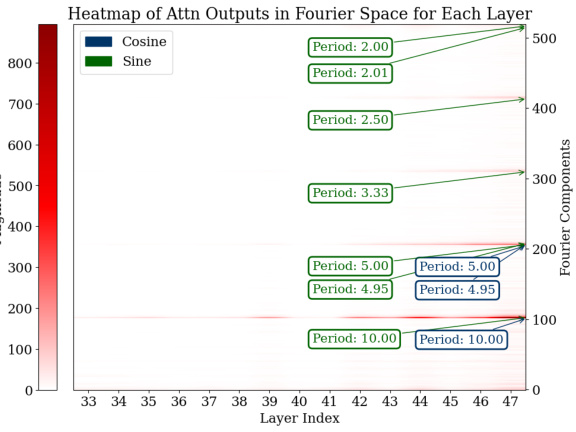
🔼 This figure shows the model’s prediction accuracy at different layers, demonstrating a gradual refinement process. It also visualizes the logits from MLP and attention layers, highlighting their distinct contributions to approximation and modular addition respectively. The heatmaps illustrate that MLP layers focus on approximating the answer’s magnitude using low-frequency features, while attention layers primarily perform modular operations using high-frequency features.
read the caption
Figure 1: (a) Visualization of predictions extracted from fine-tuned GPT-2-XL at intermediate layers. Between layers 20 and 30, the model's accuracy is low, but its prediction is often within 10 of the correct answer: the model first approximates the answer, then refines it. (b) Heatmap of the logits from different MLP layers for the running example, “Put together 15 and 93. Answer: 108”. The y-axis represents the subset of the number space around the correct prediction, while the x-axis represents the layer index. The 33-rd layer performs mod 2 operations (favoring even numbers), while other layers perform other modular addition operations, such as mod 10 (45-th layer). Additionally, most layers allocate more weight to numbers closer to the correct answer, 108. (c) Analogous plot for attention layers. Nearly all attention modules perform modular addition.

🔼 This figure visualizes the Fourier transform of the logits (model’s prediction probabilities) from the last 15 layers of the GPT-2-XL model for all test examples. It shows heatmaps for both the MLP (multilayer perceptron) and attention modules, separately. Each heatmap shows the magnitude of the Fourier components across different frequencies (represented by layer index), revealing distinct periodic patterns with periods close to 2, 2.5, 5, and 10. This indicates that the model uses these specific frequencies, or Fourier features, prominently in its computation of addition.
read the caption
Figure 3: Analysis of logits in Fourier space for all the test data across the last 15 layers. For both the MLP and attention modules, outlier Fourier components have periods around 2, 2.5, 5, and 10.

🔼 This figure shows heatmaps visualizing the magnitude of sine and cosine components of the Fourier Transform of the logits for MLP and attention modules across layers 32-47. The heatmaps reveal that specific frequencies (corresponding to periods of roughly 2, 2.5, 5, and 10) consistently show high magnitudes across many layers, suggesting these frequencies are important for the model’s addition calculations. The consistent appearance of these specific frequencies across many layers supports the claim that the model uses Fourier features in its computation.
read the caption
Figure 3: Analysis of logits in Fourier space for all the test data across the last 15 layers. For both the MLP and attention modules, outlier Fourier components have periods around 2, 2.5, 5, and 10.

🔼 This figure shows the prediction accuracy of a fine-tuned GPT-2-XL model at different layers. The accuracy is initially low but gradually improves, suggesting a process of approximation followed by refinement. Heatmaps illustrate the logits across MLP and attention layers, revealing that MLP layers primarily focus on approximation (magnitude of the answer) while attention layers perform modular addition (even/odd, mod 10, etc.).
read the caption
Figure 1: (a) Visualization of predictions extracted from fine-tuned GPT-2-XL at intermediate layers. Between layers 20 and 30, the model's accuracy is low, but its prediction is often within 10 of the correct answer: the model first approximates the answer, then refines it. (b) Heatmap of the logits from different MLP layers for the running example, 'Put together 15 and 93. Answer: 108'. The y-axis represents the subset of the number space around the correct prediction, while the x-axis represents the layer index. The 33-rd layer performs mod 2 operations (favoring even numbers), while other layers perform other modular addition operations, such as mod 10 (45-th layer). Additionally, most layers allocate more weight to numbers closer to the correct answer, 108. (c) Analogous plot for attention layers. Nearly all attention modules perform modular addition.
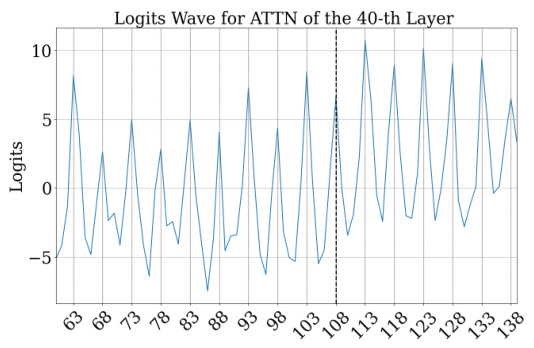
🔼 This figure visualizes the prediction accuracy and logits across different layers of a fine-tuned GPT-2-XL model for an addition task. Panel (a) shows that the model initially approximates the answer before refining it layer-by-layer. Panels (b) and (c) are heatmaps showing how MLP and attention layers contribute to this process, with MLP layers focusing on magnitude approximation and attention layers on modular addition.
read the caption
Figure 1: (a) Visualization of predictions extracted from fine-tuned GPT-2-XL at intermediate layers. Between layers 20 and 30, the model's accuracy is low, but its prediction is often within 10 of the correct answer: the model first approximates the answer, then refines it. (b) Heatmap of the logits from different MLP layers for the running example, 'Put together 15 and 93. Answer: 108'. The y-axis represents the subset of the number space around the correct prediction, while the x-axis represents the layer index. The 33-rd layer performs mod 2 operations (favoring even numbers), while other layers perform other modular addition operations, such as mod 10 (45-th layer). Additionally, most layers allocate more weight to numbers closer to the correct answer, 108. (c) Analogous plot for attention layers. Nearly all attention modules perform modular addition.

🔼 This figure visualizes the predictions of a fine-tuned GPT-2-XL model at different layers during the addition task. Part (a) shows that the model’s accuracy improves progressively layer by layer, indicating it first approximates the result and then refines it. Parts (b) and (c) are heatmaps showing how MLP and attention layers contribute to the prediction. MLP layers primarily focus on approximating the magnitude of the answer using low-frequency components, while attention layers primarily perform modular addition (e.g., computing whether the answer is even or odd) using high-frequency components.
read the caption
Figure 1: (a) Visualization of predictions extracted from fine-tuned GPT-2-XL at intermediate layers. Between layers 20 and 30, the model's accuracy is low, but its prediction is often within 10 of the correct answer: the model first approximates the answer, then refines it. (b) Heatmap of the logits from different MLP layers for the running example, 'Put together 15 and 93. Answer: 108'. The y-axis represents the subset of the number space around the correct prediction, while the x-axis represents the layer index. The 33-rd layer performs mod 2 operations (favoring even numbers), while other layers perform other modular addition operations, such as mod 10 (45-th layer). Additionally, most layers allocate more weight to numbers closer to the correct answer, 108. (c) Analogous plot for attention layers. Nearly all attention modules perform modular addition.

🔼 This figure visualizes the prediction accuracy of a fine-tuned GPT-2-XL model at different layers during the addition task. It shows that the model initially approximates the answer before refining it through modular addition operations. The heatmaps highlight the contributions of MLP and attention layers, with MLP layers focusing on approximation and attention layers on modular addition.
read the caption
Figure 1: (a) Visualization of predictions extracted from fine-tuned GPT-2-XL at intermediate layers. Between layers 20 and 30, the model's accuracy is low, but its prediction is often within 10 of the correct answer: the model first approximates the answer, then refines it. (b) Heatmap of the logits from different MLP layers for the running example, 'Put together 15 and 93. Answer: 108'. The y-axis represents the subset of the number space around the correct prediction, while the x-axis represents the layer index. The 33-rd layer performs mod 2 operations (favoring even numbers), while other layers perform other modular addition operations, such as mod 10 (45-th layer). Additionally, most layers allocate more weight to numbers closer to the correct answer, 108. (c) Analogous plot for attention layers. Nearly all attention modules perform modular addition.
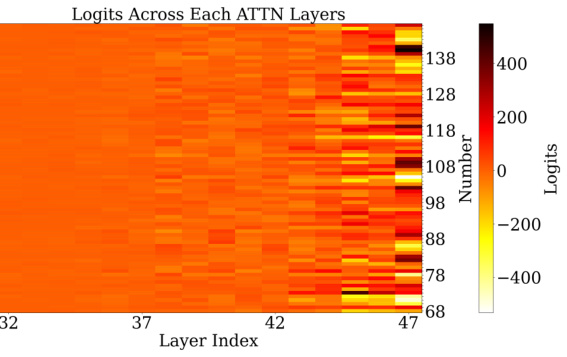
🔼 This figure visualizes the model’s prediction accuracy at different layers, showing that it first approximates then refines the answer. Heatmaps illustrate the logits from MLP and attention layers for a sample addition problem, revealing the use of low-frequency features for approximation and high-frequency features for modular addition by different layers.
read the caption
Figure 1: (a) Visualization of predictions extracted from fine-tuned GPT-2-XL at intermediate layers. Between layers 20 and 30, the model's accuracy is low, but its prediction is often within 10 of the correct answer: the model first approximates the answer, then refines it. (b) Heatmap of the logits from different MLP layers for the running example, 'Put together 15 and 93. Answer: 108'. The y-axis represents the subset of the number space around the correct prediction, while the x-axis represents the layer index. The 33-rd layer performs mod 2 operations (favoring even numbers), while other layers perform other modular addition operations, such as mod 10 (45-th layer). Additionally, most layers allocate more weight to numbers closer to the correct answer, 108. (c) Analogous plot for attention layers. Nearly all attention modules perform modular addition.

🔼 This figure visualizes the model’s prediction accuracy and logit distributions across different layers for an addition task. It shows that the model initially approximates the answer before iteratively refining it through modular addition operations performed by attention layers and magnitude approximation by MLP layers.
read the caption
Figure 1: (a) Visualization of predictions extracted from fine-tuned GPT-2-XL at intermediate layers. Between layers 20 and 30, the model's accuracy is low, but its prediction is often within 10 of the correct answer: the model first approximates the answer, then refines it. (b) Heatmap of the logits from different MLP layers for the running example, 'Put together 15 and 93. Answer: 108'. The y-axis represents the subset of the number space around the correct prediction, while the x-axis represents the layer index. The 33-rd layer performs mod 2 operations (favoring even numbers), while other layers perform other modular addition operations, such as mod 10 (45-th layer). Additionally, most layers allocate more weight to numbers closer to the correct answer, 108. (c) Analogous plot for attention layers. Nearly all attention modules perform modular addition.
Full paper#


