↗ OpenReview ↗ NeurIPS Homepage ↗ Chat
TL;DR#
Graph Neural Networks (GNNs) excel in semi-supervised node classification, but lack reliable uncertainty estimates. Conformal prediction offers a solution, but its prediction sets are often large and inefficient. This poses a significant challenge in high-stakes applications where misclassifications are costly. Existing methods like Adaptive Prediction Sets (APS) try to address this, but they have limitations.
This paper introduces Similarity-Navigated Adaptive Prediction Sets (SNAPS), a novel algorithm designed to improve conformal prediction for GNNs. SNAPS leverages feature similarity and structural neighborhood information to intelligently aggregate non-conformity scores, resulting in smaller, more efficient prediction sets. The method is rigorously evaluated on various datasets, demonstrating superior performance compared to existing techniques while maintaining the desired level of coverage. Theoretical guarantees of SNAPS’s validity are also provided.
Key Takeaways#
Why does it matter?#
This paper is important because it addresses the critical need for reliable uncertainty quantification in graph neural networks (GNNs), a rapidly growing field with numerous applications. By proposing SNAPS, a novel algorithm that significantly improves the efficiency of conformal prediction sets while maintaining validity, this work makes significant contributions to the reliability and trustworthiness of GNN predictions. This is particularly crucial in high-stakes applications where erroneous predictions can be costly or dangerous. Furthermore, the theoretical analysis and broad experimental evaluation on various datasets demonstrate the generalizability and effectiveness of the proposed method, opening new avenues for research in robust and reliable GNN applications.
Visual Insights#

This figure demonstrates the impact of aggregating non-conformity scores from similar nodes on the efficiency of conformal prediction sets. Panel (a) shows that increasing the number of nodes with the same label as the target node reduces the prediction set size while maintaining coverage. Panel (b) shows that nodes with the same label tend to have higher feature similarity. Panel (c) visually confirms the effectiveness of using k-NN based on feature similarity for selecting similar nodes.

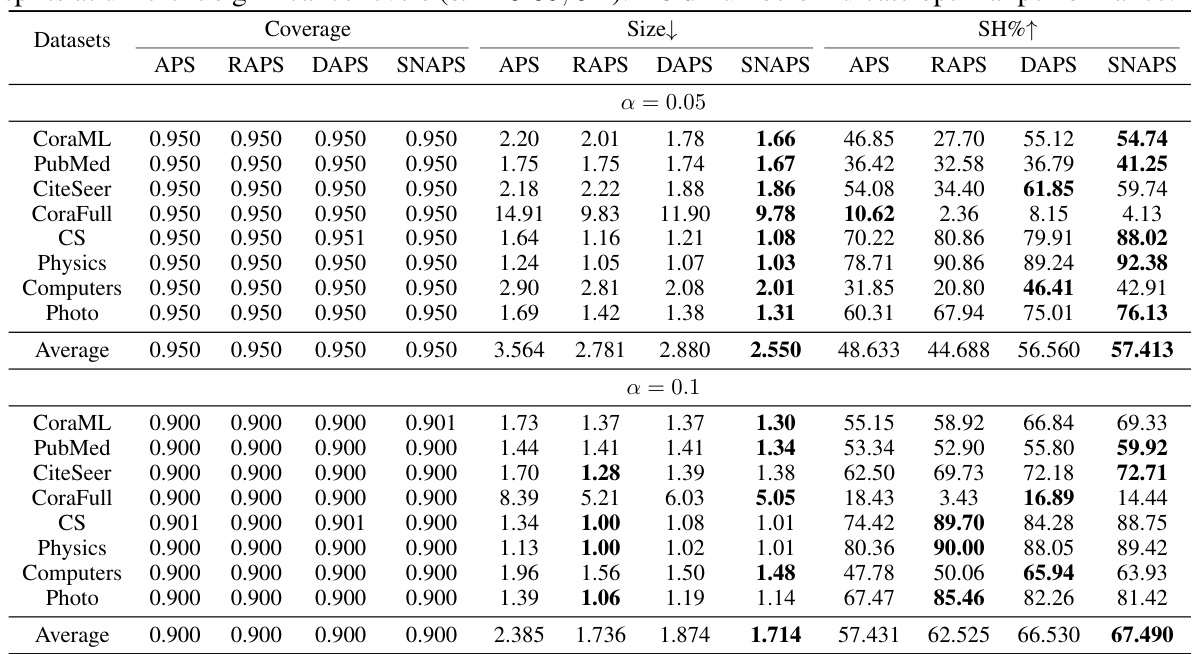
This table presents the results of coverage, average prediction set size, and singleton hit ratio for various node classification methods (APS, RAPS, DAPS, and SNAPS) across ten datasets. The results are averaged over ten runs, each with 100 conformal splits at a significance level of 0.05, demonstrating the performance of SNAPS against other methods.
In-depth insights#
SNAPS Algorithm#
The SNAPS algorithm offers a novel approach to conformal prediction for graph neural networks by leveraging both feature similarity and structural neighborhood information. Its core innovation lies in adaptively aggregating non-conformity scores from nodes likely to share the same label as the ego node, thereby refining prediction sets. This approach contrasts with existing methods that either ignore global node information or only consider direct neighbors. The use of similarity and structural information allows SNAPS to identify and weight nodes for aggregation more effectively, improving prediction set compactness and the singleton hit ratio while maintaining valid marginal coverage. Theoretical guarantees of finite-sample coverage are provided, further strengthening its reliability. Empirical evaluations demonstrate SNAPS’ superiority over existing methods across various datasets, highlighting its practical effectiveness. The adaptive nature of the algorithm, combined with its theoretical grounding, positions SNAPS as a significant advancement in reliable prediction for graph data.
Global Node Info#
The concept of “Global Node Info” in graph neural network (GNN) research is intriguing. It suggests that a node’s classification isn’t solely determined by its immediate neighbors, but also by the broader network context. This challenges the localized nature of many existing GNN architectures and methods. The inclusion of global information presents both opportunities and challenges. On one hand, it offers the potential for improved accuracy and robustness by providing a more holistic view. However, incorporating global information can significantly increase computational complexity and introduce scalability issues. Moreover, carefully selecting the way this global information is integrated is crucial to avoid biasing results and preserving the model’s validity. One approach could involve aggregating information from nodes with similar features or those that are structurally distant but belong to the same label. Effective use of global information may also require considering the trade-off between accuracy, computational cost, and explainability. Therefore, future research could explore novel methods for efficiently and effectively incorporating global node information in GNN models for node classification.
ImageNet Results#
An ImageNet experiment section in a research paper would ideally present results demonstrating the effectiveness of a proposed method on a large-scale image classification benchmark. Key aspects to look for include: quantitative metrics such as accuracy, precision, recall, F1-score, and AUC, ideally compared against established baselines; qualitative analysis of the model’s performance on various image categories, showcasing its strengths and weaknesses; efficiency metrics that evaluate computational cost (time, memory); and a discussion of any unexpected outcomes or limitations encountered. Crucially, the results need to be presented clearly and concisely, with appropriate visualizations (graphs, tables) to aid understanding. A strong ImageNet results section should clearly show whether the novel approach offers a significant improvement over existing methods. Statistical significance of the reported results should also be clearly stated, using methods like p-values or confidence intervals to ensure the observed improvements are not due to chance.
Theoretical Bounds#
A theoretical bounds section in a research paper would ideally establish mathematical guarantees on the performance of a proposed method. For instance, it might provide upper and lower bounds on the algorithm’s runtime or error rate. This is crucial for understanding the method’s scalability and reliability. The analysis should clearly state all necessary assumptions, proving the bounds rigorously. Tight bounds, those closely approximating the actual performance, are highly desirable, as they offer more predictive power. However, overly simplified assumptions might lead to loose bounds that are less informative. A strong theoretical bounds section would also compare the derived bounds with existing results, showing improvement or limitations compared to state-of-the-art. The discussion of these bounds should clearly connect to the practical implications of the work, explaining how the theoretical results influence real-world usage and limitations. Connecting theory to practice is key; ideal bounds inform expectations, but realistic ones acknowledge the complexities of implementation.
Future Research#
Future research directions stemming from this work on Similarity-Navigated Adaptive Prediction Sets (SNAPS) for graph neural networks could explore several promising avenues. Extending SNAPS to inductive node classification is crucial, as the current transductive setting limits its applicability to real-world scenarios with continuous data streams. Improving the efficiency of node selection within SNAPS is key; exploring more sophisticated similarity measures and incorporating higher-order neighborhood information could lead to more accurate and computationally efficient predictions. Theoretical analysis of SNAPS under heterophily is also important, as the current theoretical guarantees are based on the homophily assumption. Finally, applying SNAPS to other graph-related tasks, such as link prediction, graph classification, and community detection, would broaden its impact and demonstrate its versatility across diverse graph-based applications. Investigating the impact of different non-conformity scores and exploring various aggregation strategies within SNAPS warrants further study. The robustness of the proposed approach to various model architectures could also be addressed through additional experiments.
More visual insights#
More on figures

This figure illustrates the three main steps of the Similarity-Navigated Adaptive Prediction Sets (SNAPS) algorithm. First, a basic non-conformity score (e.g., Adaptive Prediction Sets or APS) is calculated from node embeddings generated by a Graph Neural Network (GNN). Second, the SNAPS function refines these scores by aggregating scores from k-nearest neighbors (based on feature similarity) and one-hop neighbors. Finally, conformal prediction uses these corrected scores to produce smaller, more efficient prediction sets.

This figure presents empirical evidence supporting the core idea of SNAPS. Subfigure (a) shows that increasing the number of nodes with the same label as the ego node improves the efficiency (Size) of conformal prediction sets without compromising the coverage guarantee. Subfigure (b) demonstrates that nodes with the same label tend to have higher feature similarity. Subfigure (c) shows the distribution of nodes with the same/different labels within the k-nearest neighbors based on feature similarity, reinforcing the effectiveness of using feature similarity to identify similar nodes.

This figure empirically shows the impact of aggregating non-conformity scores from nodes with the same label as the ego node on the efficiency and coverage of conformal prediction sets. Panel (a) demonstrates that increasing the number of nodes with the same label reduces the average prediction set size while maintaining coverage. Panel (b) visually shows that nodes with the same label tend to have higher feature similarity than nodes with different labels. Panel (c) provides further evidence that selecting k-nearest neighbors based on feature similarity effectively identifies more nodes with the same label.

This figure demonstrates the impact of aggregating non-conformity scores from similar nodes on the efficiency and coverage of conformal prediction. Panel (a) shows that increasing the number of nodes with the same label as the target node reduces the average prediction set size while maintaining coverage. Panel (b) shows that nodes with the same label tend to have higher feature similarity. Panel (c) visually represents the number of similar nodes (k-NN) with the same label and different labels compared to the target node, further supporting the motivation for the SNAPS algorithm.

This figure demonstrates the motivation behind the Similarity-Navigated Adaptive Prediction Sets (SNAPS) algorithm. Subfigure (a) shows how increasing the number of nodes with the same label as the ego node improves the efficiency of conformal prediction by reducing the size of prediction sets while maintaining coverage. Subfigure (b) illustrates the feature similarity between nodes with the same and different labels, highlighting the rationale for using similarity to select nodes. Subfigure (c) provides statistics on the number of nodes with the same and different labels within a k-nearest neighbor graph, showcasing that similarity can indeed help in identifying nodes with the same label.

This figure presents empirical evidence supporting the core idea of SNAPS, which leverages the information from nodes with the same label as the ego node to improve prediction efficiency. Panel (a) shows that increasing the number of nodes with the same label reduces the size of the prediction sets while maintaining coverage. Panel (b) shows the feature similarity is higher between nodes with the same label. Panel (c) demonstrates that using k-NN based on feature similarity effectively selects more nodes with the same label as k increases.
More on tables

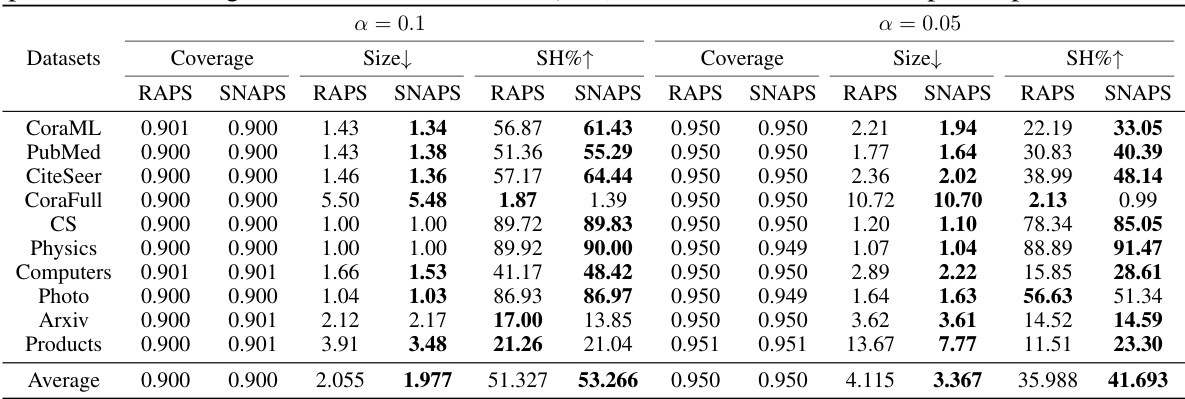
This table presents the results of three metrics (Coverage, Size, and Singleton Hit Ratio (SH)) for different node classification datasets using various methods, including APS, RAPS, DAPS, and the proposed SNAPS. The table compares the performance of these methods in terms of prediction set efficiency (Size) and the accuracy of singleton predictions (SH), while ensuring the validity of the marginal coverage.

This table presents the results of three metrics (Coverage, Size, and Singleton Hit Ratio or SH) for evaluating the efficiency and accuracy of different conformal prediction methods (APS, RAPS, DAPS, and SNAPS) on ten different datasets. The experiment used Graph Convolutional Networks (GCNs) and a significance level of 0.05. SNAPS consistently outperforms the other methods in terms of Size and SH, indicating improved efficiency and accuracy, while maintaining valid Coverage. Bold numbers highlight the best performance for each metric on each dataset.

This table presents the results of three evaluation metrics (Coverage, Size, and Singleton Hit Ratio or SH) for different graph datasets using various methods including Adaptive Prediction Sets (APS), RAPS, DAPS, and the proposed SNAPS algorithm. The results highlight the performance of SNAPS in terms of efficiency (smaller prediction set size) and accuracy (higher singleton hit ratio) while maintaining a valid coverage level.

This table presents the results of three evaluation metrics (Coverage, Size, and Singleton Hit Ratio (SH)) for various node classification datasets using different conformal prediction methods, including APS, RAPS, DAPS, and the proposed SNAPS method. The table compares the performance of these methods on 10 datasets, showing the average values of the metrics across 10 separate runs of a Graph Convolutional Network (GCN) model, each with 100 conformal prediction splits performed at a significance level (alpha) of 0.05. The results demonstrate SNAPS’s ability to achieve high singleton hit ratios while maintaining a valid coverage rate and smaller prediction set sizes compared to the other methods.

This table presents the results of coverage and size for two heterophilous graph datasets (Chameleon and Squirrel). The results are obtained using the FSGNN model and the SNAPS algorithm, with comparisons made against APS and DAPS. The table shows the average values calculated from 100 conformal splits at significance levels α = 0.05 and α = 0.1. Bold numbers highlight the best performance achieved by SNAPS for each metric and significance level.

This table compares the performance of SNAPS and CF-GNN on three graph datasets, in terms of prediction set size and computation time. Results are shown for two different significance levels (α = 0.05 and α = 0.1). SNAPS consistently shows smaller prediction set sizes and faster computation times, indicating improved efficiency.

This table presents the results of applying different conformal prediction methods (APS, RAPS, DAPS, and SNAPS) to several datasets using Graph Convolutional Networks (GCNs). It compares the methods across three metrics: Coverage (the percentage of times the prediction set contains the true label), Size (the average size of the prediction sets), and Singleton Hit Ratio (SH, the percentage of times the prediction set contains only the true label and is size one). The results show the effectiveness of SNAPS in generating smaller and more accurate prediction sets compared to other methods. The table highlights the best performance for each metric using bold numbers.

This table presents the results of experiments evaluating the performance of different methods (APS, RAPS, DAPS, and SNAPS) for semi-supervised node classification on ten different datasets. The metrics reported are Coverage (empirical marginal coverage), Size (average size of prediction sets), and SH (singleton hit ratio). The results demonstrate SNAPS’ superiority in terms of efficiency (smaller prediction set size) and singleton hit ratio while maintaining valid coverage compared to other methods.

This table presents the results of experiments comparing the performance of different conformal prediction methods (APS, RAPS, DAPS, and SNAPS) on various datasets. The metrics used are Coverage (the percentage of prediction sets that contain the true label), Size (the average size of the prediction sets), and SH (Singleton Hit ratio, the percentage of prediction sets of size one containing the true label). The results show that SNAPS consistently outperforms other methods in terms of efficiency while maintaining a valid coverage.

This table presents the results of evaluating several methods on 10 datasets using three metrics: Coverage, Size, and Singleton Hit Ratio (SH). The methods compared include APS, RAPS, DAPS, and SNAPS, with SNAPS using the Adaptive Prediction Sets (APS) score as its base. Each method is run 10 times with 100 conformal splits at a significance level (α) of 0.05. The table shows that SNAPS significantly improves efficiency while maintaining coverage compared to other methods. Bold numbers highlight the best performance for each metric on each dataset.

This table presents the results of three metrics (Coverage, Size, and Singleton Hit Ratio (SH)) for different node classification datasets using various methods, including APS, RAPS, DAPS, and SNAPS. The table compares the performance of these methods in terms of the average size of the prediction sets they generate, while ensuring that the ground truth label is included at a specified confidence level (95%). Lower size values indicate better efficiency, while a higher SH indicates a greater proportion of perfectly accurate predictions.

This table presents the performance of different conformal prediction methods (APS, RAPS, DAPS, and SNAPS) on ten different datasets using Graph Convolutional Networks (GCNs). The metrics reported include the empirical marginal coverage (Coverage), the average size of the prediction sets (Size), and the singleton hit ratio (SH). The table highlights the superior performance of SNAPS in terms of efficiency (smaller prediction set size) while maintaining valid coverage.
Full paper#


