TL;DR#
Many AI training methods aim to maximize an agent’s learning progress by selecting the best environments for the AI agent to learn from, a field known as curriculum learning. However, current approaches often use flawed metrics for selecting training environments, leading to inefficient learning. This is because current methods wrongly associate environments with high success rates as being more useful for learning. In reality, environments with moderate success rates (those where the agent sometimes succeeds and sometimes fails) are the ones that offer the greatest opportunities for learning and improvement.
This paper tackles this limitation by introducing a new method called Sampling for Learnability (SFL). SFL directly prioritizes environments where the agent’s success rate is neither too high nor too low—promoting learning by tackling those environments that offer the greatest learning opportunity. Through rigorous testing across several environments, SFL demonstrates significantly improved performance compared to existing methods, showcasing its ability to generate more robust and versatile AI agents. The paper also introduces a novel evaluation metric (CVaR) that more accurately measures an agent’s ability to generalize to unseen environments.
Key Takeaways#
Why does it matter?#
This paper is crucial for researchers in reinforcement learning and curriculum learning. It identifies a critical flaw in existing unsupervised environment design (UED) methods and proposes a novel solution. The introduction of a new, robust evaluation metric is also a significant contribution that will improve the rigor of future UED research. This work opens new avenues for developing more effective and reliable methods for generating training environments for AI agents.
Visual Insights#

🔼 This figure shows a comparison of three different environments used for testing Unsupervised Environment Design (UED) methods. (a) shows a simple grid-world environment from Minigrid, a common benchmark in reinforcement learning. (b) depicts JaxNav, a new environment designed by the authors that is more similar to real-world robotic navigation tasks. (c) shows a real-world robotics scenario (sourced from [17]), which JaxNav is intended to mimic more closely than Minigrid.
read the caption
Figure 1: JaxNAV (b) brings UED, often tested on Minigrid (a), closer to the real world (c)

🔼 This table shows the hyperparameters used in the paper’s experiments, specifying values for different parameters related to PPO (Proximal Policy Optimization), Adam (optimizer), PLR (Prioritized Level Replay), and ACCEL (Automated Curriculum Learning) across different environments (JaxNav single-agent, JaxNav multi-agent, Minigrid, and XLand). It details settings for the number of updates, learning rate, batch size, buffer size, scoring function, and other relevant parameters for each algorithm and environment.
read the caption
Table 4: Learning Hyperparameters.
In-depth insights#
Regret Approx. Flaw#
The section ‘Regret Approx. Flaw’ would critically analyze the shortcomings of existing methods that approximate regret in unsupervised environment design (UED). It would highlight the disconnect between theoretical maximization of regret and the practical approximations used. The authors likely demonstrate that current approximations correlate more strongly with the agent’s success rate than with actual regret, leading to inefficient learning. This flaw is significant because UED aims to maximize regret to optimally challenge the agent, forcing it to learn robust and generalized policies. Instead of pushing the agent towards its performance boundaries, the flawed approximations guide UED to focus on already mastered tasks, hindering significant progress. The analysis would likely reveal how this impacts the overall efficacy of UED methods, potentially showcasing the limited gains in out-of-distribution performance as a direct consequence of this fundamental error in metric approximation. The paper would then propose solutions or alternative methodologies to address this critical flaw and improve the theoretical grounding and empirical performance of UED.
SFL: A New Method#
The proposed method, Sampling For Learnability (SFL), offers a novel approach to curriculum discovery in reinforcement learning by directly targeting environments with high learnability. Unlike existing methods that often prioritize environments based on flawed regret approximations, SFL leverages a simple yet intuitive scoring function that identifies scenarios where an agent can sometimes succeed but not consistently, representing ideal learning opportunities. This approach avoids the pitfalls of focusing on already mastered or impossible tasks, ensuring that training experiences maximally contribute to skill development. By directly optimizing for learning signals, SFL exhibits improved performance and robustness in various domains. Its efficacy is clearly demonstrated through superior performance against state-of-the-art methods in multiple challenging environments, indicating its potential for broader applicability across diverse reinforcement learning applications.
Learnability Focus#
The concept of ‘Learnability Focus’ in this context emphasizes a shift from maximizing regret (the difference between an optimal agent and the current agent’s performance) to prioritizing environments that offer the agent a substantial learning opportunity. Existing Unsupervised Environment Design (UED) methods often fail because their regret approximations poorly correlate with actual learnability. A ‘Learnability Focus’ would instead identify environments where the agent’s success rate is neither perfect (100%) nor zero (0%), meaning the agent can sometimes solve the task but not always. This approach is intuitively appealing because it emphasizes those scenarios that push the agent’s capabilities without leading to frustration or wasted experience. The core idea is to directly optimize for ’learnability’ - situations where progress is likely. This contrasts with existing approaches that inadvertently focus on already-mastered tasks, resulting in inefficient learning. This ‘Learnability Focus’ leads to more robust and generalizable agents, particularly in complex domains with high partial observability. A key contribution of this approach would be the development of new evaluation metrics that better reflect robustness in challenging real-world scenarios, providing an improvement over methods that use arbitrary hand-designed levels for testing.
Risk-Based Evaluation#
The proposed “Risk-Based Evaluation” protocol offers a significant advancement in assessing the robustness of unsupervised environment design (UED) methods. Instead of relying on limited, hand-designed test sets, which may not fully capture the diversity of real-world scenarios, this approach introduces a more rigorous, data-driven evaluation. By calculating the Conditional Value at Risk (CVaR) of success across a large sample of randomly generated levels, the methodology directly targets the worst-case performance, providing a more comprehensive assessment of an agent’s generalization capabilities and robustness. This shift from average performance to worst-case performance offers a more realistic evaluation of UED’s ability to produce agents capable of handling unexpected or difficult environments. This risk-focused metric is crucial in ensuring that UED methods produce truly robust agents, avoiding overfitting to specific scenarios and promoting more generalizable and adaptable AI systems.
UED Method Limits#
The limitations of current Unsupervised Environment Design (UED) methods center on their reliance on inaccurate regret approximations. Instead of prioritizing environments that truly maximize regret (the difference between optimal and current agent performance), these methods correlate more strongly with success rate. This leads to agents spending significant training time in already-mastered environments, hindering progress on more challenging, and ultimately more informative, tasks. The focus shifts from maximizing learning potential to simply maximizing immediate reward, which severely limits the generalization capabilities of the resulting agents. A more effective approach would directly target environments with high learnability, prioritizing those where the agent occasionally succeeds but doesn’t consistently solve the task. This would provide a better learning signal, accelerating skill acquisition and fostering robustness to out-of-distribution scenarios.
More visual insights#
More on figures

🔼 This figure presents an analysis of three different score functions used in Unsupervised Environment Design (UED) methods for reinforcement learning. The functions are MaxMC (Maximum Monte Carlo), PVL (Positive Value Loss), and a novel ‘Learnability’ metric proposed by the authors. The plots show the correlation between each score function and the mean success rate of an agent on different levels (tasks) in the environment. The key finding is that the MaxMC and PVL scores do not strongly correlate with the learnability metric, which is defined as the probability of success multiplied by the probability of failure (p*(1-p)). In contrast, the learnability metric shows a clear relationship with the mean success rate, indicating levels where the agent sometimes succeeds and sometimes fails are better for learning.
read the caption
Figure 2: Our analysis of UED score functions shows that they are not predictive of 'learnability'.

🔼 This figure shows the results of the single-agent JaxNav experiment. The left panel (a) displays the Conditional Value at Risk (CVaR) of success at different levels (α) of risk, showing how the agent performs on its worst-performing α% of levels. The right panel (b) presents the average return on a hand-designed test set, showing general performance. The figure highlights that SFL (Sampling For Learnability) achieves superior robustness (CVaR) compared to other methods, with only the oracle method achieving similar performance on both metrics.
read the caption
Figure 3: Single-agent JaxNav performance on (a) a-worst levels and (b) a challenging hand-designed test set. Only Perfect (Oracle) Regret matches SFL across both metrics.

🔼 This figure shows a comparison of the performance of different methods on single-agent JaxNav. Each cell in the heatmap represents the number of environments where one method (X-axis) solved a certain percentage of levels, while another method (Y-axis) solved a different percentage. The diagonal represents scenarios where both methods solved the same percentage of levels, while the area below the diagonal indicates that SFL consistently outperformed other methods in solving a higher percentage of environments.
read the caption
Figure 4: Single-agent JaxNav comparison results. For each figure, cell (x, y) indicates how many environments have method X solving them x% of the time and method Y solving them y% of the time. The density below the diagonal indicates that SFL is more robust than DR, ACCEL and PLR.

🔼 This figure compares the performance of different curriculum learning methods on a single-agent robot navigation task. (a) shows the Conditional Value at Risk (CVaR) of success, measuring robustness by evaluating performance on the worst-performing α% of levels. (b) shows performance on a hand-designed test set, representing human-relevant scenarios. SFL consistently outperforms other methods in terms of robustness (a), and nearly matches the performance of the ‘Perfect Regret’ oracle method (which has access to perfect regret information) in both (a) and (b).
read the caption
Figure 3: Single-agent JaxNav performance on (a) a-worst levels and (b) a challenging hand-designed test set. Only Perfect (Oracle) Regret matches SFL across both metrics.

🔼 This figure shows a comparison of the performance of four different methods (SFL, DR, ACCEL, and PLR) on the single-agent JaxNav environment. Each cell in the heatmaps represents the number of environments where method X (on the x-axis) solved a certain percentage of environments and method Y (on the y-axis) solved another percentage of the same environments. The darker the color, the more environments fall into that specific cell. The heatmaps highlight the relative robustness of SFL compared to other methods.
read the caption
Figure 4: Single-agent JaxNav comparison results. For each figure, cell (x, y) indicates how many environments have method X solving them x% of the time and method Y solving them y% of the time. The density below the diagonal indicates that SFL is more robust than DR, ACCEL and PLR.

🔼 This figure displays the results of a single-agent experiment on JaxNav, comparing the performance of different methods. Subfigure (a) shows the Conditional Value at Risk (CVaR) of success at different alpha levels (a). It illustrates the robustness of each method by showing its performance on the worst-performing a% of levels. Subfigure (b) presents the average return on a hand-designed test set, evaluating performance on human-relevant levels. The key finding is that the Sampling For Learnability (SFL) method significantly outperforms other methods in terms of robustness (a) and achieves comparable performance on human-designed levels (b).
read the caption
Figure 3: Single-agent JaxNav performance on (a) a-worst levels and (b) a challenging hand-designed test set. Only Perfect (Oracle) Regret matches SFL across both metrics.
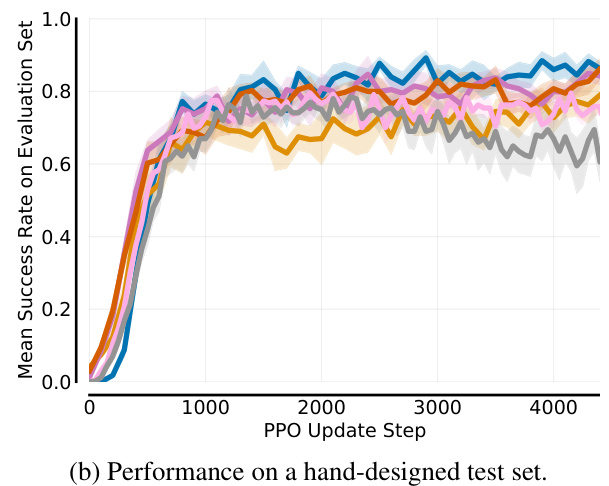
🔼 This figure compares the performance of different methods on single-agent JaxNav tasks. (a) shows the Conditional Value at Risk (CVaR) of success, indicating robustness by evaluating performance on the worst-performing α% of levels. (b) displays mean success rate on a hand-designed test set, a more standard evaluation metric. The results show that the proposed Sampling For Learnability (SFL) method significantly outperforms other methods in terms of robustness (a), achieving results comparable to an oracle with perfect regret information. Although performance on the hand-designed set (b) is closer across methods, SFL still demonstrates competitive performance.
read the caption
Figure 3: Single-agent JaxNav performance on (a) a-worst levels and (b) a challenging hand-designed test set. Only Perfect (Oracle) Regret matches SFL across both metrics.
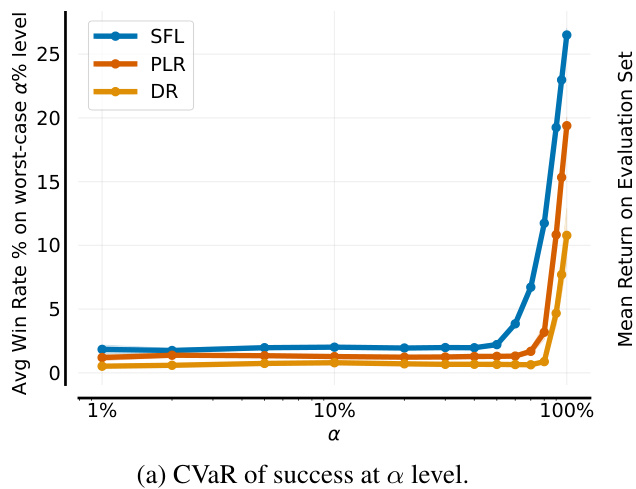
🔼 This figure displays the results of a single-agent experiment on the JaxNav environment. The left plot (a) shows the Conditional Value at Risk (CVaR) of success at different α levels (representing the average success rate on the worst α% of levels). The right plot (b) presents the mean return on a challenging, hand-designed test set. The key finding is that SFL (Sampling for Learnability) outperforms existing methods in terms of robustness (CVaR) and performance on the hand-designed test set, with only an oracle method achieving similar results. This highlights the effectiveness of SFL in generating robust and adaptable agents.
read the caption
Figure 3: Single-agent JaxNav performance on (a) a-worst levels and (b) a challenging hand-designed test set. Only Perfect (Oracle) Regret matches SFL across both metrics.
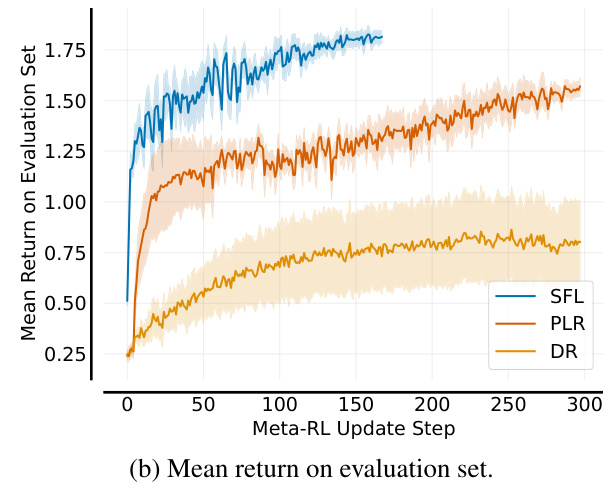
🔼 This figure shows the performance comparison between Sampling For Learnability (SFL) and other methods on single-agent JaxNav. The left plot (a) shows the Conditional Value at Risk (CVaR) of success at different risk levels (α). SFL outperforms others in terms of robustness by achieving high success rates even in the worst α% of levels. The right plot (b) displays the mean return on a hand-designed test set, revealing that the SFL method and the Perfect Regret method (oracle) achieve similar performance. This indicates that the success of SFL is based on its ability to prioritize levels that improve the policy.
read the caption
Figure 3: Single-agent JaxNav performance on (a) a-worst levels and (b) a challenging hand-designed test set. Only Perfect (Oracle) Regret matches SFL across both metrics.

🔼 This figure shows three different environments used in the paper to test the Unsupervised Environment Design (UED) methods. (a) shows a simple grid world environment from Minigrid, which is a commonly used benchmark for UED. (b) shows the JaxNav environment, a new environment introduced in the paper that is more complex and realistic, and closely inspired by a real-world robotics problem. (c) shows a real-world robot navigation scenario, demonstrating the practical application of the developed methods.
read the caption
Figure 1: JaxNAV (b) brings UED, often tested on Minigrid (a), closer to the real world (c)

🔼 This figure shows a set of hand-designed test levels for evaluating single-agent navigation policies in the JaxNav environment. Each level presents a unique challenge for the agent in terms of obstacle layout and path planning complexity, from simple straight paths to more intricate routes that require careful maneuvering and decision-making.
read the caption
Figure 9: Hand-Designed Test Set for Single Agent JaxNav Policies.

🔼 This figure shows eight different hand-designed levels from the Minigrid environment used in the paper’s experiments. These levels vary in complexity, with some being simple and others more intricate mazes. The levels are used as a standard testbed to evaluate the performance of different curriculum learning methods, providing a consistent benchmark for comparing algorithm performance across various approaches.
read the caption
Figure 11: Hand-designed Minigrid Levels [3, 22, 23].

🔼 This figure presents an analysis of three different score functions used in Unsupervised Environment Design (UED) methods for reinforcement learning. The functions are MaxMC, Positive Value Loss (PVL), and Learnability (a new metric proposed by the authors). Each function’s score is plotted against the mean success rate of an agent on a given level. The plots show that MaxMC and PVL have a strong correlation with success rate, which indicates that these functions are not effective at identifying the frontier of learning, where the agent can sometimes solve a level but not always. In contrast, Learnability shows a weaker correlation with success rate but a stronger correlation with the new metric, suggesting that this metric is a better indicator of level difficulty and potential learning progress.
read the caption
Figure 2: Our analysis of UED score functions shows that they are not predictive of 'learnability.'

🔼 This figure presents an analysis of three different scoring functions used in Unsupervised Environment Design (UED) methods for reinforcement learning. The x-axis represents the mean success rate of an agent on different levels (environments), while the y-axis shows the score assigned to those levels by each of the three methods: MaxMC, Positive Value Loss (PVL), and Learnability (the authors’ proposed method). Scatter plots show the relationship between success rate and the scores generated by each function. The plots demonstrate a weak or nonexistent correlation between the MaxMC and PVL scores and a novel “learnability” metric defined by the authors. This suggests that the existing UED scoring functions do not accurately capture the concept of “learnability,” which is crucial for effective curriculum design.
read the caption
Figure 2: Our analysis of UED score functions shows that they are not predictive of “learnability.”

🔼 This figure shows the performance comparison between SFL and other methods in single-agent JaxNav. The left subplot (a) presents the conditional value at risk (CVaR) of success at level α, which measures the robustness of the methods on their worst-performing levels. The right subplot (b) displays the mean return on a hand-designed test set. SFL shows superior robustness across different levels of α, and its performance is comparable to a perfect regret oracle only on the hand designed test set.
read the caption
Figure 3: Single-agent JaxNav performance on (a) a-worst levels and (b) a challenging hand-designed test set. Only Perfect (Oracle) Regret matches SFL across both metrics.

🔼 This figure presents a comparison of the performance of different methods (DR, ACCEL, PLR, and SFL) on single-agent JaxNav environments. For each pair of methods, a heatmap is shown where each cell (x,y) represents the number of environments where method X solved x% of the time and method Y solved y% of the time. The heatmaps visualize the relative performance of SFL against other approaches, demonstrating its higher robustness in solving a wider range of environments compared to other methods.
read the caption
Figure 4: Single-agent JaxNav comparison results. For each figure, cell (x, y) indicates how many environments have method X solving them x% of the time and method Y solving them y% of the time. The density below the diagonal indicates that SFL is more robust than DR, ACCEL and PLR.

🔼 This figure shows the results of single-agent JaxNav experiments. Subfigure (a) displays the Conditional Value at Risk (CVaR) of success at different levels (α) of risk, demonstrating SFL’s robustness compared to other methods. Subfigure (b) shows the mean return on a hand-designed test set, where SFL again demonstrates strong performance comparable to only the ‘Perfect Regret’ oracle.
read the caption
Figure 3: Single-agent JaxNav performance on (a) a-worst levels and (b) a challenging hand-designed test set. Only Perfect (Oracle) Regret matches SFL across both metrics.

🔼 This figure displays a comparison of the performance of different curriculum learning methods in a single-agent robotic navigation environment. Subfigure (a) shows the Conditional Value at Risk (CVaR) of success at level α, a measure of robustness against the worst-performing α% of levels. Subfigure (b) shows the performance on a hand-designed test set, representing human-relevant tasks. The results indicate that Sampling For Learnability (SFL) achieves superior performance, especially in terms of robustness, compared to other methods.
read the caption
Figure 3: Single-agent JaxNav performance on (a) a-worst levels and (b) a challenging hand-designed test set. Only Perfect (Oracle) Regret matches SFL across both metrics.

🔼 This figure shows a comparison of three environment metrics (shortest path, number of walls, and solvability) for levels selected by different UED methods (SFL, PLR, and DR) in the single-agent JaxNav environment. It visually represents how the level characteristics differ across these methods, showing that SFL tends to select levels with longer shortest paths, fewer walls, and higher solvability compared to the others. This suggests that SFL prioritizes more challenging yet solvable levels, consistent with the paper’s emphasis on learning environments in the ‘sweet spot’ of difficulty.
read the caption
Figure 18: Environment Metrics for single-agent JaxNav for SFL, PLR and DR.
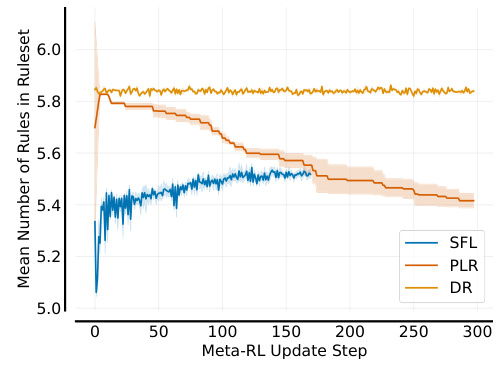
🔼 The figure shows the mean number of rules for the PLR/SFL buffer rulesets in XLand-Minigrid. SFL samples well below the mean value throughout training, whereas PLR starts on par with DR before tending easier as training progresses. This result, coupled with the performance difference, illustrates how SFL’s learnability score allows it to find the frontier of learning, leading to more robust agents.
read the caption
Figure 19: Environment Metrics for XLand-Minigrid.

🔼 This figure shows examples of levels generated by different curriculum learning methods (ACCEL, PLR, DR, and SFL) in the XLand-Minigrid environment. Each method’s level generation strategy reflects its underlying approach to curriculum design; visually, the levels differ in terms of complexity and obstacle distribution.
read the caption
Figure 23: Levels in Xland-Minigrid generated by each method.

🔼 This figure shows example levels generated by four different methods (ACCEL, PLR, DR, and SFL) in the XLand-Minigrid environment. Each method’s level generation approach is different, leading to visually distinct level designs. The image provides a visual comparison of the types of environments generated by each method in this particular domain.
read the caption
Figure 23: Levels in Xland-Minigrid generated by each method.

🔼 This figure shows example levels generated by different UED methods (ACCEL, PLR, DR, and SFL) in the XLand-Minigrid environment. Each method’s level generation strategy is reflected in the visual characteristics of the generated levels, showing differences in complexity, obstacle placement, and overall layout.
read the caption
Figure 23: Levels in Xland-Minigrid generated by each method.

🔼 This figure shows example levels generated by different curriculum learning methods (DR, PLR, and SFL) in the XLand-Minigrid environment. Each method’s level generation strategy results in visually distinct layouts and potentially different levels of complexity and difficulty for the agent to solve.
read the caption
Figure 23: Levels in Xland-Minigrid generated by each method.

🔼 This figure shows the ablation study on the hyperparameters of the Sampling For Learnability (SFL) method in the single-agent JaxNav environment. It displays the impact of varying each hyperparameter (Number of Sampled Levels, Rollout Length, Buffer Size, Buffer Update Period, Sampled Environments Ratio, Buffer Sampling Strategy) on the average conditional value at risk (CVaR) of success at different alpha levels (α). Each subfigure shows how changing one hyperparameter, while keeping the others fixed at their default values, affects the performance of the algorithm. The results provide insights into the optimal settings of these hyperparameters for achieving the best robustness in the algorithm.
read the caption
Figure 24: Analysing the effect of hyperparameters on single-agent JaxNav. Hyperparameters not mentioned in each plot use the default configuration's values: N = 5000, T = 50, ρ = 0.5, K = 1000, L = 2000.

🔼 This figure shows the ablation study on the hyperparameters of the Sampling For Learnability (SFL) method in the single-agent JaxNav environment. Each subplot presents the effect of varying one hyperparameter (Number of Sampled Levels, Rollout Length, Buffer Size, Buffer Update Period, and Sampled Environments Ratio) on the average win rate percentage on the worst-case α% levels. The results demonstrate the impact of each hyperparameter on the robustness and performance of the SFL algorithm. The default values used for hyperparameters that aren’t being varied are specified in the caption.
read the caption
Figure 24: Analysing the effect of hyperparameters on single-agent JaxNav. Hyperparameters not mentioned in each plot use the default configuration's values: N = 5000, T = 50, ρ = 0.5, K = 1000, L = 2000.

🔼 This figure presents an analysis of the correlation between three different score functions used in Unsupervised Environment Design (UED) methods and the mean success rate of an agent on those levels. The three score functions are MaxMC (Maximum Monte Carlo), PVL (Positive Value Loss), and Learnability (a novel metric proposed in the paper). The figure shows that MaxMC and PVL do not correlate well with learnability, while the proposed Learnability metric shows a strong correlation with levels that are neither too easy nor too difficult for the agent, i.e., levels at the frontier of learning.
read the caption
Figure 2: Our analysis of UED score functions shows that they are not predictive of 'learnability'.

🔼 This figure shows a comparison of different methods for training reinforcement learning agents on a single-agent robot navigation task. The left panel (a) displays the Conditional Value at Risk (CVaR) of success, a robustness measure, for various methods across different percentages (alpha) of worst performing levels. It shows SFL, a new method proposed in the paper, outperforms existing methods in robustness. The right panel (b) shows the mean return on a hand-designed test set, demonstrating that SFL achieves comparable performance to other methods on this standard evaluation metric, highlighting its overall effectiveness.
read the caption
Figure 3: Single-agent JaxNav performance on (a) a-worst levels and (b) a challenging hand-designed test set. Only Perfect (Oracle) Regret matches SFL across both metrics.
More on tables

🔼 This table lists the parameters used to define the JaxNav environment. These parameters control aspects such as the size of the grid, the robot’s movement capabilities, the LiDAR sensor specifications, reward structure, and other relevant details. The table is broken into sections for ‘Dynamics’ and ‘Reward Signal’ to organize parameters by their function in the simulation.
read the caption
Table 1: JaxNav Parameters

🔼 This table lists the hyperparameters used in the paper’s experiments. It includes hyperparameters for the Proximal Policy Optimization (PPO) algorithm, Prioritized Level Replay (PLR), Accelerated Curriculum Learning (ACCEL), and Sampling for Learnability (SFL) methods, separately detailing settings for single-agent and multi-agent JaxNav, Minigrid, and XLand environments. Each hyperparameter’s value is specified for each method and environment.
read the caption
Table 4: Learning Hyperparameters.

🔼 This table presents a statistical analysis of the learnability and success rates of levels selected by different curriculum learning methods (PLR, ACCEL, SFL) during training. The analysis is performed by averaging the learnability and success rate of levels within each method’s buffer at different training steps and averaging these across three different seeds. The results highlight the difference in level selection strategies between the various methods, particularly SFL’s focus on more challenging, learnable levels.
read the caption
Table 5: The learnability and success rates for levels within the PLR/ACCEL/SFL buffers averaged over training. At each evaluation step, the average and median values for the entire buffer are calculated and then averaged over training. The mean and standard deviation across three different seeds are reported.

🔼 This table shows the mean and standard deviation of the compute time for training RL agents using different curriculum learning methods (DR, RobustACCEL, RobustPLR, ACCEL, PLR, and SFL) in the single-agent JaxNav environment. The compute time is reported for each method across three different seeds, providing a measure of the variability in runtime. The results are crucial for understanding the computational efficiency and scalability of each method.
read the caption
Table 6: Mean and standard deviation of time taken for single-agent JaxNav over 3 seeds.
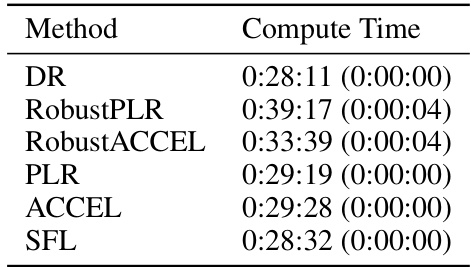
🔼 This table shows the mean and standard deviation of compute time for different reinforcement learning methods on the Minigrid environment. The experiments were run over three seeds to ensure statistical reliability. The methods compared include Domain Randomization (DR), Robust Prioritized Level Replay (RobustPLR), Robust ACCEL, Prioritized Level Replay (PLR), ACCEL, and Sampling for Learnability (SFL). The results show the average compute time for each method, indicating the efficiency of each algorithm in terms of computational resource usage.
read the caption
Table 7: Mean and standard deviation of time taken for Minigrid over 3 seeds.

🔼 This table compares the time it takes for a single iteration, including training and evaluation, for both PLR and SFL methods on Minigrid. It breaks down the time for each step: the training step, getting learnable levels (which only applies to SFL), and the evaluation step. The total time for one iteration is also presented.
read the caption
Table 8: PLR and SFL timings for a single minigrid iteration
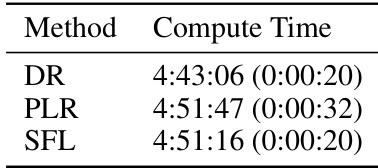
🔼 This table shows the average compute time and standard deviation for three different UED methods (DR, PLR, and SFL) on the XLand-Minigrid environment. The compute time is measured over five different random seeds, indicating the variability in the time taken for each method to complete training. This provides a measure of the computational cost of each method on this specific environment.
read the caption
Table 9: Mean and standard deviation of time taken for XLand-Minigrid over 5 seeds.
Full paper#


