↗ OpenReview ↗ NeurIPS Homepage ↗ Chat
TL;DR#
Traditional Bayesian inference methods struggle with high-dimensional data, where calculating the posterior distribution is computationally expensive. Variational approaches offer scalability but lack theoretical guarantees, often producing overconfident estimates. Sampling methods provide strong theoretical guarantees but scale poorly. This paper tackles these challenges by exploring diffusion-based models (DBMs).
The authors introduce ‘inflationary flows,’ a novel class of DBMs. These models leverage the connection between stochastic and probability flow ODEs. Inflationary flows deterministically map high-dimensional data to a lower-dimensional Gaussian distribution while preserving local structure and uncertainty. The method offers invertible and neighborhood-preserving maps with controllable numerical error, enabling accurate uncertainty quantification. Experimental results on toy and benchmark image datasets demonstrate the effectiveness and efficiency of the approach.
Key Takeaways#
Why does it matter?#
This paper is crucial for researchers seeking calibrated Bayesian inference in high-dimensional data. It offers a novel solution by leveraging diffusion-based models and overcoming existing limitations of variational and sampling methods. The unique approach of mapping high-dimensional data to a lower-dimensional Gaussian distribution, preserving local neighborhood structure, is particularly valuable for complex data analysis where uncertainty quantification is critical. The method shows promise across various fields, opening new avenues for advanced applications.
Visual Insights#

This figure illustrates the duality between stochastic differential equations (SDEs) and probability flow ordinary differential equations (pfODEs) in diffusion-based models. It shows how both an SDE (noisy, mixing process) and a pfODE (deterministic, neighborhood-preserving process) can lead to the same sequence of marginal probability densities, described by a Fokker-Planck equation. The key is that both models require knowledge of the score function of the data distribution.

This table presents the Fréchet Inception Distance (FID) scores and round-trip Mean Squared Error (MSE) for the AFHQv2 and CIFAR-10 datasets. The results are shown for different numbers of preserved dimensions (1, 2, 30, 62, 307, 615, 1536, 3041, and 3072) while maintaining a constant inflation gap of 1.02. The FID and MSE values represent the mean and ±2 standard deviations of three independent runs, each with 50,000 samples for FID and 10,000 for MSE. Lower FID scores indicate better image generation quality, and lower MSE indicates better accuracy in roundtrip image reconstruction.
In-depth insights#
Inflationary Flows#
The concept of “Inflationary Flows” in the context of Bayesian inference using diffusion-based models presents a novel approach to address the challenges of high-dimensional integration and calibrated uncertainty quantification. The core idea involves using a deterministic, invertible, and neighborhood-preserving map defined by a probability flow ODE (pfODE) to transform high-dimensional data into a lower-dimensional Gaussian distribution. This “inflationary” process is achieved by progressively smoothing the data distribution, analogous to a controlled diffusion process. The invertibility of the map enables accurate propagation of uncertainties from the data space to the latent space. This is contrasted with traditional variational methods which often suffer from overconfident uncertainty estimates. The method’s effectiveness is demonstrated through simulations and experiments on toy datasets and benchmark image datasets. Key features include its deterministic nature, controllable numerical error, and ability to preserve or reduce intrinsic data dimensionality. The unique mapping ensures identifiability, mitigating issues encountered with other methods. The learned pfODE is effectively employed for calibrated Bayesian inference, enabling robust uncertainty quantification and accurate posterior estimation.
DBM repurposing#
This research paper explores the repurposing of diffusion-based models (DBMs) for calibrated Bayesian inference. Traditionally strong in generative modeling, DBMs are adapted here to address limitations in existing Bayesian methods. The core idea is to leverage the inherent connection between the stochastic differential equations (SDEs) and probability flow ordinary differential equations (pfODEs) underlying DBMs. This duality allows the deterministic mapping of high-dimensional data to a lower-dimensional Gaussian distribution, ensuring uncertainty is correctly propagated. The use of pfODEs allows for deterministic, invertible transformations which is a key advantage over variational approaches, which are often overconfident and non-identifiable. The authors introduce ‘inflationary flows,’ a novel class of pfODEs, to uniquely and deterministically perform this mapping. These flows are demonstrably effective, accurately representing and potentially reducing the intrinsic data dimensionality, paving the way for principled Bayesian inference.
Posterior Calibration#
Posterior calibration, a critical aspect of Bayesian inference, focuses on how well the approximate posterior distribution, q(z|x), reflects the true posterior, p(z|x). Accurate posterior calibration is crucial for reliable uncertainty quantification, allowing researchers to make informed decisions based on the estimated model parameters. The paper explores how diffusion-based models (DBMs), particularly the novel ‘inflationary flows’, can address the challenges associated with traditional methods like variational inference (VI), which often yield overconfident uncertainty estimates. Inflationary flows leverage the inherent connection between stochastic differential equations (SDEs) and probability flow ODEs (pfODEs) in DBMs to create a deterministic, invertible mapping between high-dimensional data and a low-dimensional Gaussian distribution. This unique approach helps to ensure that data uncertainties are correctly propagated to the latent space, leading to more accurate and calibrated Bayesian inference. The success of this method relies on proper estimation of the score function which underpins both the DBMs and pfODEs, highlighting the critical need for accurate score function approximation. Finally, the paper emphasizes the unique identifiability afforded by inflationary flows, which contrasts with the non-identifiability often seen in VI-based methods.
Dimensionality Control#
The concept of dimensionality control is crucial in the paper, addressing the challenge of high-dimensional data in Bayesian inference. The authors cleverly leverage diffusion-based models (DBMs) to map high-dimensional data to a lower-dimensional Gaussian distribution. This is achieved through a deterministic and invertible mapping, preserving local neighborhood structure and enabling accurate uncertainty quantification. This dimensionality reduction is not arbitrary; the authors introduce two key strategies: dimension-preserving flows that maintain the intrinsic dimensionality of the data, measured using the participation ratio; and dimension-reducing flows that intentionally compress the data, achieving significant dimensionality reduction with minimal loss in generative performance. The choice between these strategies depends on the specific application and desired level of compression, demonstrating the flexible nature of the proposed inflationary flows. Overall, dimensionality control forms the backbone of this paper, enabling the application of Bayesian inference to complex high-dimensional datasets where traditional methods would fall short.
Limitations of PR#
The participation ratio (PR) as a dimensionality measure presents several limitations in the context of the proposed inflationary flows. PR’s reliance on second-order statistics means it primarily focuses on the principal components, potentially overlooking intricate, non-linear relationships within the data. This could lead to inaccurate dimensionality assessments, especially when dealing with non-linear manifolds or data exhibiting complex dependencies. Moreover, PR’s invariance to linear transformations limits its ability to capture dimensionality changes produced by the non-linear mappings inherent in inflationary flows. The choice of PR also influences the selection of compression schemes, leading to a preference for compressing dimensions less significant in terms of variance. This approach can lead to a loss of crucial information and affects the overall efficacy of dimensionality reduction. In essence, while PR provides a computationally convenient measure of dimensionality, its limitations restrict the flexibility and scope of the inflationary flow model. Future work could explore more sophisticated dimensionality metrics to overcome these limitations.
More visual insights#
More on figures

This figure shows the results of numerical simulations for five toy datasets using dimension-preserving flows. The left side shows the ‘inflation’ process, where the probability flow ODE (pfODE) is integrated forward in time, gradually transforming data into a Gaussian distribution. The right side demonstrates the ‘generation’ process, where the pfODE is integrated backward in time, creating data samples from the Gaussian distribution. Each row represents a different toy dataset, and the score function is learned from a neural network trained on the specific dataset. The figure illustrates that dimension-preserving flows map data while maintaining its intrinsic dimensionality.

This figure shows numerical simulations of dimension-preserving flows on five toy datasets. Each dataset is visualized with a sequence of sub-panels showing how the model’s probability flow ODE transforms the data (inflation, integrating forward in time) and generates samples from it (generation, integrating backward). The left sub-panels show the forward process, and the right sub-panels illustrate the generation process. The color scheme represents the density of the data points. Each panel shows a distinct stage in the transformation, demonstrating how the method preserves the data’s intrinsic dimensionality during these transitions.

This figure demonstrates the calibration experiments performed to assess the error in the posterior model estimates. It uses Hamiltonian Monte Carlo (HMC) for inference on a 2D circles toy dataset. The figure shows the generative process, where samples are drawn from a 3-component Gaussian Mixture Model (GMM) prior and then integrated backward in time. The resulting data space samples are displayed. Kernel density estimates of the joint posterior samples are shown for dimension-preserving and dimension-reducing cases. The dashed lines indicate the posterior means for each component, with reference ground-truth weights provided.

This figure shows the results of generation and round-trip experiments on the AFHQv2 dataset with different numbers of preserved dimensions using inflationary flows. The top row displays generated samples for four different flow schedules, while the bottom row shows the corresponding reconstructed samples after a round-trip process of mapping to and from a lower-dimensional latent space. The four schedules vary in how much compression is applied, demonstrating the models ability to generate high-quality images even with significant dimensionality reduction.

This figure displays results for generation and round-trip experiments performed on the AFHQv2 dataset using inflationary flows with different numbers of preserved dimensions. The top row shows generated samples obtained with four different flow schedules (PR-Preserving, PR-Reducing to 2D, 30D, and 307D) at an inflation gap of 1.02. The bottom row presents the corresponding round-trip results, showcasing how well the original samples are recovered after being mapped to a Gaussian latent space and then back to data space. The leftmost columns show the original images. The middle columns represent their corresponding mappings to the latent Gaussian spaces, and the rightmost columns depict the final recovered images.

This figure shows the results of generative and roundtrip experiments on the AFHQv2 dataset with different numbers of preserved dimensions. The top row displays generated samples for different flow schedules (PR-Preserving, PR-Reducing to various dimensions) while the bottom row shows the results of the reverse process, demonstrating reconstruction quality after going through the generative flow. Leftmost columns show the original samples; middle columns show the latent space representation after applying the forward flow; and rightmost columns show the reconstruction after applying the backward flow. This figure highlights the ability of the model to compress high-dimensional data into a lower-dimensional latent space while preserving information needed for generating high quality images.

This figure shows numerical simulations for five toy datasets using dimension-preserving flows. The left side shows the forward integration of the probability flow ordinary differential equation (pfODE) over time (inflation), while the right side shows the reverse integration (generation). The results demonstrate the ability of these flows to maintain the intrinsic dimensionality of the data.

This figure shows numerical simulations of dimension-preserving flows on five toy datasets. Each dataset is visualized in a sequence of sub-panels, with the left side showing the forward integration of the probability flow ordinary differential equation (pfODE) (inflation), and the right side showing backward integration (generation). The score functions used in these simulations are approximations learned from neural networks trained on the corresponding toy datasets. This visualization aims to demonstrate the behavior of dimension-preserving flows in transforming the data distribution.

This figure presents a numerical experiment to evaluate the performance of the proposed inflationary flows model in preserving local neighborhood structure. It uses two toy datasets (2D circles and 3D S-curve) and compares the dimension-preserving and dimension-reducing flows. The experiment involves creating sets of points with known coverage, running the flows (inflation and generation), and measuring the changes in coverage probability. The results show that both types of flows preserve local structures even with significant dimensionality reduction, supporting the model’s ability to perform calibrated Bayesian inference.

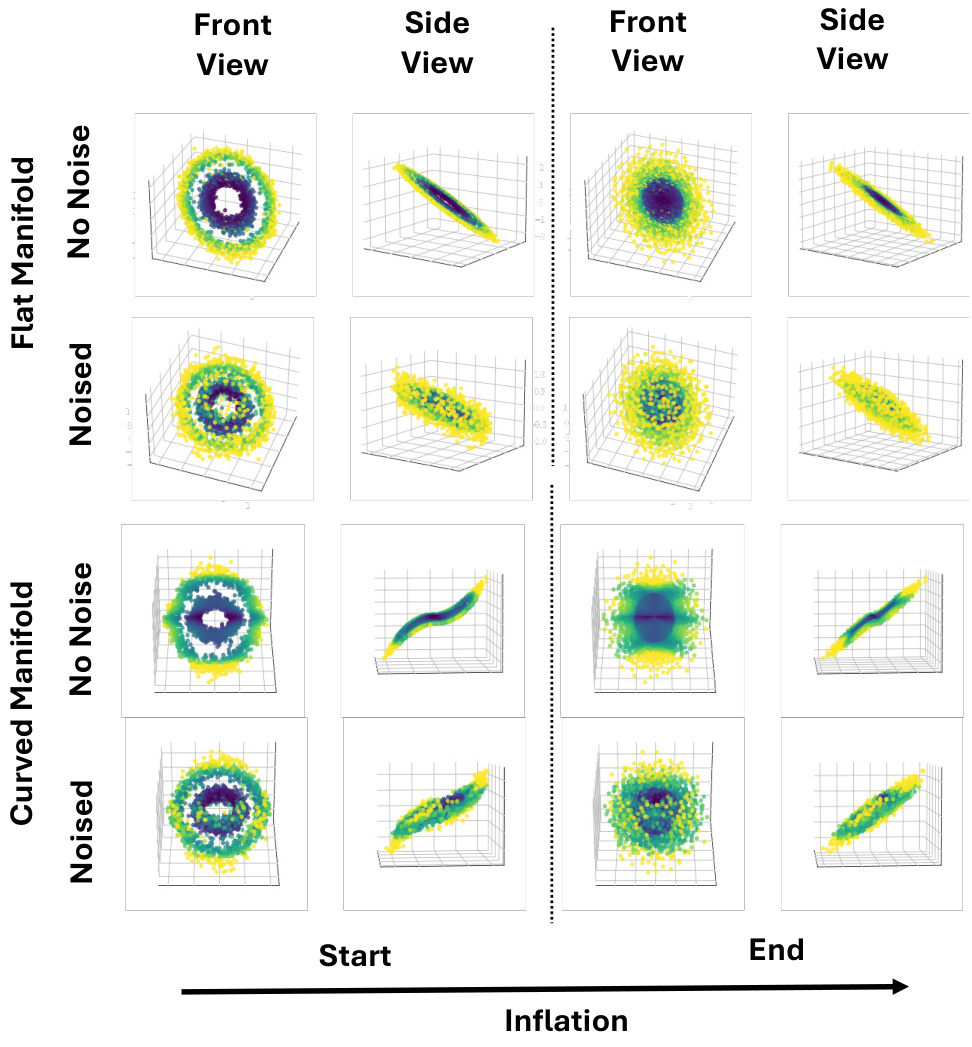
This figure shows the results of additional experiments using PR-Preserving inflationary flows on 2D toy datasets embedded in 3D space. The datasets are represented as either a flat or curved manifold. The simulations are run both with and without added noise. The figure displays front and side views of the data distributions at the start and end of the inflation process. The results demonstrate that the inflationary flows preserve the local neighborhood structure, even when small amounts of noise are added.

This figure shows numerical simulations on five toy datasets for dimension-preserving flows. The left side shows the forward integration of the probability flow ordinary differential equation (pfODE), which is called ‘inflation.’ The right side shows the reverse integration, which is called ‘generation.’ Both ‘inflation’ and ‘generation’ utilize score approximations obtained from neural networks trained for each dataset.

This figure shows numerical simulations of dimension-preserving flows on five different toy datasets. Each dataset is represented by a set of sub-panels showing the forward (inflation) and reverse (generation) flows. The left side shows the data being transformed into a lower-dimensional Gaussian distribution, and the right side shows the reverse process of generating new samples from the Gaussian distribution. Each simulation uses score approximations from neural networks trained on each dataset.
More on tables

This table presents the results of experiments conducted on the AFHQv2 dataset. The experiments varied the inflation gap (IG) while keeping the number of preserved dimensions constant at 2. The table shows the FID (Fréchet Inception Distance) scores and MSE (Mean Squared Error) for round-trip integration for each of the different inflation gaps. Lower FID scores indicate better generation quality, and lower MSE scores indicate better accuracy in the round-trip reconstruction process. As you can see, increasing the inflation gap leads to significantly worse FID scores (lower generation quality) but also better MSE (better reconstruction).

This table compares the Frechet Inception Distance (FID) scores of the proposed Inflationary Flows model against three existing injective flow models (M-Flow, Rectangular Flows, and Canonical Manifold Flows) on the CIFAR-10 dataset. The comparison is done for different numbers of preserved dimensions (30, 40, and 62) to show how the proposed model performs relative to the baselines in terms of generative image quality. Lower FID scores indicate better performance.

This table presents the Frechet Inception Distance (FID) scores and mean squared errors (MSE) for the AFHQv2 and CIFAR-10 datasets. The results are shown for different numbers of preserved dimensions (1, 2, 30, 62, 615, 1536, 3072) while keeping the inflation gap constant at 1.02. The FID and MSE values represent the means and ±2 standard deviations calculated over three independent runs of 50,000 samples for FID and 10,000 for MSE, providing a measure of the variability and uncertainty in the results. Lower FID scores and MSE values indicate better generative performance and accuracy in the roundtrip (data compression and reconstruction).

This table shows the hyperparameters used for training the toy datasets (Circles, Sine, Moons, S Curve, Swirl). It details the total number of dimensions in the original data, the number of dimensions kept in the latent space, the maximum time (tmax) used for integration in the pfODE, and the total training duration in millions of images (Mimg). The schedule column indicates whether the PR-Preserving (PRP) or PR-Reducing (PRR) schedule was used for each dataset.

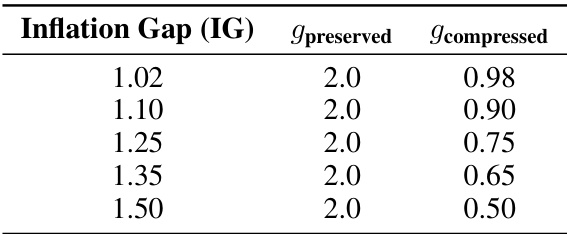
This table shows the values used for the elements of vector g corresponding to preserved and compressed dimensions for different toy experiments. The inflation gap (IG) and the values of gpreserved and gcompressed are presented for each experiment. This table is useful to understand the effect of different compression ratios on the model’s performance.

This table presents the compressed dimension variance for different toy datasets (Circles, Sine, Moons, S Curve, Swirl) under different dimension-reducing (PRR) schedules with varying inflation gaps (IG). The values show how much the variance is reduced in the compressed dimensions depending on the chosen IG, demonstrating the effect of this hyperparameter on the degree of compression.

This table lists the hyperparameters used for training the diffusion-based models on both the CIFAR-10 and AFHQv2 datasets. These hyperparameters remained consistent across all the different noise schedules investigated in the paper. The table includes values for the channel multiplier, channels per resolution, data augmentation (x-flips), augmentation probability, dropout probability, learning rate, learning rate ramp-up, exponential moving average half-life, and batch size.

This table presents the Fréchet Inception Distance (FID) scores and round-trip Mean Squared Error (MSE) values for different numbers of preserved dimensions (ranging from 1 to 3072, representing no compression) on the AFHQv2 and CIFAR-10 datasets. The inflation gap (IG) is held constant at 1.02. The FID and MSE values are averages of three independently generated sets of samples, with their respective standard deviations reported. Lower FID scores indicate better generative performance, while lower MSE values indicate better accuracy in reconstructing the original images after transforming to and from the latent space.

This table shows the training duration (in millions of images) and the exponential inflation constant (ρ) for experiments conducted on the AFHQv2 dataset using variable inflation gaps (IGs). The total number of dimensions is 3072, the dimensions kept are 2, and the IGs are varied from 1.10 to 1.50. The training durations are between 200 and 250 million images.

This table shows the values of the scaling factors g_i used in the PR-Reducing flows for different inflation gaps (IGs). The scaling factor g_i determines the rate of inflation for each dimension, influencing how much compression occurs in that dimension. Specifically, it displays how the scaling factors g_i are determined by the inflation gap. g_preserved remains constant at 2.0, and g_compressed is adjusted to control the compression rate based on the inflation gap.

This table shows the variance of the compressed dimensions in the latent space for different inflation gaps (IGs) for both CIFAR-10 and AFHQv2 datasets. The inflation gap is a parameter that controls the degree of compression applied to the data during dimensionality reduction. A higher inflation gap leads to more aggressive compression.

This table presents the ground truth values for the means, covariance diagonals, and weights of a three-component Gaussian Mixture Model (GMM) used in toy Hamiltonian Monte Carlo (HMC) experiments. These values represent the prior distribution over weights in the experiment. The table is split into two sets of parameters. One set uses dimension-preserving inflationary flows and the other uses dimension-reducing inflationary flows. The parameters used in the HMC experiment are shown.

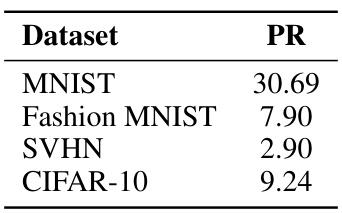
This table shows the participation ratio (PR) values, a measure of intrinsic dimensionality, for four commonly used image datasets: MNIST, Fashion MNIST, SVHN, and CIFAR-10. The PR values indicate the effective dimensionality of the data, reflecting the complexity of the underlying structure. Lower PR values suggest that the data lie on a lower-dimensional manifold embedded within a higher-dimensional space.
Full paper#


