↗ OpenReview ↗ NeurIPS Homepage ↗ Chat
TL;DR#
Large language models (LLMs) are increasingly used, yet their safe deployment remains a challenge. Safety fine-tuning, a technique to align LLMs with human preferences for safety, is widely used. However, recent research reveals that these fine-tuned models remain vulnerable to adversarial attacks such as jailbreaks, which can easily trick the model into generating unsafe outputs. This is a significant issue, as it undermines the reliability and trustworthiness of LLMs.
This paper delves deep into the mechanistic workings of safety fine-tuning methods. The researchers employed a novel synthetic data generation framework to thoroughly investigate the impact of three common safety fine-tuning techniques. They discovered that these methods subtly transform the model’s internal representations, creating distinct clusters for safe and unsafe inputs. However, they also found that adversarial inputs cleverly mimic the activation patterns of safe inputs, effectively bypassing the safety mechanisms. This crucial finding reveals a previously unknown vulnerability of current safety fine-tuning approaches. The paper’s novel synthetic data framework facilitates a more rigorous and controlled analysis compared to prior work using real-world datasets, offering valuable insights into enhancing LLM safety.
Key Takeaways#
Why does it matter?#
This paper is crucial for researchers working on the safety and alignment of large language models (LLMs). It provides novel insights into the mechanisms underlying safety fine-tuning, a critical process for mitigating the risks associated with LLMs. The findings challenge existing assumptions about safety fine-tuning effectiveness, highlighting its limitations and vulnerabilities to adversarial attacks. By proposing a novel synthetic data generation framework and performing extensive experiments on both synthetic and real-world LLMs, the study opens new avenues for developing more robust and reliable safety protocols for LLMs. This research will directly impact the development of safer and more trustworthy LLMs, an area of growing concern.
Visual Insights#

This figure illustrates the synthetic data generation process used in the paper. It shows how an input is broken down into three components: operators (task tokens), operands (text tokens), and outputs. The process uses probabilistic context-free grammars (PCFGs) to generate text tokens, and distinguishes safe from unsafe inputs by associating different task tokens with safe-dominant and unsafe-dominant non-terminal nodes in the PCFG. This allows for the controlled generation of safe and unsafe samples for safety fine-tuning.

This table presents the safety performance of three different safety fine-tuning methods: Unlearning, DPO, and SSFT. For each method, performance is evaluated using two learning rates (ημ and ης). The metrics used are the accuracy of the model in following instructions (Instruct) and the accuracy in outputting null tokens (Null). Additionally, the robustness of each method against three types of jailbreak attacks is tested. The table shows that Unlearning and DPO are more robust than SSFT, particularly against the JB-CO-Text and JB-MisGen attacks.
In-depth insights#
Safety Fine-tuning#
Safety fine-tuning, a crucial technique in aligning Large Language Models (LLMs) with human values, is explored in this research paper. The paper delves into the mechanistic aspects of how different safety fine-tuning methods modify the model’s internal representations. It highlights the minimal transformations in Multilayer Perceptron (MLP) weights, specifically projecting unsafe inputs into the weights’ null space, leading to a clustering effect where safe and unsafe inputs occupy distinct regions. The research investigates well-known methods like supervised fine-tuning, direct preference optimization, and unlearning, providing evidence of how these methods achieve this clustering. A particularly interesting finding is that adversarial attacks, such as jailbreaks, often evade these safety mechanisms by creating input activations that mimic those of safe samples. This bypasses the minimal transformation, essentially tricking the LLM into processing the adversarial input as if it were safe. The study further analyzes the impact of fine-tuning on the local Lipschitzness of the model, showing a decrease in sensitivity for unsafe samples and an increase for safe ones. Ultimately, the paper presents a systematic investigation of safety fine-tuning, providing valuable insights into its functionality, limitations, and vulnerability to adversarial attacks.
Synthetic Data#
The use of synthetic data in evaluating safety fine-tuning for large language models offers several advantages. Synthetic data allows for controlled experiments, enabling researchers to isolate specific factors influencing model safety. By generating data with varying degrees of safety, researchers can precisely assess how well different safety fine-tuning methods perform under controlled conditions. The ability to generate adversarial or jailbreak inputs synthetically is a significant strength, as it allows for a thorough evaluation of a model’s robustness against various attacks, something difficult and potentially unethical to achieve with real-world data. However, a crucial limitation of synthetic data is its inherent artificiality. The success of synthetic data hinges on how well it mimics real-world inputs and their complexities, including the nuances of human language and the subtle ways in which users attempt to manipulate models. If the synthetic data fails to capture these essential characteristics, the results may not accurately generalize to real-world scenarios, potentially leading to overestimation or underestimation of model safety. Therefore, careful design and validation of the synthetic data generation process are critical to ensure that the conclusions are reliable and meaningful. The balance between control and realism is paramount, and a strong focus on validating the synthetic dataset is essential for ensuring trustworthiness and wider applicability of the research findings.
Mechanism Analysis#
A mechanistic analysis of safety fine-tuning in large language models (LLMs) would involve a deep dive into how these methods modify the model’s internal representations to promote safe outputs. The core question is: what specific changes in the model’s weights or activations lead to improved safety? This might involve examining changes in the model’s feature space, looking at how the model clusters safe and unsafe inputs, and analyzing transformations in the weight matrices of neural network layers. A key aspect is understanding how these transformations affect the model’s sensitivity to inputs, looking at whether changes in input lead to disproportionate changes in the output for unsafe vs. safe inputs. This is critical because adversarial attacks or jailbreaks are designed to exploit vulnerabilities in this sensitivity. Analyzing the model’s behavior across different layers and understanding the flow of information is essential for a thorough mechanistic analysis. It is important to note that the goal is to understand the underlying mechanism not just show that safety fine-tuning works. The use of synthetic data generation or carefully controlled experiments with real-world LLMs would be key to isolate different factors and rigorously test hypotheses about the mechanism’s effectiveness and limitations. Finally, a successful mechanistic analysis would link the observed changes in the model to measurable improvements in safety, providing strong evidence that the observed mechanism is truly responsible for enhancing the safety of LLMs.
Jailbreak Attacks#
Jailbreak attacks, in the context of large language models (LLMs), represent a critical challenge to the safety and reliability of these systems. They involve cleverly crafted inputs designed to circumvent safety mechanisms implemented during the training process, causing the LLM to generate outputs that violate intended safety constraints. These attacks exploit vulnerabilities in how the model interprets and responds to certain prompts or instructions. Adversarial attacks form a related, but distinct category, often involving more systematic input manipulations to elicit specific undesirable responses. Successfully defending against jailbreaks requires a deep understanding of both the model’s internal workings and the potential for creative misuse. Robust solutions necessitate ongoing research into improving both the design of safety protocols and the development of more sophisticated detection and mitigation techniques. Mechanistic analysis, such as that explored in the provided research, is crucial to understanding the underlying weaknesses, enabling the creation of more effective safeguards. Ultimately, addressing jailbreaks will be crucial for the responsible and safe deployment of LLMs in real-world applications.
Future Work#
Future research could explore the generalizability of the findings to other LLMs and datasets, examining how model architecture and training data influence the safety mechanisms learned through fine-tuning. A deeper investigation into the interplay between local Lipschitzness and adversarial robustness is warranted, potentially leading to new defense strategies against jailbreaks. Exploring the efficacy of different safety fine-tuning methods for various task types and domains is essential, considering the inherent differences in the nature and distribution of unsafe inputs. Investigating the transferability of the learned safety transformations between different LLMs, particularly those with varying architectures and training paradigms, could shed light on the robustness of the proposed mechanisms. Furthermore, research should investigate the long-term effects of safety fine-tuning on model performance, including generalization and robustness over time, and evaluate the impact on other downstream tasks beyond safety. Finally, developing a standardized evaluation benchmark for safety fine-tuning protocols is crucial, enabling a more objective and comparative assessment of different methods and their effectiveness against diverse adversarial attacks. This holistic approach would pave the way for more secure and reliable deployment of LLMs.
More visual insights#
More on figures

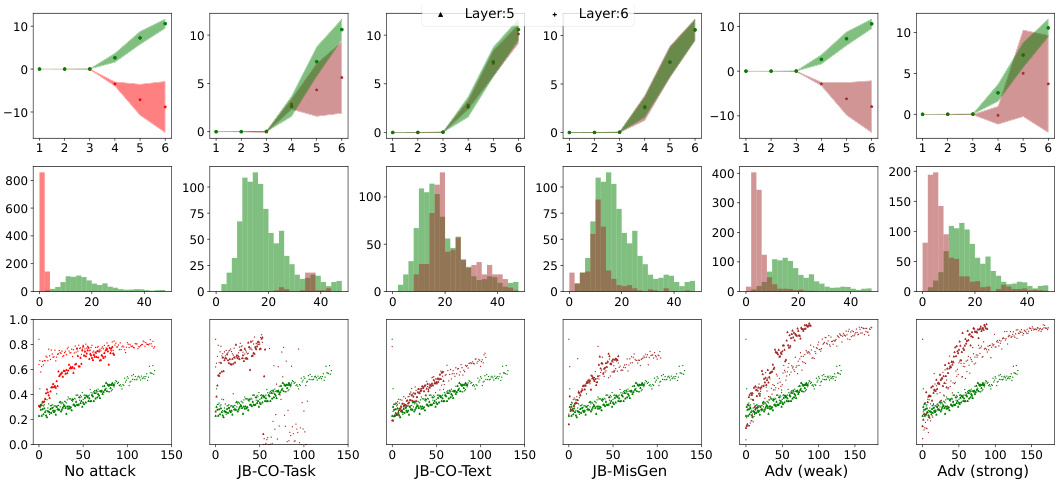
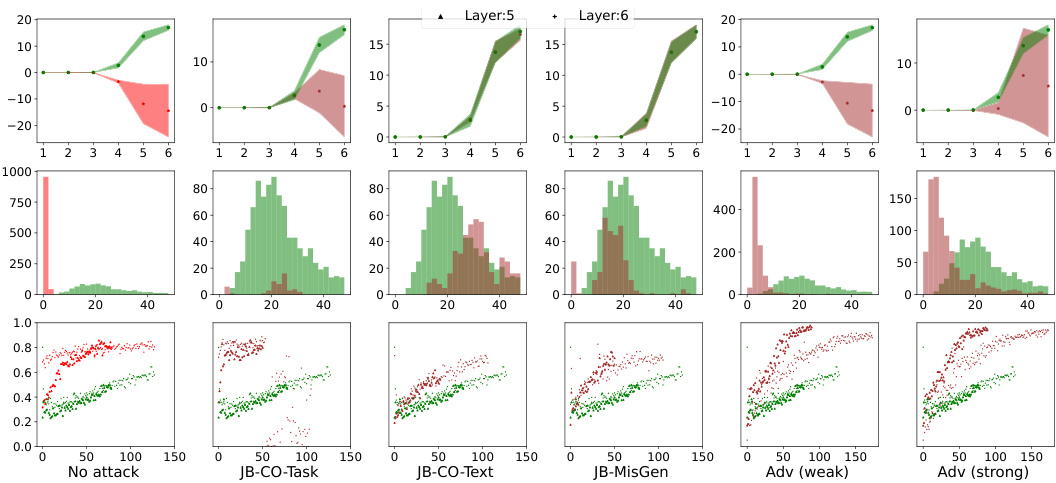
This figure illustrates how jailbreak and adversarial attacks are generated using the proposed synthetic data generation framework. Panel (a) shows the general format of an instruction, which is divided into operators (task tokens), operands (text tokens), and outputs. Panels (b) and (c) depict the generation of jailbreaks with competing objectives, where two tasks (one safe and one unsafe) are presented simultaneously to the model. Panel (d) shows a jailbreak with mismatched generalization, where an input in a different format (e.g., a different language) is used to bypass the model’s safety mechanisms. Finally, panel (e) describes the generation of adversarial attacks, which involve appending learned embeddings to the input to evade safety mechanisms.

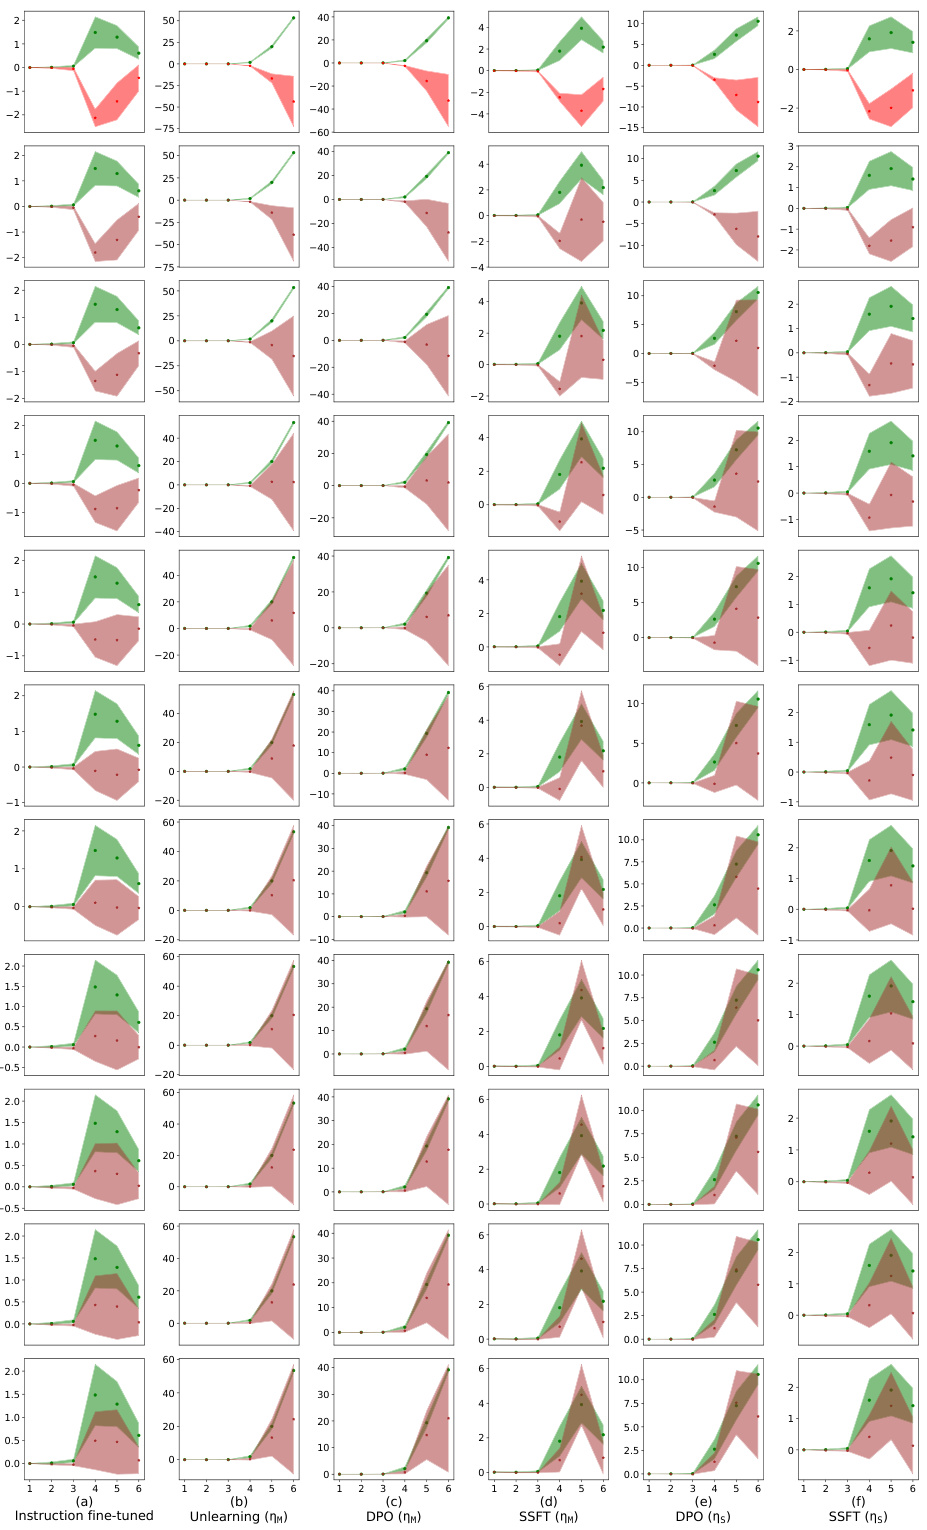
This figure visualizes how safety fine-tuning methods affect the clustering of safe and unsafe input samples in the activation space of the model. The x-axis represents the layer number in the model’s transformer blocks, and the y-axis represents the average τ value, a measure of the Euclidean distance of a sample’s activations from the mean safe and unsafe activations. The top part of the figure shows results from a synthetic dataset, while the bottom displays results from real Llama models (Llama-2 7B and Llama-3 8B). The plot shows that safety fine-tuning leads to the formation of distinct clusters for safe and unsafe samples, and this separation becomes more pronounced as the effectiveness of the fine-tuning method increases (DPO and Unlearning compared to SSFT). This visualization helps understand the model’s ability to distinguish between safe and unsafe inputs based on activation patterns learned through fine-tuning.

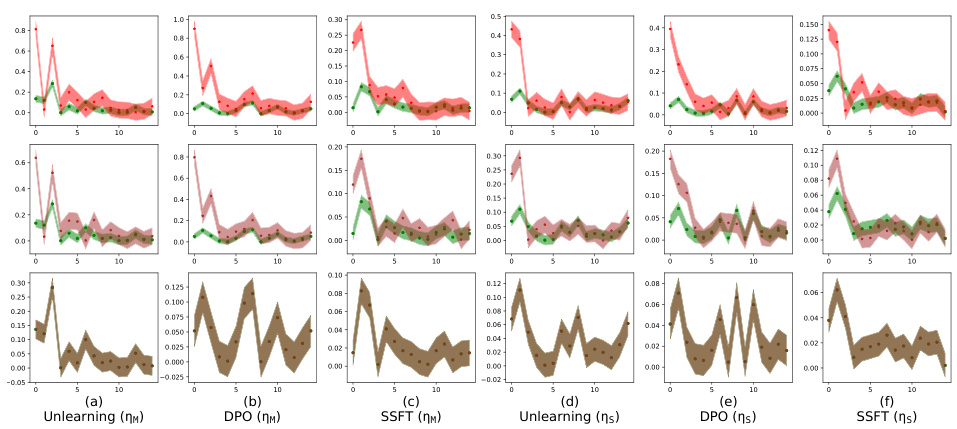
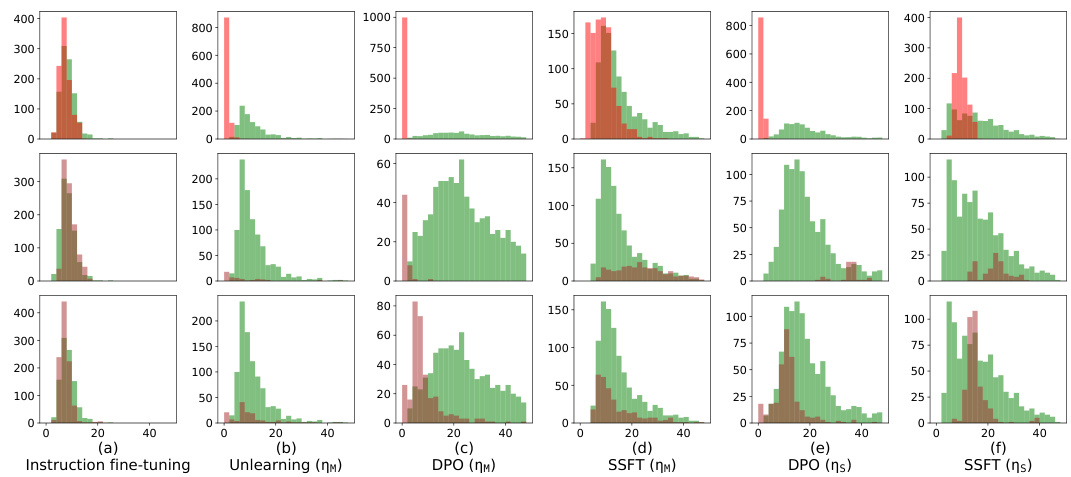
This figure shows the alignment of the column space of the transformation matrix AW (difference between safety fine-tuned and instruction fine-tuned model parameters) with the null space of the instruction fine-tuned model’s first MLP layer (N(WIT)). The y-axis represents the magnitude of the projection of each left singular vector of AW onto N(WIT), and the x-axis shows the index of these singular vectors, ordered by increasing projection magnitude. The results indicate that safety fine-tuning learns transformations that primarily affect unsafe inputs by aligning their column space with the null space of the original weight matrix, leading to a separation of safe and unsafe inputs in the activation space.

This figure visualizes how safety fine-tuning methods affect the activation space of a language model. The x-axis represents the layer number within the model’s architecture, and the y-axis shows the average value of τ, a metric calculated to measure the distance of a sample’s activation from the average activation of safe and unsafe samples. A positive τ indicates a safe sample, while a negative value indicates an unsafe one. The top half displays results from a synthetic dataset generated using a probabilistic context-free grammar, and the bottom shows results from the real-world Llama language model. The Llama results show two fine-tuned versions, Llama-2 chat 7B and Llama-3 chat 8B. The figure demonstrates that stronger safety fine-tuning methods lead to a clearer separation of safe and unsafe samples in the activation space.

This figure shows how safety fine-tuning affects the activation space of LLMs. The top row displays results from a synthetic dataset, while the bottom row shows results from actual Llama models (Llama-2 7B and Llama-3 8B). Each subplot represents a different safety fine-tuning method (Unlearning, DPO, SSFT) and learning rate (ηM, ηS). The x-axis indicates the layer number, and the y-axis shows the average τ (tau) value, a measure of the Euclidean distance between a sample’s activations and the mean activations of safe versus unsafe samples. A clear separation between safe and unsafe samples’ activations is observed, indicating distinct cluster formations. Stronger safety fine-tuning methods generally lead to a greater separation between clusters.

This figure visualizes how safety fine-tuning methods affect the formation of clusters in the activation space of a language model. The x-axis represents the layer number in the model, and the y-axis shows the average value of τ (tau), a measure of the Euclidean distance between a sample’s activation and the mean activation of safe versus unsafe samples. Positive τ values indicate safe samples, and negative values indicate unsafe samples. The top part shows the results using a synthetic dataset, while the bottom part shows results using the Llama language model (Llama-2 7B and Llama-3 8B, which are safety fine-tuned versions). The results demonstrate that safety fine-tuning leads to clearer separation between activations of safe and unsafe samples, with stronger fine-tuning methods showing better separation.

This figure shows that safety fine-tuning leads to a clear separation between safe and unsafe samples in the activation space of the model. The x-axis represents the layer number, and the y-axis shows the average value of τ, which measures the Euclidean distance of a sample’s activations from the mean unsafe versus safe activation. A higher value of τ indicates a stronger separation between safe and unsafe samples. The top part of the figure shows the results using the synthetic data, and the bottom part shows the results using Llama-2 and Llama-3 models. Safety fine-tuned models (Llama-2 chat 7B and Llama-3 chat 8B) show a much clearer separation between safe and unsafe samples than instruction fine-tuned models.

This figure shows that safety fine-tuning leads to the formation of distinct clusters in the activation space for safe and unsafe inputs. The x-axis represents the layer number within the model, and the y-axis shows the average of a metric (τ) that measures the distance of a sample’s activation from the mean activation of safe and unsafe samples. A positive τ value indicates a safe sample, while a negative value indicates an unsafe sample. The top part of the figure shows results from a synthetic dataset, while the bottom shows results using the Llama language models. Stronger safety fine-tuning methods result in greater separation between the clusters.

This figure shows the results of applying three safety fine-tuning methods (supervised safety fine-tuning, direct preference optimization, and unlearning) to a model. The x-axis represents the layer number in the model’s transformer blocks, and the y-axis represents the average of a metric (τ) that measures the distance between a sample’s activations and the mean activations for safe versus unsafe samples. A positive value indicates that the sample is closer to the safe cluster. The top part of the figure shows results from a synthetic data generating process, while the bottom shows results from real-world Llama language models. The figure demonstrates that safety fine-tuning causes the activations of safe and unsafe samples to form distinct clusters in the model’s feature space, with stronger separation achieved by using stronger safety fine-tuning methods. In addition, the bottom part of the figure showcases how this principle applies to real-world, safety-fine-tuned models.

This figure shows that safety fine-tuning leads to the formation of distinct clusters of activations for safe and unsafe samples in the feature space of the model. The degree of separation between these clusters increases with the effectiveness of the safety fine-tuning method used (Unlearning, DPO, SSFT). The top part of the figure displays results obtained using synthetic data, while the bottom displays the results obtained when using real-world Llama language models. The x-axis represents the layer number of a transformer block, while the y-axis represents the average of a metric (τ) that quantifies the distance of each sample’s activations from the mean activations of safe and unsafe samples. The greater the difference in y-axis values between the safe and unsafe samples for a given layer, the more distinct the clustering at that layer.

This figure visualizes how safety fine-tuning methods lead to the formation of distinct clusters in the activation space for safe and unsafe inputs. The x-axis represents the layer number in the model’s architecture, while the y-axis shows the average τ value, a measure of the distance between a sample’s activations and the mean activations of safe versus unsafe samples. Higher τ values indicate better cluster separation. The top row presents results from experiments using synthetic data, while the bottom row shows results obtained using real-world Llama language models. Llama-2 chat 7B and Llama-3 chat 8B specifically represent the safety fine-tuned versions of these models. The results demonstrate that stronger safety fine-tuning methods result in more distinct cluster formations between safe and unsafe samples.

This figure shows that safety fine-tuning leads to the formation of distinct clusters in the activation space for safe and unsafe inputs. The top section illustrates this using data from a synthetic dataset, while the bottom section shows results from the Llama language model (Llama-2 chat 7B and Llama-3 chat 8B being the safety fine-tuned versions). The effectiveness of different safety fine-tuning methods is compared by showing the degree of separation between the clusters. A greater separation suggests a more robust safety mechanism.

This figure shows how safety fine-tuning methods encourage separate cluster formations for safe and unsafe inputs in the activation space of the model. The top half shows the results using synthetic data generated using a context-free grammar, while the bottom half uses real-world language models (Llama-2 and Llama-3). The x-axis represents the layer number in the transformer block, and the y-axis shows the average of τ, a metric that quantifies the difference between the activations of a sample and the mean activations of safe and unsafe samples. A larger value of τ indicates a better separation between safe and unsafe samples, suggesting that stronger safety fine-tuning methods lead to a clearer distinction between these two categories.

This figure shows that safety fine-tuning leads to the formation of distinct clusters in the activation space for safe and unsafe inputs. The top row displays results from a synthetic dataset, while the bottom row shows results from the Llama language models. The x-axis represents the layer number, and the y-axis shows the average τ value (a measure of the distance of a sample’s activation from the mean safe and unsafe activation). A larger separation between the clusters indicates a more effective safety fine-tuning process. Stronger safety fine-tuning methods show a larger separation between safe and unsafe sample clusters.

This figure shows how safety fine-tuning leads to the formation of separate clusters of activations for safe and unsafe samples. The x-axis represents the layer number in the model, while the y-axis represents the average τ, a measure that quantifies the Euclidean distance of a sample’s activations from the mean unsafe versus safe activation. The top part of the figure shows results from a synthetic setup, while the bottom part shows results from using Llama models. The results demonstrate that as the strength of safety fine-tuning increases, the separation between clusters of safe and unsafe samples increases.

This figure visualizes how safety fine-tuning methods (Supervised Safety Fine-tuning, Direct Preference Optimization, and Unlearning) affect the clustering of activations for safe and unsafe inputs in the model’s feature space. The top row shows results from a synthetic dataset, while the bottom row displays results from actual Llama language models (Llama-2 7B and Llama-3 8B). The y-axis represents a measure (τ) quantifying the distance of a sample’s activations from the mean safe versus unsafe activations. The x-axis represents the layer number. Clearer separation between safe and unsafe clusters indicates more effective safety fine-tuning.

This figure visualizes how safety fine-tuning methods affect the formation of clusters in the activation space of a language model. The x-axis represents the layer number, and the y-axis shows the average value of τ (tau), a metric that quantifies the Euclidean distance of a sample’s activations from the mean safe versus unsafe activations. Positive τ values indicate safe samples, negative values unsafe. The top row shows results from a synthetic dataset, while the bottom row shows results for actual Llama language models (Llama-2 7B, Llama-2 chat 7B, Llama-3 8B, Llama-3 chat 8B). The results demonstrate that stronger safety fine-tuning methods lead to a clearer separation between safe and unsafe sample activations.

This figure visualizes how safety fine-tuning methods (SSFT, DPO, and Unlearning) affect the clustering of activations for safe versus unsafe inputs. The x-axis represents the layer number in the model’s transformer blocks, and the y-axis shows the average τ value (calculated using Eq. 2 in the paper), which measures the Euclidean distance of a sample’s activations from the mean unsafe and safe activations. Positive values indicate safe inputs, and negative values indicate unsafe inputs. The top row shows results from the synthetic data generation process, while the bottom row displays results from real-world Llama models. The figure demonstrates that safety fine-tuning leads to distinct clusters of activations for safe and unsafe inputs, with stronger safety fine-tuning methods exhibiting clearer separation. The analysis shows that the cluster separation increases as the strength of the safety fine-tuning protocol increases.

This figure visualizes how safety fine-tuning methods affect the activation space of a language model. The top row shows results from a synthetic dataset, while the bottom row shows results from actual Llama models. Each plot shows the average value of τ (a measure of distance from the mean activation of safe vs. unsafe samples) across different layers of the model. The results suggest that safety fine-tuning causes activations of safe and unsafe samples to form distinct clusters, with the separation increasing as the effectiveness of the fine-tuning method increases.

This figure shows how safety fine-tuning affects the distribution of activations for safe and unsafe inputs in the feature space. The top row displays results using a synthetic dataset, illustrating that as the strength of the safety fine-tuning method increases, the separation between safe and unsafe sample clusters becomes more pronounced. The bottom row shows the results of applying the same analysis to real-world language models (Llama), confirming that the effect also occurs in natural language processing.

This figure visualizes how safety fine-tuning methods affect the clustering of activations for safe versus unsafe inputs. The x-axis represents the layer number in the model’s transformer blocks, and the y-axis represents the average τ value, a metric quantifying the Euclidean distance of a sample’s activations from the mean unsafe versus safe activation. Positive τ values indicate safe inputs, and negative values indicate unsafe inputs. The top panel shows results from synthetic data, and the bottom panel shows results obtained using the Llama language models (Llama-2 7B, Llama-2 chat 7B, Llama-3 8B, Llama-3 chat 8B). The results demonstrate that stronger safety fine-tuning methods lead to greater separation between safe and unsafe sample activations.

This figure shows that safety fine-tuning leads to the formation of distinct clusters in the activation space for safe and unsafe samples. The x-axis represents the layer number of a transformer network, and the y-axis shows the average τ, which quantifies the Euclidean distance of a sample’s activations from the mean safe and unsafe activations. Results are presented for both a synthetic dataset and real-world Llama models. The separation between safe and unsafe clusters increases as stronger safety fine-tuning methods are used, and this effect is visible across multiple layers of the model.

This figure visualizes how safety fine-tuning methods (Unlearning, DPO, SSFT) impact the formation of clusters in the activation space of LLMs. The top row shows results from a synthetic data experiment, while the bottom row displays results from actual Llama models (Llama-2 7B and Llama-3 8B). The x-axis represents the layer number in the model, and the y-axis shows the average τ value (a metric measuring the Euclidean distance between a sample’s activations and the mean activations for safe versus unsafe inputs). The plots demonstrate that safety fine-tuning leads to a clearer separation between safe and unsafe samples in the activation space, with stronger methods producing more distinct clusters.

This figure visualizes how safety fine-tuning methods affect the activation space of a language model. The x-axis represents the layer number within the model’s architecture. The y-axis shows the average value of tau (τ), a metric calculated to quantify the distance of a sample’s activation from the mean activations of safe versus unsafe samples. Positive values of tau indicate safe samples, negative values indicate unsafe samples. The top part of the figure shows results from a synthetic dataset, while the bottom section displays results obtained using Llama language models. The Llama-2 chat 7B and Llama-3 chat 8B models are safety fine-tuned versions of the base models. The figure demonstrates that safety fine-tuning promotes the formation of distinct clusters in the activation space for safe and unsafe inputs, with clearer separation indicated by stronger safety fine-tuning methods.
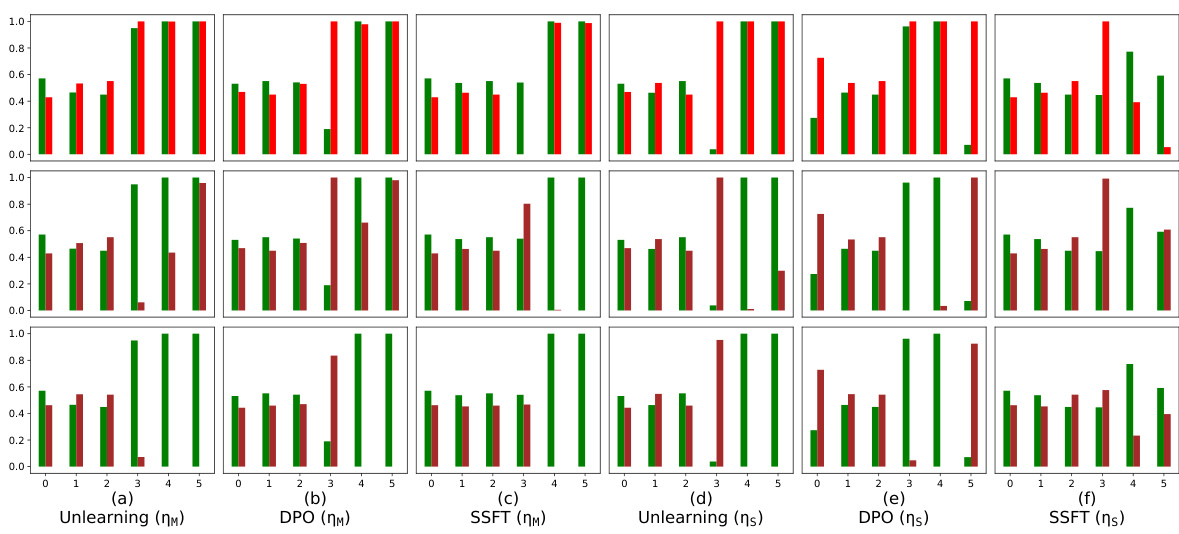
This figure visualizes how safety fine-tuning methods group activations from safe and unsafe inputs in LLMs. The top section shows results from a synthetic dataset, while the bottom uses real-world Llama models. The x-axis represents the layer number in the model, and the y-axis displays the average τ (tau) value calculated using Equation 2, representing the difference in distance between an input’s activation and the average activations of safe and unsafe samples. A larger difference indicates better separation between safe and unsafe clusters.

This figure shows the results of applying different safety fine-tuning methods on both synthetic and real-world data (using Llama models). The x-axis represents the layer number in the transformer model, while the y-axis represents the average τ value. The τ value measures the difference between the Euclidean distance of a sample’s activations from the mean unsafe and safe activations. Positive τ values indicate safe samples, and negative values indicate unsafe samples. The top half shows results from the synthetic dataset, and the bottom half shows results using Llama models. The results illustrate how safety fine-tuning methods lead to the formation of distinct clusters of activations for safe and unsafe samples, with stronger separation for more effective methods.

This figure visualizes how safety fine-tuning methods create distinct clusters in the activation space for safe and unsafe inputs. The x-axis represents the layer number of a neural network, and the y-axis shows the average of a metric (τ) that measures the difference between a sample’s activation and the average activations of safe versus unsafe samples. Positive values of τ indicate safe samples and negative values indicate unsafe samples. The top part shows results from synthetic data, while the bottom displays results obtained using the Llama language model, comparing instruction fine-tuned models with their corresponding safety fine-tuned versions. The results show increased cluster separation with stronger safety fine-tuning methods.
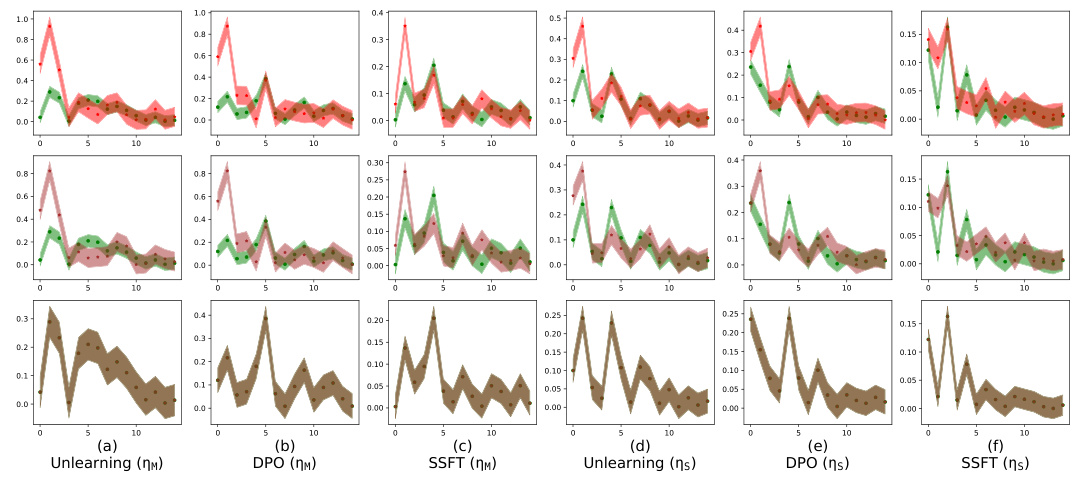
This figure shows how safety fine-tuning affects the clustering of safe and unsafe samples in the activation space of the model. The top part displays results from the synthetic dataset generated by the authors, while the bottom shows results obtained from real-world Llama models. The x-axis represents the layer number in the model, and the y-axis represents the average τ value (a measure of distance from the mean activations of safe versus unsafe samples). The results indicate that stronger safety fine-tuning methods lead to better separation between clusters of safe and unsafe samples’ activations.
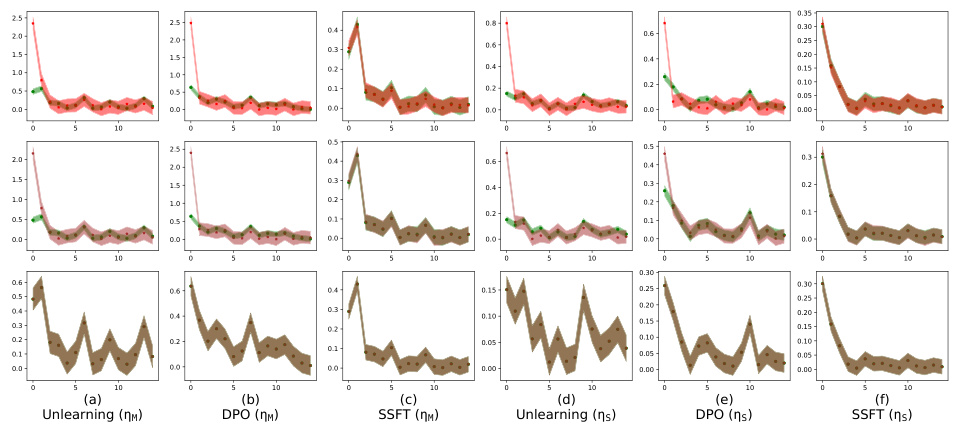
This figure visualizes how safety fine-tuning methods affect the clustering of safe and unsafe samples in the activation space of a language model. The x-axis represents the layer number within the model, and the y-axis shows the average τ value (a measure of the distance between a sample’s activation and the mean activations of safe and unsafe samples). The top section displays results using synthetic data, and the bottom section uses real-world data from Llama models. The results show that safety fine-tuning tends to separate safe and unsafe samples into distinct clusters, with the degree of separation increasing as the strength of the safety fine-tuning method increases.

This figure visualizes how safety fine-tuning methods affect the clustering of activations from safe and unsafe samples in the model’s feature space. The x-axis represents the layer number in the model, and the y-axis represents the average value of τ (a measure of the distance to safe versus unsafe cluster means). The top part of the figure shows results from the synthetic dataset, while the bottom part shows results from real-world Llama models. The results demonstrate that stronger safety fine-tuning methods (DPO and Unlearning) lead to a clearer separation between safe and unsafe sample activations.
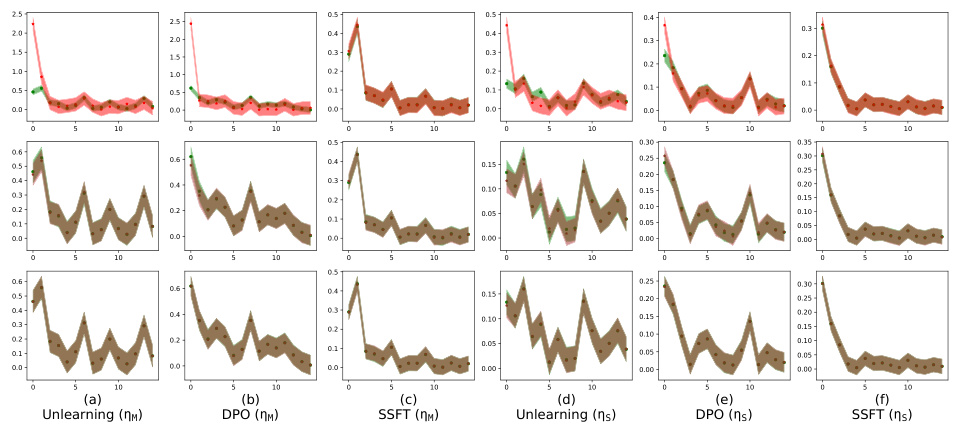
This figure shows how safety fine-tuning methods affect the clustering of safe versus unsafe samples in the activation space. The top row shows results from a synthetic dataset, while the bottom row presents results from real-world LLMs (Llama-2 and Llama-3). The x-axis represents the layer number, and the y-axis represents the average τ, a metric measuring the distance between a sample’s activations and the mean activations of safe versus unsafe samples. The figure shows that safety fine-tuning leads to better separation between clusters of safe and unsafe samples, and the degree of separation increases with the strength of the safety fine-tuning method.

This figure shows how safety fine-tuning methods affect the clustering of safe and unsafe samples in the activation space of the model. The x-axis represents the layer number, and the y-axis represents the average τ, a metric that measures the Euclidean distance of a sample’s activations from the mean unsafe versus safe activation. The top part shows results using the synthetic data, while the bottom part uses real-world Llama models. The results show that safety fine-tuning encourages separate cluster formations for safe and unsafe samples, with stronger safety fine-tuning methods leading to better separation of the clusters.

This figure shows the results of clustering analysis for safe and unsafe samples using different safety fine-tuning methods. The x-axis represents the layer number of a transformer block in the model, and the y-axis shows the average value of τ (tau), a measure that quantifies the Euclidean distance of a sample’s activations from the mean activation for unsafe versus safe samples. Positive values of τ indicate safe samples and negative values unsafe. The top part of the figure shows results using a synthetic dataset, while the bottom shows results obtained using the Llama language models. The results show a clear separation between safe and unsafe sample activations, particularly in deeper layers, which increases with the strength of the safety fine-tuning method.
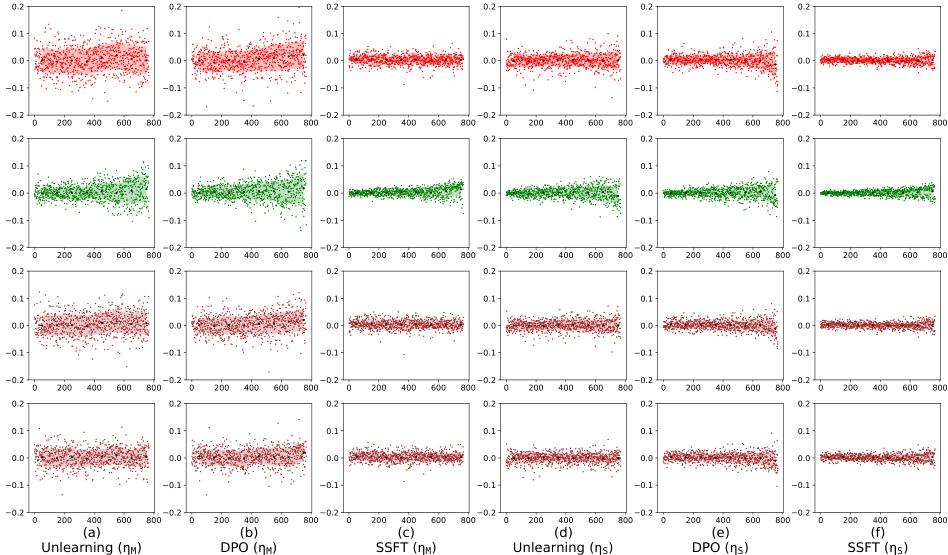
This figure visualizes how safety fine-tuning methods affect the activation space of a language model. By calculating the average activation for safe and unsafe inputs at each layer, it shows that safety fine-tuning leads to the formation of distinct clusters for safe and unsafe samples. The separation between these clusters increases with the effectiveness of the safety fine-tuning method used. The top half of the figure shows results from a synthetic dataset, and the bottom half shows results from the Llama language model, demonstrating the generalizability of the findings.
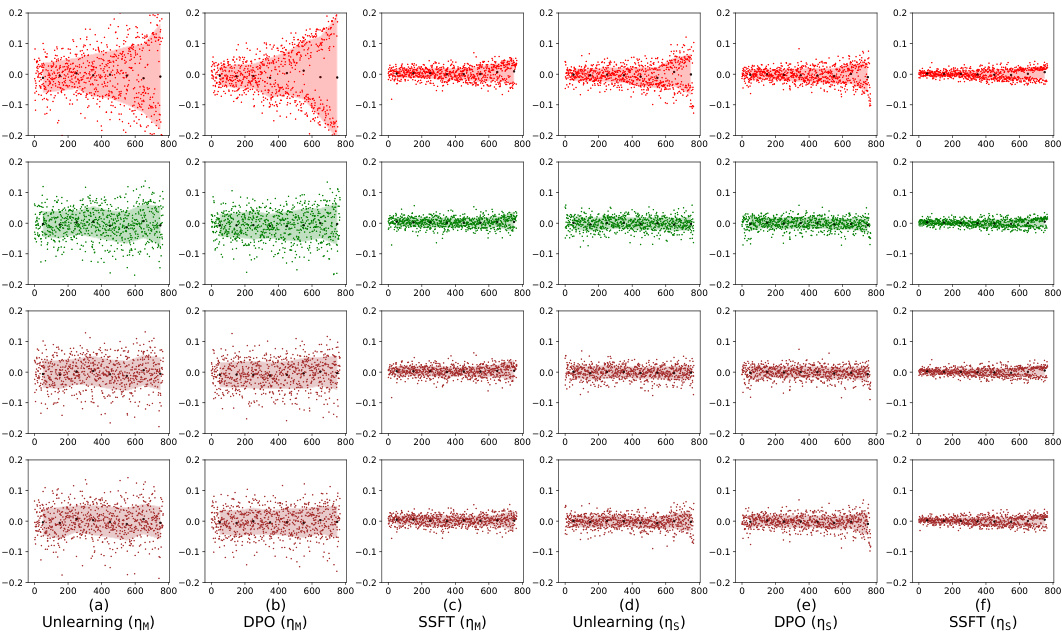
This figure shows how safety fine-tuning affects the clustering of safe and unsafe samples in the activation space. The x-axis represents the layer number, and the y-axis represents the average τ, a measure of the Euclidean distance between a sample’s activations and the mean activations of safe and unsafe samples. The top part of the figure shows results from a synthetic dataset, while the bottom part shows results from Llama models. The results show that safety fine-tuning leads to the formation of distinct clusters for safe and unsafe samples, with the separation between clusters increasing as stronger safety fine-tuning methods are used. This demonstrates that safety fine-tuning learns to differentiate between safe and unsafe inputs by transforming the activation space.

This figure shows that safety fine-tuning leads to the formation of distinct clusters in the activation space for safe and unsafe samples. The top row displays results from a synthetic dataset, while the bottom shows results from Llama models (Llama-2 7B and Llama-3 8B, and their respective chat versions). The x-axis represents the layer number, and the y-axis represents the average τ value (a measure of distance to safe vs. unsafe sample means). The greater the separation between the clusters, the more effective the safety fine-tuning. Stronger safety fine-tuning methods (like DPO and Unlearning) show greater cluster separation.
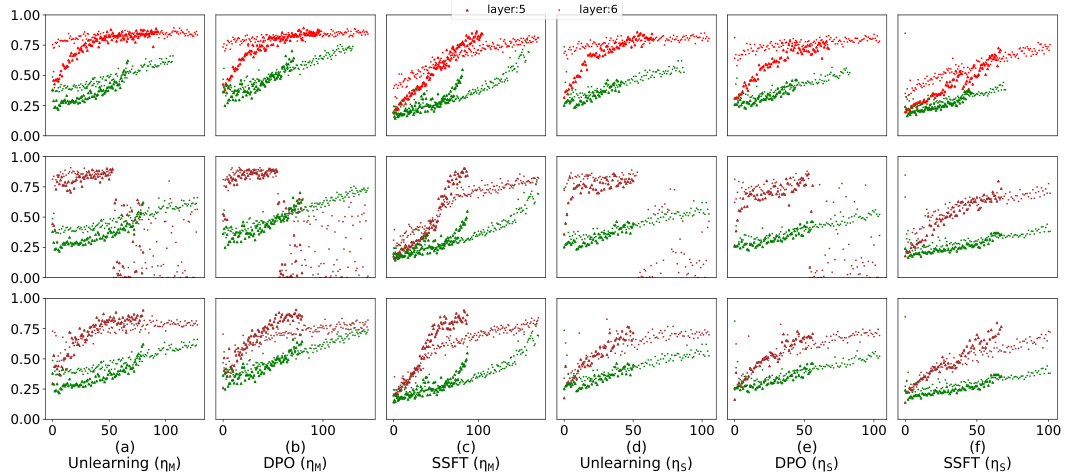
This figure visualizes how safety fine-tuning methods impact the activation space of a language model. By calculating the average distance (τ) of each sample’s activations from the mean activations of safe and unsafe samples at each layer, it shows that safety fine-tuning leads to the formation of distinct clusters for safe and unsafe inputs. The separation between these clusters increases with the effectiveness of the safety fine-tuning method. Both synthetic data and real-world Llama model results are presented.

This figure visualizes how safety fine-tuning methods affect the clustering of safe and unsafe samples in the activation space. The x-axis represents the layer number in the model’s architecture, while the y-axis displays the average τ value (a measure of the Euclidean distance of a sample’s activations from the mean unsafe versus safe activation). The top section shows results from a synthetic data generation framework, and the bottom section illustrates results using actual Llama language models. Clear separation between safe and unsafe sample clusters indicates successful safety fine-tuning, with stronger separation observed using more effective safety fine-tuning methods.
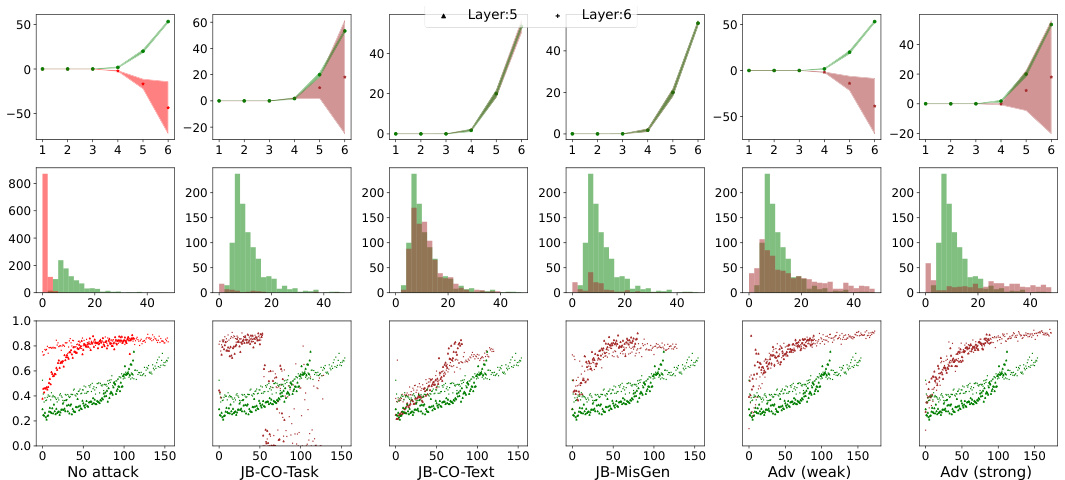
This figure visualizes how safety fine-tuning methods (SSFT, DPO, Unlearning) affect the clustering of safe and unsafe samples’ activations in the feature space of a language model. The x-axis represents the layer number in the model, and the y-axis represents the average τ value, which measures the difference in Euclidean distance between a sample’s activations and the mean activations of safe versus unsafe samples. The top panels show results from a synthetic data generation process, and the bottom panels show results from Llama 2 and 3 models. The results show a clear separation between safe and unsafe samples’ activations after safety fine-tuning, and this separation is more pronounced with stronger safety fine-tuning methods and deeper layers of the model.

This figure shows how safety fine-tuning affects the clustering of safe and unsafe samples in the activation space. The top part shows results from the synthetic data, and the bottom shows results from the Llama models. The x-axis represents the layer number, and the y-axis represents the average τ, a measure of the distance between the activation of a sample and the average activation of safe and unsafe samples. A larger separation between clusters indicates better safety performance. The figure demonstrates that stronger safety fine-tuning protocols and deeper layers lead to better cluster separation.
This figure visualizes how safety fine-tuning methods affect the clustering of safe and unsafe input samples in the activation space of a language model. The top section shows results from a synthetic dataset, while the bottom section uses real-world data from Llama models. Each subplot shows the average distance (τ) of sample activations from the mean activations of safe and unsafe samples across different layers of the model. The x-axis represents the layer number, and the y-axis represents the average τ value. The results indicate that safety fine-tuning leads to a clearer separation between safe and unsafe sample activations, with stronger methods (DPO, Unlearning) producing a more pronounced separation.
This figure shows the results of clustering analysis for safe and unsafe samples using different safety fine-tuning methods. The top part shows the results from a synthetic dataset, while the bottom part shows the results from the Llama models. The x-axis represents the layer number, and the y-axis represents the average distance between the sample activations and the mean activation for safe and unsafe samples. The results show that safety fine-tuning leads to the formation of separate clusters for safe and unsafe samples, and that the separation between the clusters increases with the strength of the safety fine-tuning method.

This figure shows how safety fine-tuning affects the activation space of LLMs. The top part uses a synthetic dataset to show the effect on cluster formations of safe vs unsafe samples, and the bottom part shows results obtained using Llama models (Llama-2 7B and Llama-3 8B). The x-axis represents the layer number in the model, and the y-axis represents the average τ value, calculated using equation 2 in the paper, which measures the Euclidean distance of a sample’s activations from the mean unsafe versus safe activation. The results demonstrate that safety fine-tuning encourages separate cluster formations for safe and unsafe samples, with clearer separation for stronger safety fine-tuning methods.
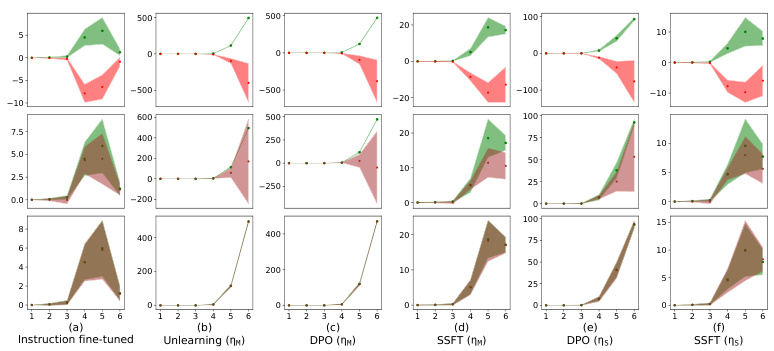
This figure visualizes how safety fine-tuning methods affect the clustering of activations for safe versus unsafe inputs in a language model. The top row shows results from a synthetic dataset, while the bottom row presents results from real-world Llama language models. The x-axis represents the layer number in the model, and the y-axis represents the average value of τ, a measure of the Euclidean distance between a sample’s activations and the mean activations of safe versus unsafe samples. A larger absolute value of τ indicates clearer separation between safe and unsafe clusters, suggesting improved safety performance. The results demonstrate that safety fine-tuning encourages the formation of distinct clusters for safe and unsafe inputs.

This figure shows how safety fine-tuning affects the clustering of safe and unsafe samples in the activation space of the model. The top row shows the results using a synthetic dataset generated using a probabilistic context-free grammar, while the bottom row presents the results on the Llama language model. The x-axis shows the layer number, and the y-axis shows the average τ value, which is a measure of the distance of a sample’s activations from the mean activations of safe and unsafe samples. The results demonstrate that safety fine-tuning encourages the formation of separate clusters for safe and unsafe samples, with the separation between clusters increasing as better safety fine-tuning methods are used. The results also show that the same phenomenon is observed on the Llama language model.

This figure visualizes how safety fine-tuning methods impact the formation of clusters in the activation space of a language model. The x-axis represents the layer number in the model’s transformer block, while the y-axis shows the average τ value, which measures the difference in distance between a sample’s activation and the mean activations of safe and unsafe samples. A positive τ indicates a safe sample, and a negative τ indicates an unsafe sample. The top part of the figure presents results using synthetic data, while the bottom part uses real-world Llama models. It shows that safety fine-tuning leads to more distinct clusters for safe and unsafe samples, with stronger methods (like DPO and Unlearning) exhibiting greater separation.

This figure shows how safety fine-tuning methods affect the clustering of safe and unsafe samples in the activation space of the model. The x-axis represents the layer number, and the y-axis shows the average τ, a measure of the Euclidean distance of a sample’s activations from the mean unsafe versus safe activation. The top part of the figure displays results obtained from a synthetic dataset, while the bottom shows results for Llama models, highlighting the effect of safety fine-tuning on real-world LLMs.
This figure shows how safety fine-tuning affects the clustering of safe and unsafe samples in the activation space. The top row presents results from the synthetic data setup, demonstrating how the separation between safe and unsafe sample clusters increases with the strength of the safety fine-tuning method (SSFT, DPO, Unlearning). The bottom row shows similar results obtained using actual Llama language models, confirming that the findings generalize to real-world scenarios.
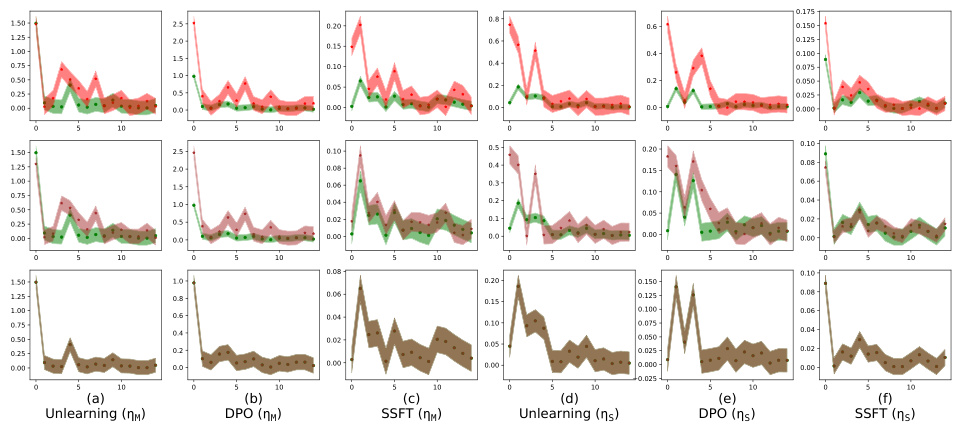
This figure shows how safety fine-tuning affects the clustering of safe and unsafe samples in the activation space. The top part uses a synthetic dataset, while the bottom uses real-world Llama models. The x-axis represents the layer number, and the y-axis represents the average τ, a measure of the Euclidean distance between a sample’s activations and the mean safe/unsafe activations. The results indicate that safety fine-tuning leads to distinct clusters for safe and unsafe samples, and this separation becomes more pronounced with stronger fine-tuning methods. The bottom part shows that this trend generalizes to real-world LLMs.
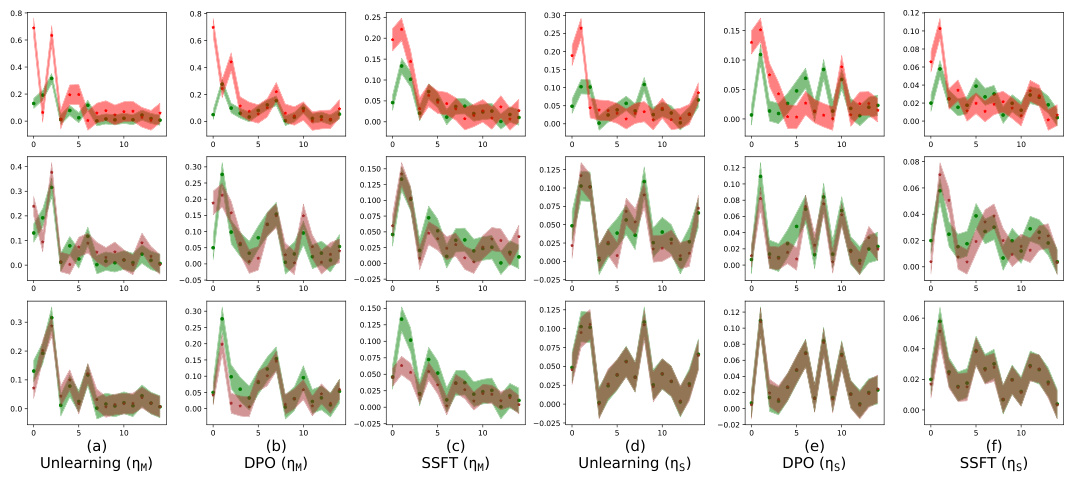
This figure shows how safety fine-tuning affects the clustering of safe and unsafe samples in the activation space. The top part uses a synthetic dataset, while the bottom part uses real-world Llama models. The x-axis represents the layer number in the model, and the y-axis shows the average τ, a measure of the Euclidean distance of a sample’s activations from the mean unsafe versus safe activation. A positive τ value indicates a safe input and a negative value indicates an unsafe input. The results show that safety fine-tuning leads to the formation of distinct clusters for safe and unsafe samples, and the separation between clusters increases with stronger safety fine-tuning methods.
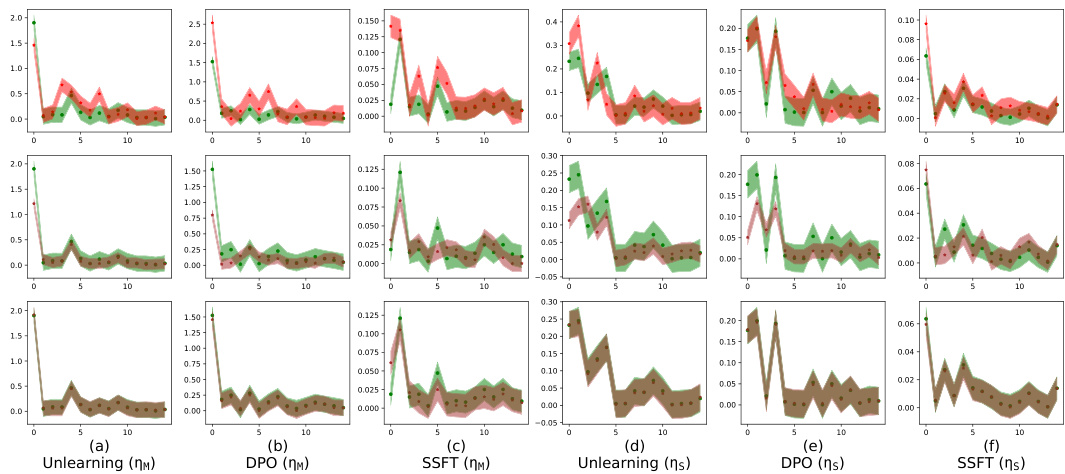
This figure shows how safety fine-tuning methods encourage the formation of separate clusters in the activation space for safe and unsafe inputs. The top section displays results from a synthetic data generation process while the bottom shows analogous results from Llama language models (Llama-2 7B and Llama-3 8B). The x-axis represents the layer number in the model, and the y-axis represents the average τ value (a measure of distance to safe vs. unsafe activation means). The greater the separation between the green (safe) and red (unsafe) lines, the better the safety fine-tuning method is performing at clustering samples into safe and unsafe categories. Stronger safety fine-tuning methods (as measured by learning rate and technique) generally exhibit greater separation.
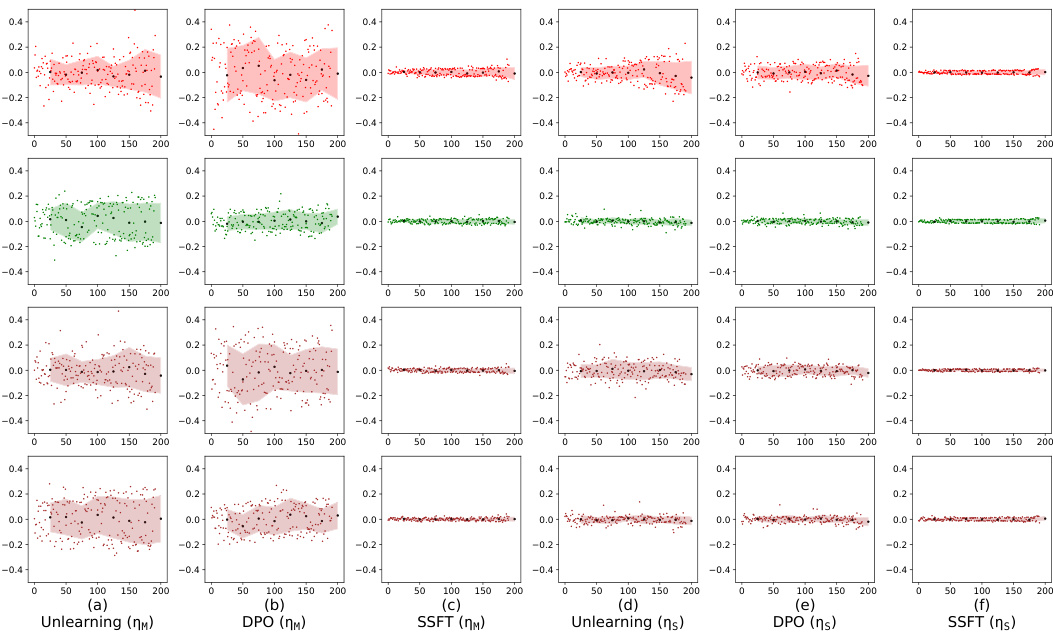
This figure shows that safety fine-tuning leads to the formation of distinct clusters in the activation space for safe and unsafe inputs. The top row displays results from a synthetic dataset, while the bottom row shows results from the Llama language models. The x-axis represents the layer number within the model’s architecture, and the y-axis represents the average distance of a sample’s activation from the mean activation of safe versus unsafe samples. A larger separation between clusters indicates a more effective safety fine-tuning process. The results show that stronger safety fine-tuning methods (DPO, Unlearning) produce greater cluster separation than weaker methods (SSFT).
This figure shows how safety fine-tuning methods affect the clustering of safe and unsafe samples in the activation space of the model. The top part of the figure uses data from a synthetic dataset, while the bottom uses data from the Llama language model. The x-axis represents the layer number in the model, and the y-axis shows the average τ value, which measures the distance of a sample’s activation from the mean activation of safe versus unsafe samples. A larger separation between the clusters indicates a clearer distinction between safe and unsafe samples in the model’s activation space. The results show that safety fine-tuning encourages the formation of separate clusters for safe and unsafe samples, and that this separation increases with stronger safety fine-tuning methods.
This figure visualizes how safety fine-tuning leads to the formation of distinct clusters in the activation space for safe and unsafe inputs. The x-axis represents the layer number in the model, while the y-axis shows the average value of τ, a metric measuring the difference in the Euclidean distance between a sample’s activations and the mean activations of safe versus unsafe samples. The top row displays results using a synthetic dataset, while the bottom row uses real-world data from Llama language models. The figure shows that the cluster separation increases with the strength of the safety fine-tuning method, demonstrating that stronger methods lead to better separation of safe and unsafe samples in the activation space.

This figure shows that safety fine-tuning leads to the formation of distinct clusters in the activation space for safe and unsafe samples. The x-axis represents the layer number in the transformer model, and the y-axis represents the average value of τ, which measures the Euclidean distance between a sample’s activations and the mean activations of safe and unsafe samples. The top part of the figure shows results from a synthetic dataset, while the bottom part shows results from Llama models, with Llama-2 chat 7B and Llama-3 chat 8B representing safety fine-tuned models. The degree of cluster separation increases with the effectiveness of the safety fine-tuning method.

This figure shows how safety fine-tuning affects the clustering of safe and unsafe samples in the activation space of the model. The top row shows results from a synthetic dataset, while the bottom row shows results from actual Llama models. The x-axis represents the layer number, and the y-axis represents the average of a measure (τ) that quantifies the distance of a sample’s activations from the mean of safe versus unsafe activations. A larger positive value indicates a safe sample, while a larger negative value indicates an unsafe sample. The results show that safety fine-tuning leads to a clear separation between clusters of activations for safe and unsafe samples, with the separation increasing as stronger safety fine-tuning methods are used.

This figure visualizes how safety fine-tuning methods affect the activation patterns of safe versus unsafe samples in a language model. The x-axis represents the layer number in the model’s architecture, and the y-axis shows the average distance (τ) of a sample’s activations from the mean activations of safe and unsafe samples. Positive τ values indicate safe samples, negative values unsafe. The top part shows results from a synthetic dataset, while the bottom illustrates findings on the Llama language model (both a standard version and a chat version that has been fine-tuned). Stronger safety fine-tuning methods generally result in a clearer separation between safe and unsafe samples.
This figure shows how safety fine-tuning methods affect the clustering of safe and unsafe samples in the activation space of the model. The x-axis represents the layer number in the model, and the y-axis shows the average value of τ, a metric that measures the distance of a sample’s activations from the mean activations of safe and unsafe samples. A positive τ value indicates a safe sample, while a negative value indicates an unsafe sample. The top part of the figure displays the results from a synthetic data setup, demonstrating how different safety fine-tuning methods (SSFT, DPO, and Unlearning) impact the clustering. The bottom part shows results from real Llama models. The plot shows that the separation between safe and unsafe clusters increases as the strength of the safety fine-tuning method increases, indicating better safety performance.

This figure visualizes how safety fine-tuning methods (Unlearning, DPO, SSFT) impact the formation of clusters in the activation space of a language model. The x-axis represents the layer number within the model’s architecture. The y-axis shows the average τ value (a measure of the Euclidean distance between a sample’s activations and the mean activations of safe versus unsafe samples). Positive values indicate safe inputs, negative unsafe. The top part of the figure shows results from the synthetic data generation process, while the bottom uses real-world Llama models (Llama-2 7B, Llama-2 chat 7B, Llama-3 8B, Llama-3 chat 8B). The results demonstrate that stronger safety fine-tuning methods lead to a clearer separation between safe and unsafe sample clusters.
This figure shows how safety fine-tuning affects the distribution of activations for safe and unsafe inputs. The top row shows results from the synthetic data experiments. The bottom row shows the results from real-world Llama model experiments. The x-axis represents the layer number in the model, and the y-axis represents the average of the calculated distance metric τ (tau), which measures the difference in Euclidean distance between the sample’s activations and the average activations for both safe and unsafe samples. Safety fine-tuning increases the separation between the activations for safe and unsafe samples, which results in the formation of distinct clusters, indicating that the model learns to differentiate safe and unsafe input types.

This figure visualizes how safety fine-tuning methods lead to the formation of distinct clusters in the activation space for safe and unsafe inputs. The x-axis represents the layer number in the model, and the y-axis shows the average of a metric (τ) that quantifies the distance of a sample’s activations from the mean activations of safe versus unsafe samples. Higher values of τ indicate better separation between safe and unsafe clusters. The top part of the figure demonstrates the results using a synthetic dataset, while the bottom part shows the results obtained using the Llama language model. The results from Llama confirm that the findings from the synthetic data generalize to real-world language models.
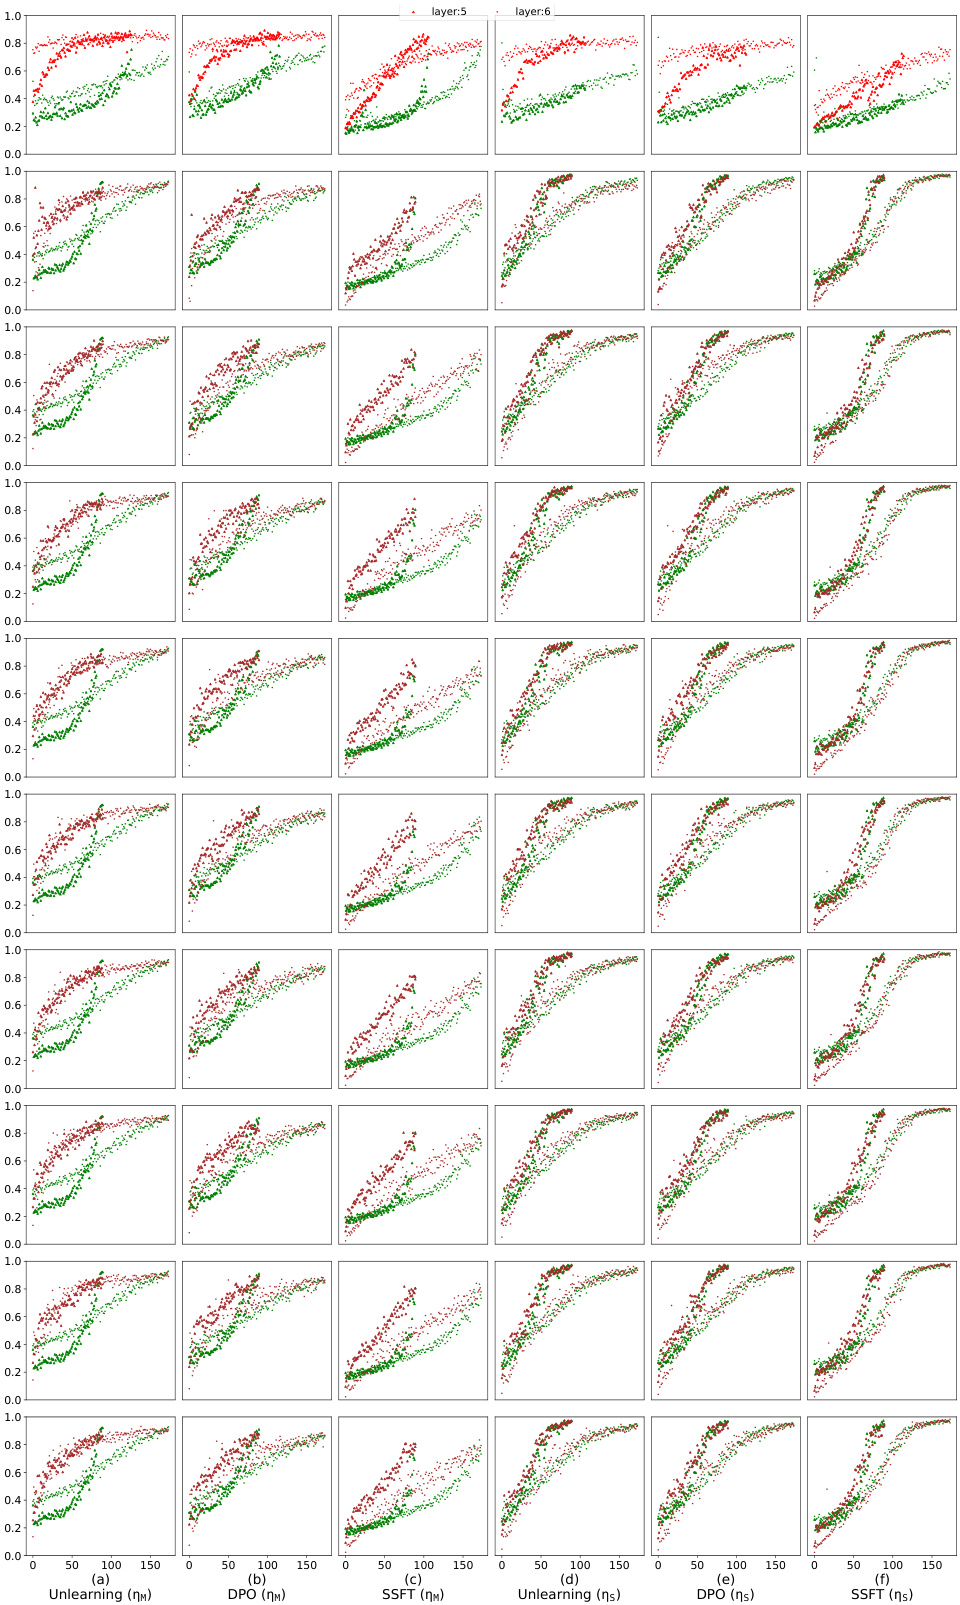
This figure visualizes how safety fine-tuning methods affect the clustering of safe and unsafe input activations. The x-axis represents the layer number in the model’s architecture, and the y-axis shows the average τ, which measures the difference in Euclidean distance between a sample’s activation and the mean activation of safe versus unsafe samples. The top section presents results from a synthetic data generation process, while the bottom section shows similar analysis performed on Llama language models. The results indicate that stronger safety fine-tuning methods result in more distinct clustering of safe and unsafe samples, as measured by the separation of the activations.
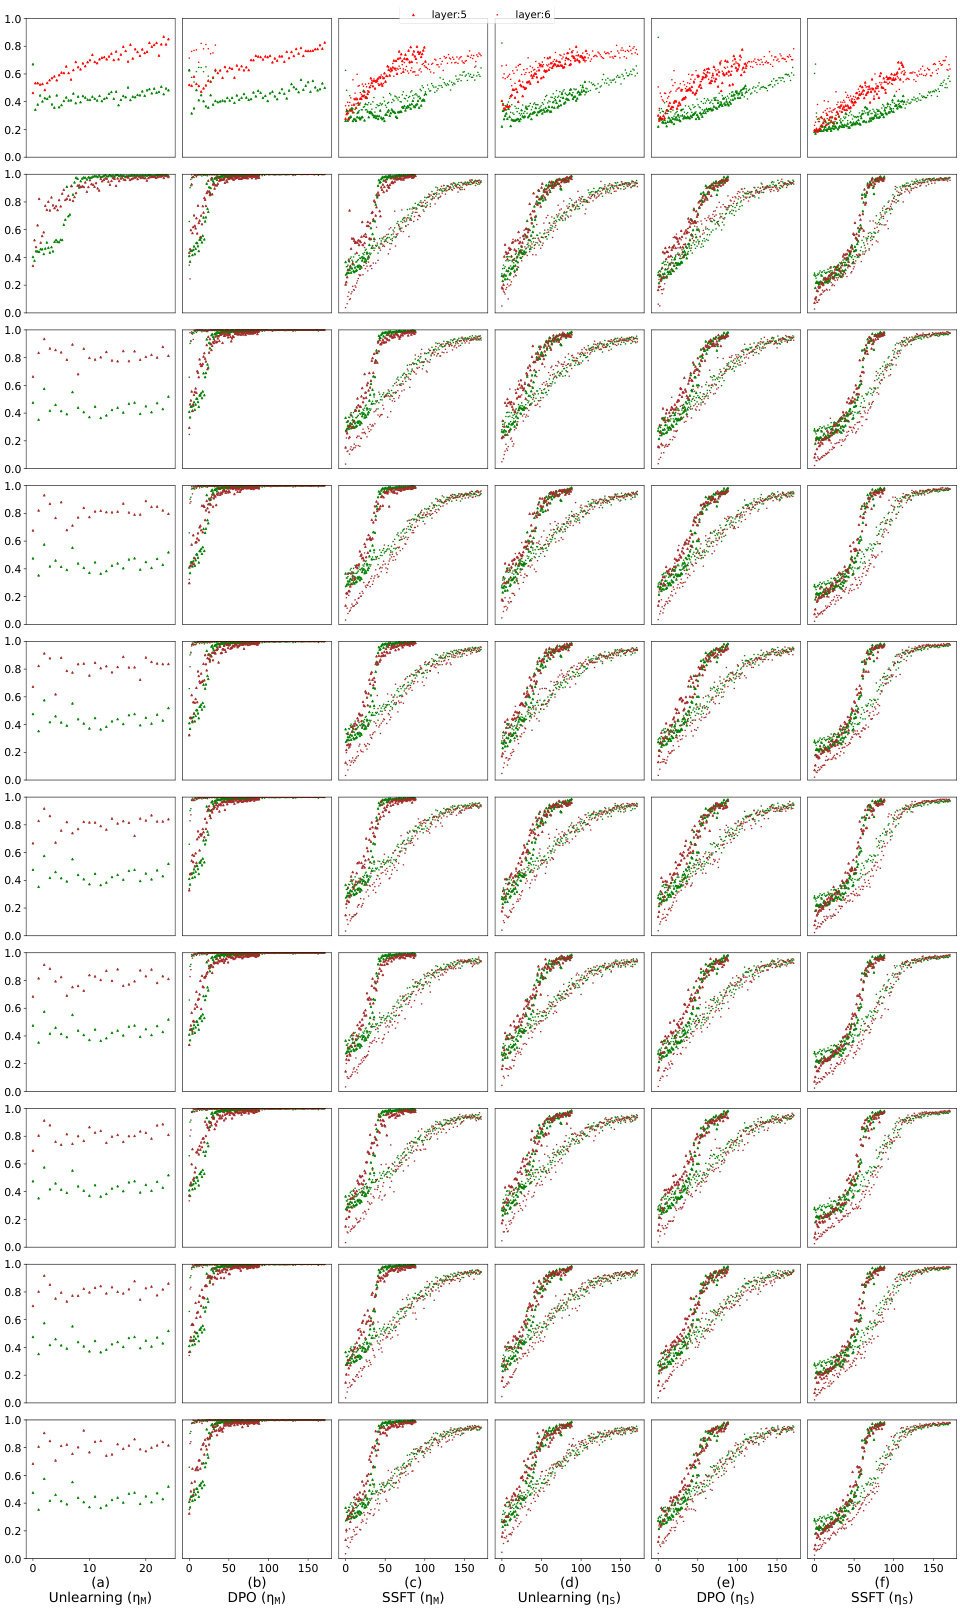
This figure visualizes how safety fine-tuning methods affect the activation space of a language model. It shows the average Euclidean distance (τ) between a sample’s activations and the mean activations of safe versus unsafe samples, plotted against layer number. The top row presents results from a synthetic dataset, while the bottom row shows results from real-world Llama models. The plot demonstrates that safety fine-tuning creates distinct clusters for safe and unsafe samples, with stronger separation achieved by more effective safety fine-tuning methods. Llama-2 chat 7B and Llama-3 chat 8B represent safety fine-tuned versions of the respective base models.

This figure shows the results of clustering analysis of safe and unsafe samples’ activations in different layers of the model. The top part shows the results using the synthetic dataset, while the bottom part shows the results on Llama models. The x-axis represents the layer number, and the y-axis represents the average τ, which is a measure of the Euclidean distance between a sample’s activations and the mean activations of safe and unsafe samples. Safety fine-tuning encourages separate cluster formations for safe and unsafe samples, and the separation increases as better methods are used. Llama-2 chat 7B and Llama-3 chat 8B correspond to safety fine-tuned models.
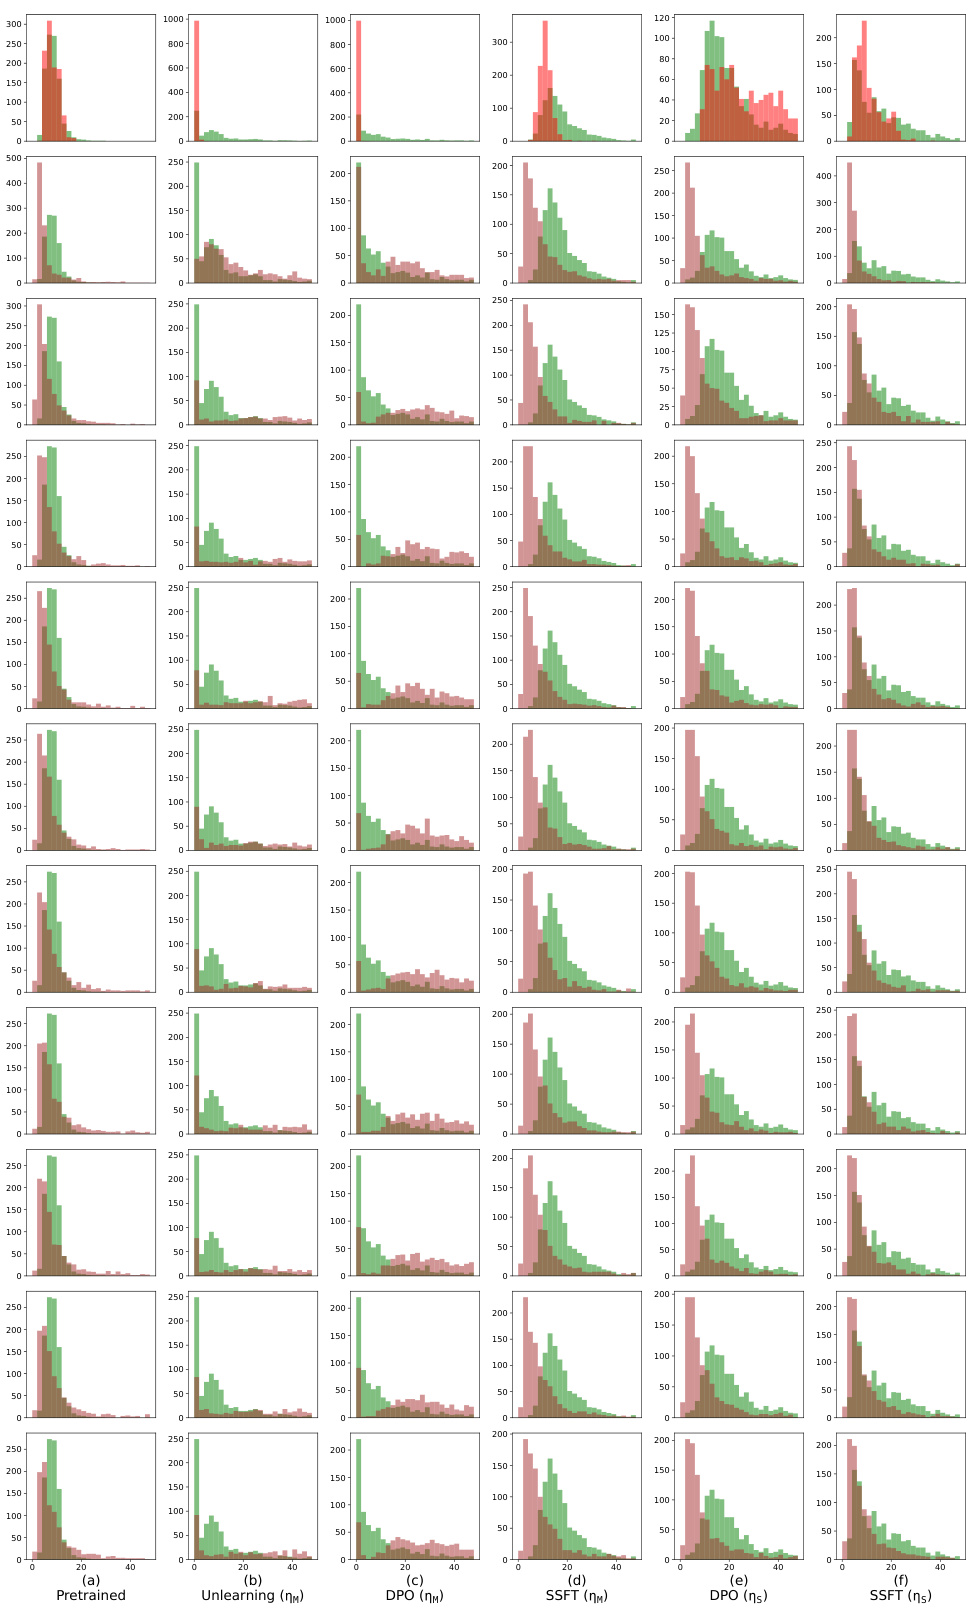
This figure visualizes how safety fine-tuning methods (Unlearning, DPO, SSFT) affect the clustering of safe and unsafe samples in the activation space of a language model. The top row shows results from a synthetic dataset, while the bottom row shows results from real-world Llama models (Llama-2 7B, Llama-2 chat 7B, Llama-3 8B, Llama-3 chat 8B). The x-axis represents the layer number, and the y-axis represents the average distance (τ) of a sample’s activations from the mean activations of safe and unsafe samples. Clearer separation between safe and unsafe clusters indicates more effective safety fine-tuning.

This figure visualizes how safety fine-tuning methods (Unlearning, DPO, SSFT) affect the clustering of safe and unsafe input activations in different layers of a Transformer model. The top row shows results using synthetic data, while the bottom row presents results using Llama models (Llama-2 7B, Llama-2 chat 7B, Llama-3 8B, Llama-3 chat 8B). The y-axis (average τ) represents a measure of the Euclidean distance between a sample’s activations and the mean activations of safe and unsafe samples. A clear separation between safe and unsafe samples indicates successful clustering. Stronger safety fine-tuning methods generally show better cluster separation.

This figure shows how safety fine-tuning affects the clustering of safe and unsafe samples in the activation space. The top part of the figure displays results from a synthetic data setup, while the bottom shows results obtained using Llama language models. The x-axis represents the layer number in the model, and the y-axis represents the average τ value (a measure of the distance of a sample’s activations from the mean safe vs. unsafe activation). Clearer separation between safe and unsafe sample clusters indicates stronger safety fine-tuning effects. The figure demonstrates that safety fine-tuning leads to the formation of distinct clusters for safe and unsafe samples, with better separation for stronger safety fine-tuning methods. The bottom part shows results obtained from actual Llama models (Llama-2 chat 7B and Llama-3 chat 8B) confirming the results of the synthetic setup.
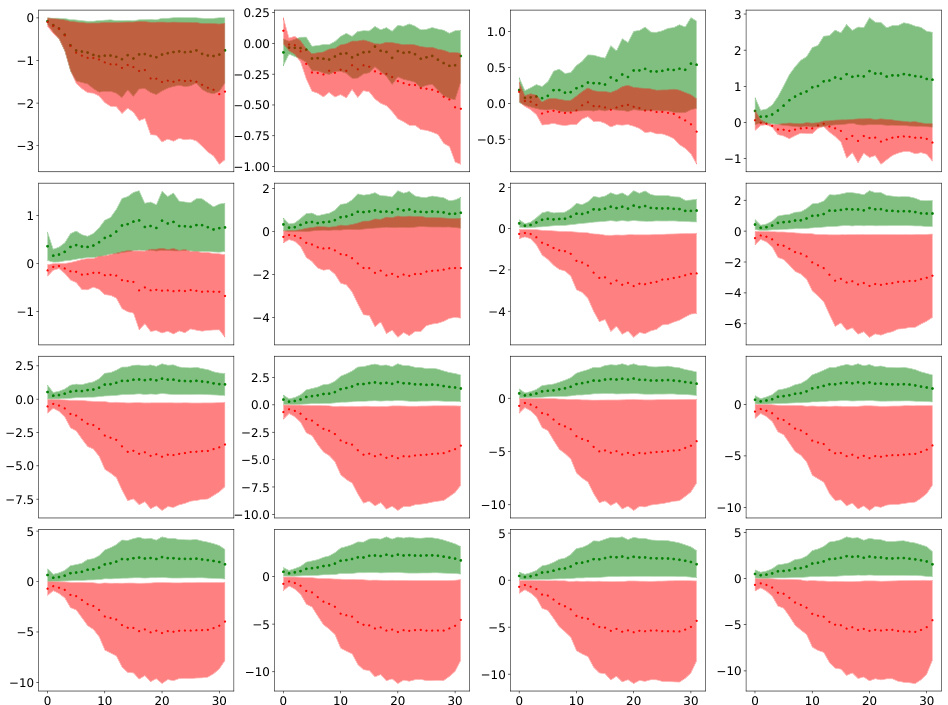
This figure shows how safety fine-tuning affects the clustering of safe and unsafe samples in the activation space of the model. The x-axis represents the layer number, and the y-axis represents the average τ, a measure of the Euclidean distance between a sample’s activations and the mean activations of safe and unsafe samples. The top part of the figure shows the results from a synthetic dataset, while the bottom part shows the results from Llama models. The results indicate that safety fine-tuning leads to the formation of distinct clusters for safe and unsafe samples, and the separation between these clusters increases as stronger safety fine-tuning methods are used. Llama-2 chat 7B and Llama-3 chat 8B represent safety fine-tuned models.
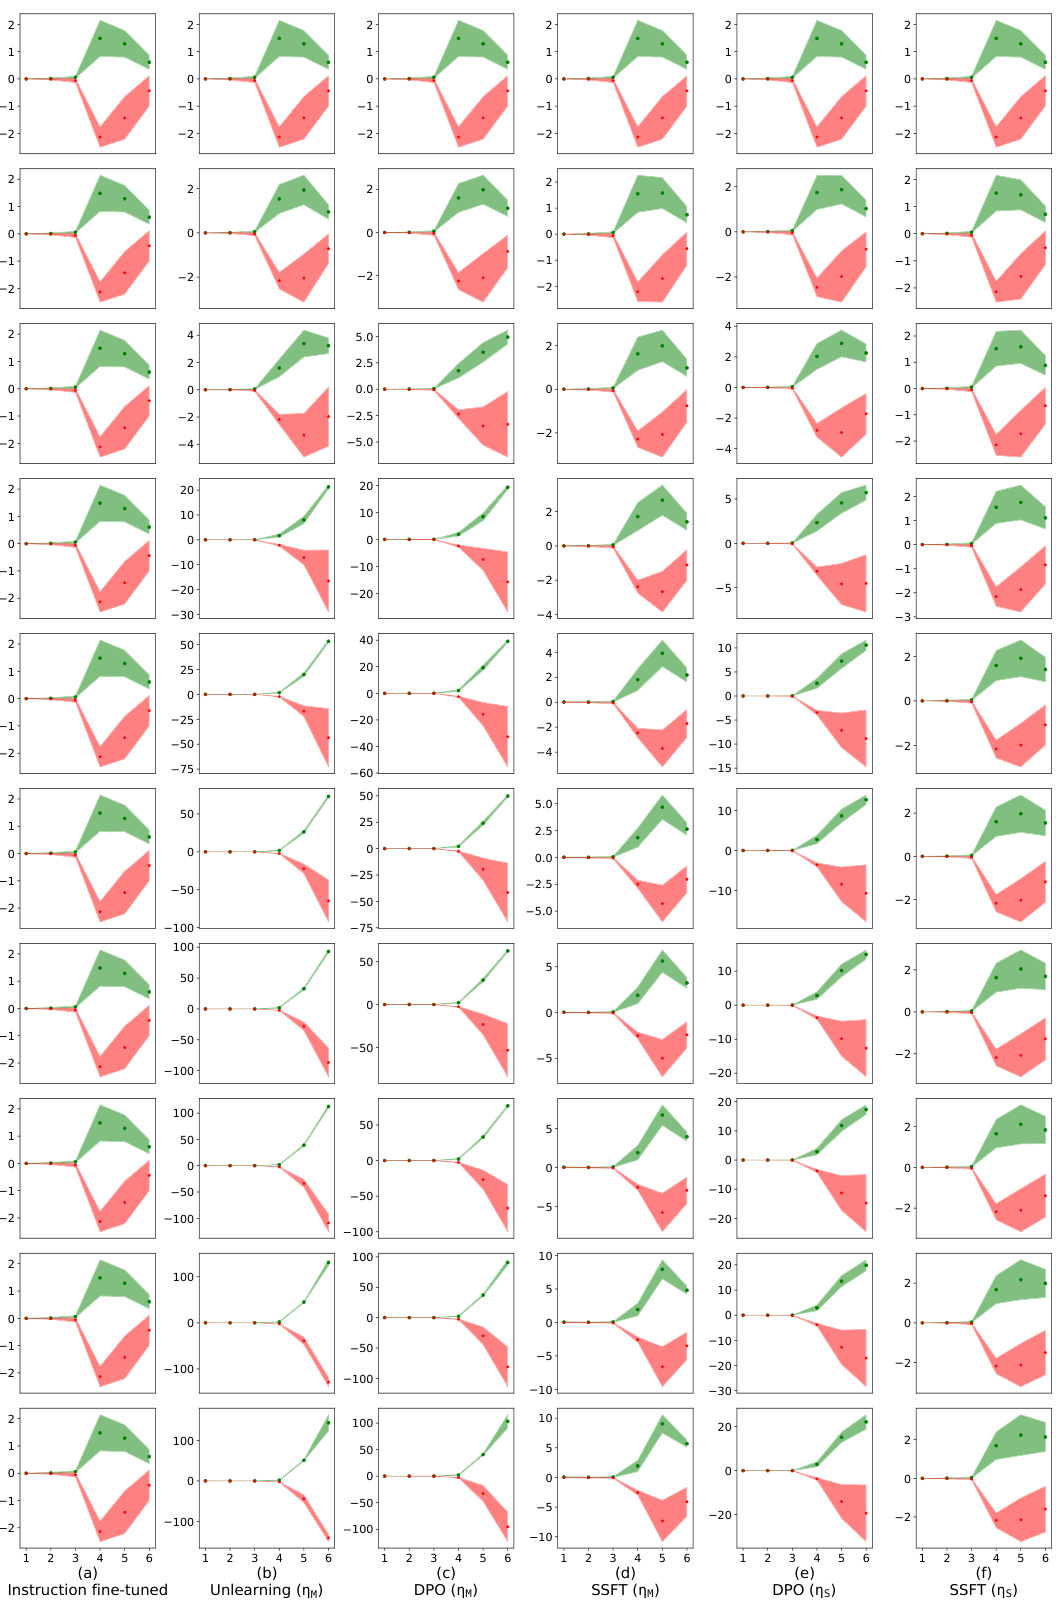
This figure shows the results of clustering analysis for safe and unsafe samples using different safety fine-tuning methods. The x-axis represents the layer number, and the y-axis represents the average τ, which is a measure of the distance between a sample’s activations and the mean activations of safe and unsafe samples. The top part shows results using the synthetic dataset generated based on PCFG, while the bottom part shows results using Llama models (Llama-2 7B and Llama-3 8B). The results demonstrate that safety fine-tuning methods encourage the formation of separate clusters for safe and unsafe samples, and the degree of separation increases with the strength of the safety fine-tuning method.
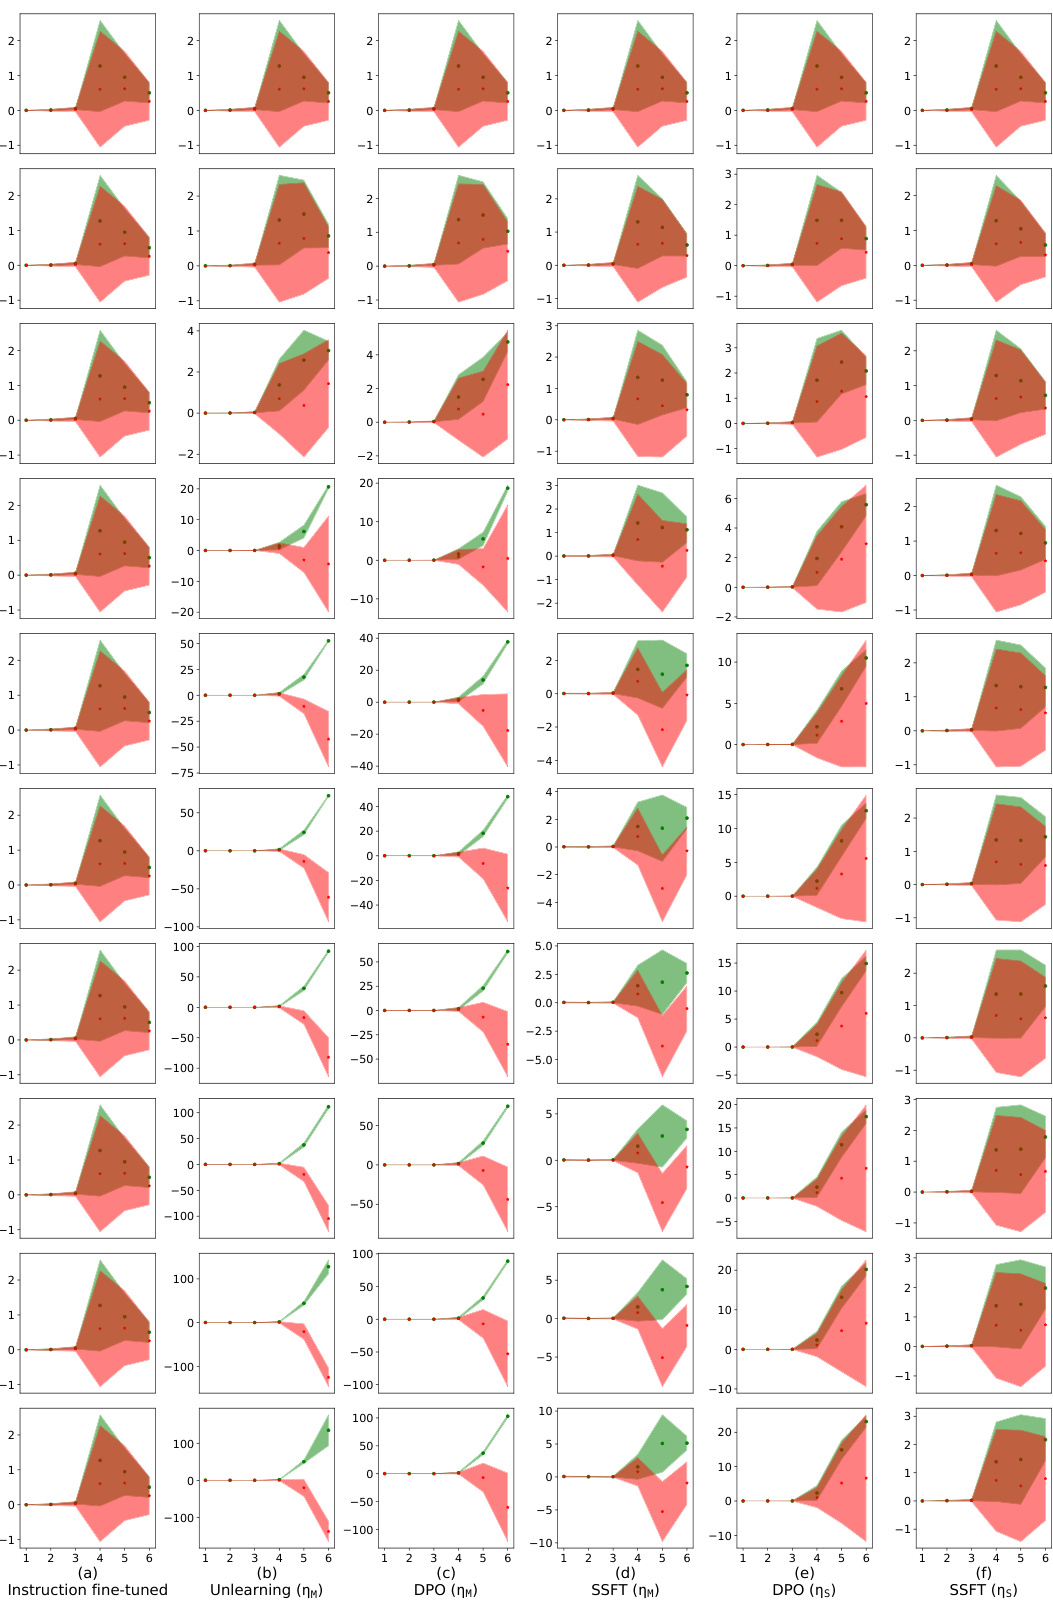
This figure visualizes how safety fine-tuning methods lead to the formation of distinct clusters in the activation space for safe and unsafe inputs. The top row displays the results obtained using the synthetic dataset, and the bottom row presents the results from real-world Llama models. The x-axis represents the layer number, and the y-axis represents the average τ (tau) value, which measures the Euclidean distance between a sample’s activations and the mean activations of safe and unsafe samples. The results indicate that safety fine-tuning methods effectively separate safe and unsafe samples in the feature space, and the degree of separation increases with the effectiveness of the fine-tuning method.

This figure visualizes how safety fine-tuning methods (Unlearning, DPO, SSFT) impact the formation of clusters in the activation space of a language model. The x-axis represents the layer number in the model, and the y-axis shows the average of a metric (τ) that quantifies the distance of a sample’s activations from the mean activations of safe versus unsafe samples. Positive values of τ indicate safe samples, and negative values indicate unsafe samples. The top half of the figure shows results obtained using synthetic data, while the bottom half shows results obtained using real-world Llama language models. The results demonstrate that stronger safety fine-tuning methods lead to a clearer separation between safe and unsafe sample activations.
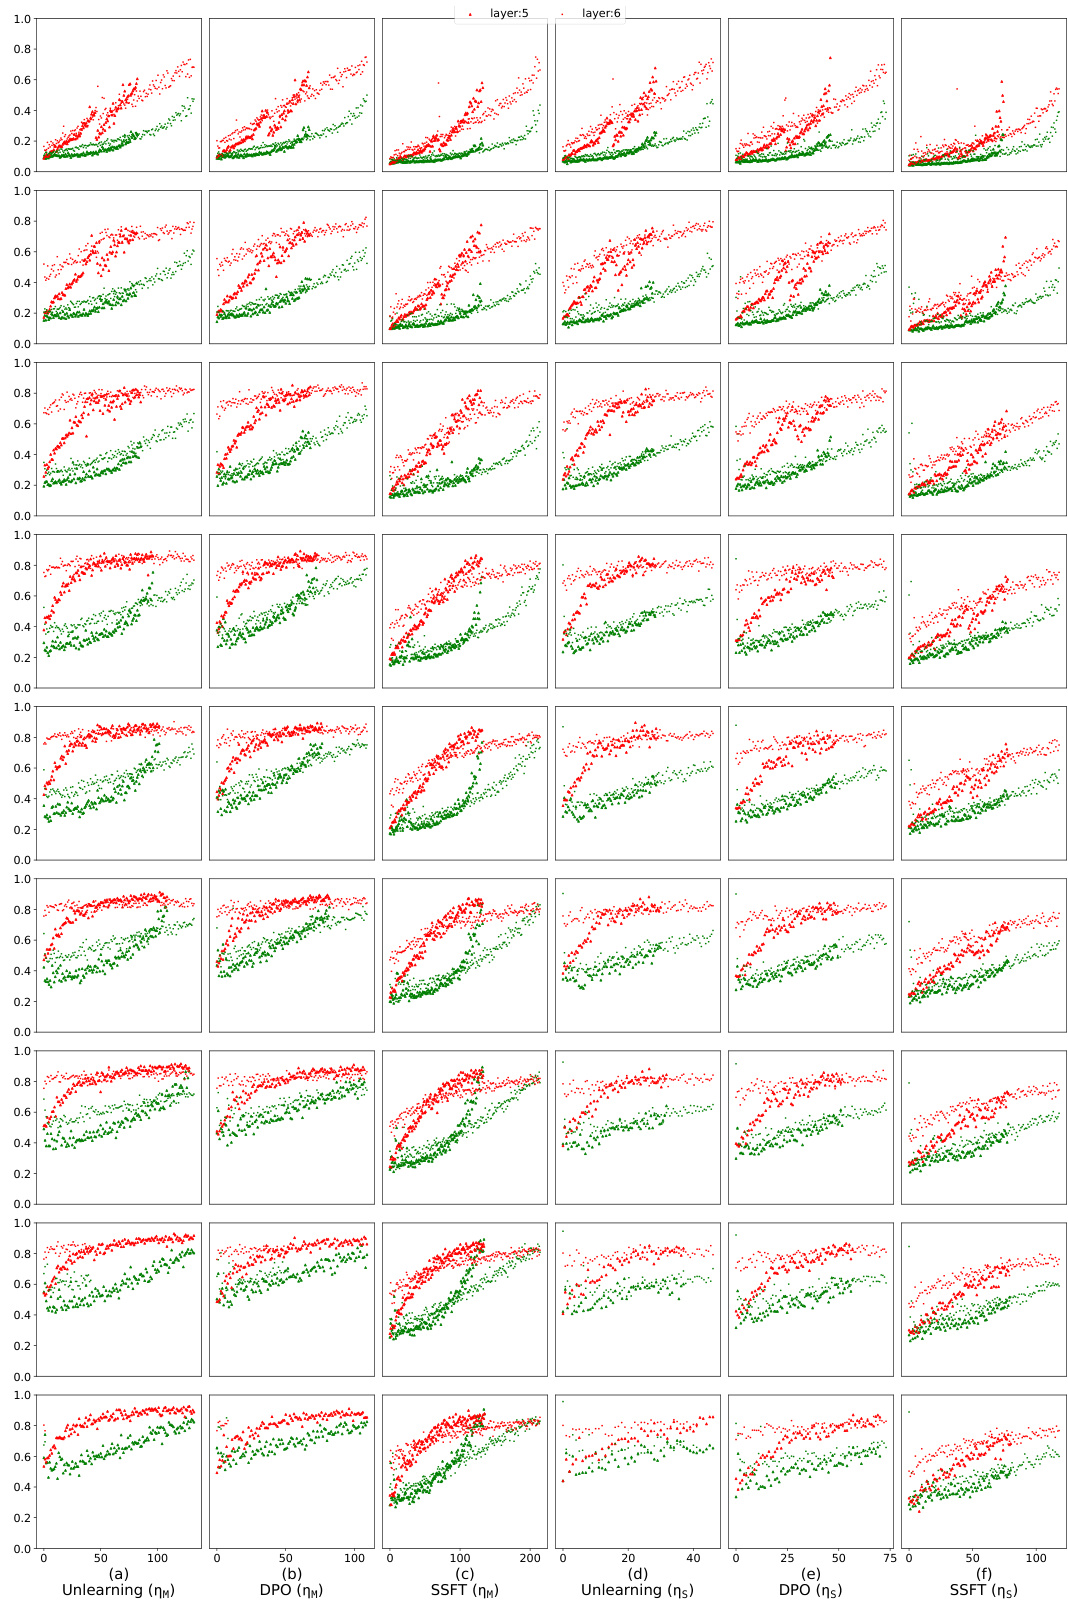
This figure visualizes how safety fine-tuning methods impact the formation of clusters in the activation space of LLMs. The x-axis represents the layer number within the model’s architecture, and the y-axis displays the average τ value (a measure of the Euclidean distance between a sample’s activations and the mean activations of safe versus unsafe samples). The top section shows results from a synthetic dataset, while the bottom section presents findings from real-world Llama language models. The results demonstrate that safety fine-tuning leads to distinct clustering of activations for safe versus unsafe inputs, with the degree of separation increasing as more sophisticated methods are used. Llama-2 chat 7B and Llama-3 chat 8B represent safety fine-tuned model variants.

This figure shows the effect of safety fine-tuning on the clustering of safe and unsafe samples in the activation space of the model. The top part of the figure shows results obtained using a synthetic dataset generated by a probabilistic context-free grammar (PCFG), while the bottom part shows results on actual LLMs (Llama-2 7B and Llama-3 8B). The x-axis represents the layer number in the model, and the y-axis represents the average value of τ, a measure of the Euclidean distance between a sample’s activations and the mean activations of safe and unsafe samples. A positive value of τ indicates that the sample is closer to safe samples and a negative value indicates that it’s closer to unsafe samples. The figure demonstrates that safety fine-tuning leads to the formation of distinct clusters of activations for safe and unsafe samples. Stronger safety fine-tuning methods and deeper layers in the model generally show greater separation between these clusters.

This figure shows how safety fine-tuning leads to the formation of distinct clusters for safe and unsafe inputs in the activation space of the model. The x-axis represents the layer number, and the y-axis represents the average τ, a measure of the Euclidean distance between a sample’s activations and the mean activations of safe and unsafe samples. The top part of the figure shows the results from synthetic data, while the bottom part uses data from Llama models (Llama-2 7B and Llama-3 8B). The results show that stronger safety fine-tuning methods lead to a clearer separation between the safe and unsafe clusters.
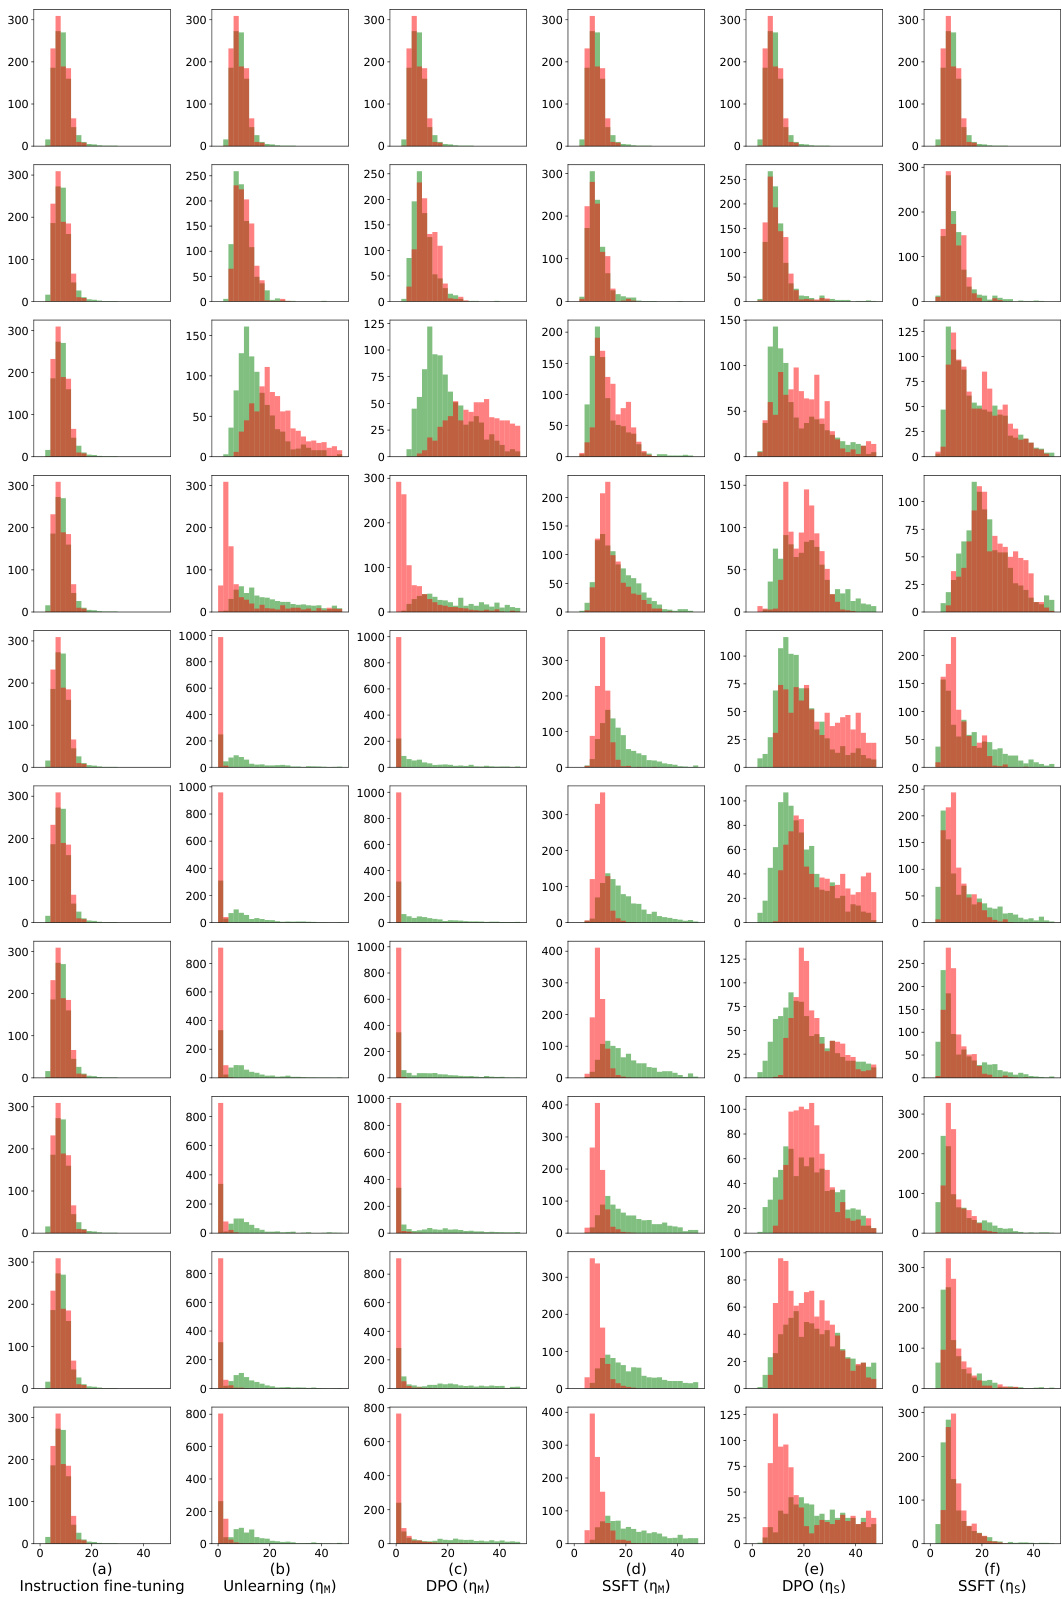
This figure shows that safety fine-tuning leads to the formation of distinct clusters for safe and unsafe samples in the activation space of the model. The separation between the clusters increases with the effectiveness of the safety fine-tuning method. The top row shows results from a synthetic dataset, while the bottom row shows results from Llama models (Llama-2 7B and Llama-3 8B).
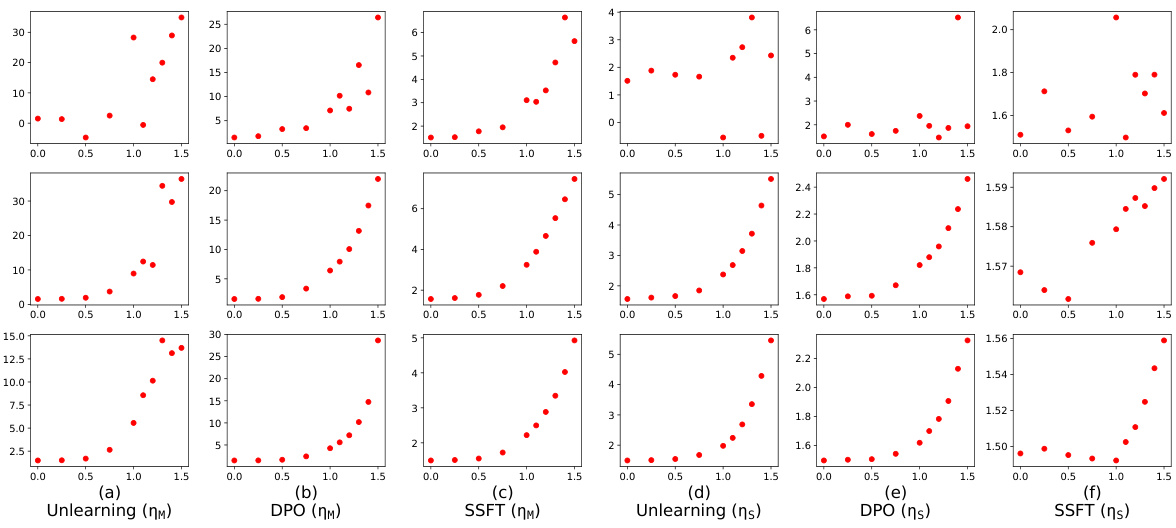
This figure visualizes how safety fine-tuning methods lead to the formation of distinct clusters for safe and unsafe input samples in the activation space of the model. The x-axis represents the layer number in the model, and the y-axis shows the average τ value (a measure of the distance between a sample’s activation and the mean activations of safe and unsafe samples). The top part of the figure demonstrates this effect for a synthetic dataset, while the bottom part showcases the same phenomenon when using the Llama language models. The improved cluster separation with stronger fine-tuning methods is clearly visible.
More on tables

This table presents the safety performance of three different safety fine-tuning methods: Unlearning, Direct Preference Optimization (DPO), and Supervised Safety Fine-Tuning (SSFT). It compares their performance in terms of the model’s accuracy in following instructions (Instruct) and outputting null tokens (Null) for both safe and unsafe inputs. Additionally, it evaluates the model’s robustness against several jailbreaking attacks, highlighting which attacks are most effective against which fine-tuning methods. The learning rates (ηм for medium and ηs for small) used during fine-tuning are also indicated.

The table presents the performance of three safety fine-tuning methods (Unlearning, DPO, and SSFT) using two different learning rates (medium and small). The performance is measured by the model’s accuracy in following instructions (Instruct) and outputting null tokens (Null) for safe and unsafe samples. The table also includes the accuracy of the model when facing various jailbreaking attacks (JB-CO-Task, JB-CO-Text, and JB-MisGen). The results show that SSFT is more susceptible to jailbreaks compared to Unlearning and DPO.

This table presents the safety performance of three different safety fine-tuning methods: Unlearning, Direct Preference Optimization (DPO), and Supervised Safety Fine-tuning (SSFT). The performance is evaluated using two metrics: the model’s accuracy in following instructions (Instruct) and its accuracy in outputting null tokens when faced with unsafe inputs (Null). Additionally, the table assesses the model’s robustness against several jailbreaking attacks, highlighting the relative strength of each attack and the varying success rates depending on the safety fine-tuning method employed. The results indicate that Unlearning and DPO are more robust against jailbreaks than SSFT.

This table presents the safety performance results of three different safety fine-tuning methods: Unlearning, Direct Preference Optimization (DPO), and Supervised Safety Fine-tuning (SSFT). The performance is evaluated using two metrics: the model’s accuracy in following instructions (Instruct) and the accuracy of producing null tokens as a safety response (Null). Results are shown for various attack scenarios, including different types of jailbreaks. JB-CO-Text and JB-MisGen are highlighted as the strongest attacks, with SSFT being particularly susceptible to these.

The table presents a quantitative comparison of three safety fine-tuning methods (Unlearning, DPO, and SSFT) across various metrics, including instruction-following accuracy, null-token generation accuracy, and the success rate of different jailbreak attacks. It highlights the trade-offs between these methods and their varying robustness to adversarial attacks.
Full paper#


