TL;DR#
Many machine learning tasks benefit from incorporating data symmetries. While model-agnostic methods efficiently achieve this through averaging over group actions, their complexity often hinders scalability for large groups. Frame averaging (FA) addresses this by averaging over input-dependent subsets. However, existing FA methods lack a principled design framework for frames and efficient complexity characterization.
This paper introduces a canonicalization perspective, revealing an inherent connection between frames and canonical forms. This allows researchers to design novel and more efficient frames guided by the properties of canonical forms. The proposed approach is demonstrated on eigenvector symmetries, resulting in theoretically and empirically superior frames compared to existing methods. The canonicalization perspective also provides a unified understanding of existing FA methods and resolves open questions regarding the expressive power of invariant networks.
Key Takeaways#
Why does it matter?#
This paper is crucial for researchers working with symmetric data because it offers a novel canonicalization perspective to understand and improve frame averaging methods. It provides theoretical tools to analyze the complexity of existing methods, leading to more efficient and even optimal frame designs. This opens new avenues in equivariant and invariant learning for various applications.
Visual Insights#

🔼 This figure shows a graph where each node has a unique ID and a color representing its feature. If the frame is defined as all permutations that sort the node features in a specific order (grey, blue, green), the size of the frame would be 5! * 2! * 2! = 480. However, all these permutations would result in the same graph. Therefore, the frame size is much larger than the size of the canonicalization (which is 1 because only one graph results from the node feature sorting). This illustrates how the frame averaging approach can be inefficient for graphs with many symmetries.
read the caption
Figure 1: An example where the frame size exceeds the canonicalization by a factor of 480.

🔼 This table compares the average frame size and canonicalization size of two different canonicalization algorithms, FA-graph and OAP-graph, on the EXP dataset. The frame size represents the number of group actions considered for frame averaging, while the canonicalization size represents the number of distinct canonical forms generated. The table shows that OAP-graph consistently has a significantly smaller canonicalization size than FA-graph, demonstrating its superior efficiency.
read the caption
Table 2: The average frame size (F) and canonicalization size (C) on EXP with two canonicalization algorithms: FA-graph and OAP-graph.
In-depth insights#
Canonicalization’s Role#
The concept of canonicalization plays a pivotal role in the paper by offering a unified perspective on invariant and equivariant learning. It bridges the gap between seemingly disparate methods like frame averaging and canonical forms, demonstrating their fundamental equivalence. This unification provides a powerful analytical framework for understanding, comparing, and optimizing existing techniques. By reducing the complexity of frame design to the design of canonicalizations, the paper facilitates the development of more efficient and expressive algorithms. This is particularly valuable in complex domains like graph and eigenvector learning where the inherent symmetries present significant computational challenges. Furthermore, the paper leverages the canonicalization perspective to analyze theoretical properties like universality and optimality, leading to the development of novel, superior frames and a deeper understanding of existing methods like SignNet and BasisNet. Ultimately, the paper advocates for a principled, canonicalization-centric approach to symmetry-aware learning, paving the way for more efficient and effective algorithms in the future.
Frame Averaging Limits#
Frame averaging, a technique used to achieve invariance or equivariance in neural networks, faces limitations stemming from its reliance on averaging over group actions. Computational costs can explode exponentially with increasing group size, particularly for large permutation groups encountered in graph neural networks. The design of frames, the subsets of group actions used for averaging, lacks a principled approach, often relying on heuristics. This makes it hard to compare different frame designs and optimize frame complexity. Automorphisms of inputs, symmetries within individual data points, further complicate the efficiency of frame averaging as it impacts the size of the effective averaging set. The canonicalization perspective introduced in this paper aims to directly address these limitations by establishing a principled link between frames and canonical forms, enabling a more efficient analysis and design of frames to overcome the inherent limitations of frame averaging.
Eigenvector Symmetries#
Eigenvector symmetries, particularly within the context of graph neural networks (GNNs), present significant challenges and opportunities. Sign ambiguity, where an eigenvector can be multiplied by -1 without changing its associated eigenvalue, and basis ambiguity, where multiple orthonormal bases can span the same eigenspace, are major concerns. These ambiguities hinder the ability of GNNs to learn robust and stable representations from graph data, as identical graphs can have different eigenvector representations due to these symmetries. Addressing these symmetries is crucial for ensuring that GNNs produce consistent and generalizable outputs. Various methods, such as frame averaging and canonicalization, aim to resolve eigenvector ambiguities by averaging over group actions or mapping inputs to canonical forms. The choice of the method and specific design of frames or canonicalization techniques has significant implications for computational efficiency and expressiveness. Optimal canonicalization methods are critical to minimize computational cost while preserving the ability of GNNs to learn complex graph properties.
OAP: Optimal Frames#
The heading ‘OAP: Optimal Frames’ suggests a discussion on a novel method, OAP (likely an acronym for a specific algorithm or technique), designed to construct optimal frames for a particular application. Frames, within the context of this likely machine learning paper, are likely subsets of a larger group of transformations applied to data. Optimal frames would balance efficiency (minimizing the number of transformations needed) and representational power (capturing relevant data symmetries). The likely goal of OAP is to improve upon existing frame-averaging methods which are often computationally expensive, especially when dealing with large groups or complex data structures (such as graphs or point clouds). OAP’s optimality likely stems from a rigorous theoretical foundation, possibly linked to a canonicalization framework that reduces frame design to a more tractable problem. The paper likely demonstrates OAP’s superiority over existing methods through theoretical analysis and empirical evaluation, possibly showcasing improved performance on specific datasets or tasks involving graph or eigenvector processing. The discussion may also highlight how OAP addresses challenges like handling data ambiguities related to symmetries (e.g., sign or basis ambiguities for eigenvectors) This section would likely provide implementation details for OAP, making it useful for practitioners. Overall, ‘OAP: Optimal Frames’ promises a significant contribution to the field, offering both theoretical insights and practical improvements in the design of efficient frame averaging methods.
Universality & Expressivity#
The concepts of universality and expressivity are crucial for evaluating the capabilities of machine learning models, especially those dealing with symmetries. Universality refers to a model’s ability to approximate any function within a given function class, while expressivity focuses on the richness of the functions a model can represent. In the context of equivariant and invariant learning, achieving universality is often computationally expensive due to the need to average over group actions. The paper explores how canonicalization, a classic technique for achieving invariance, can provide a more efficient and principled path to universality. By mapping inputs to their canonical forms, one can reduce the complexity of averaging while maintaining desirable symmetries. Furthermore, the paper highlights a key trade-off: while model-agnostic methods like frame averaging offer great expressive power, they often incur high computational costs due to the potentially exponential size of the group. The canonicalization perspective offers a path to reconciling expressivity and computational feasibility. This is achieved by reducing the complexity of the averaging operations through canonical representations. The analysis of universality and expressivity provides a fundamental understanding of existing methods and their limitations, guiding the development of new and more efficient algorithms.
More visual insights#
More on tables

🔼 This table presents a comparison of the average frame size and canonicalization size for two different canonicalization algorithms, FA-graph and OAP-graph, applied to the EXP dataset. The frame size represents the number of forward passes required during frame averaging, while the canonicalization size represents the size of the canonical form. The table demonstrates that OAP-graph significantly reduces the frame/canonicalization size compared to FA-graph, suggesting increased efficiency.
read the caption
Table 2: The average frame size (F) and canonicalization size (C) on EXP with two canonicalization algorithms: FA-graph and OAP-graph.

🔼 This table shows the accuracy of different graph neural network models on the EXP dataset. The EXP dataset is designed to evaluate the expressive power of graph neural networks by including pairs of graphs that are non-isomorphic but 1-WL indistinguishable. The results demonstrate that while standard GNN models achieve only around 50% accuracy, models that incorporate the proposed canonicalization or frame averaging achieve perfect accuracy (100%). This highlights the effectiveness of the proposed methods in improving the expressive power of GNNs.
read the caption
Table 1: Accuracy on EXP.

🔼 This table presents a comparison of the average frame size and canonicalization size for two different canonicalization algorithms (FA-graph and OAP-graph) on the EXP dataset. The frame size represents the number of group elements considered during frame averaging, while the canonicalization size represents the number of distinct canonical forms. The F/C ratio indicates how much more efficient OAP-graph is than FA-graph in terms of the number of forward passes needed for averaging.
read the caption
Table 2: The average frame size (F) and canonicalization size (C) on EXP with two canonicalization algorithms: FA-graph and OAP-graph.

🔼 This table shows the percentage of eigenvectors that cannot be canonicalized by different methods for addressing sign and basis ambiguities on the ZINC dataset. It demonstrates that OAP significantly outperforms other methods (FA-lap and MAP) in handling basis ambiguity, while all methods perform similarly for sign ambiguity.
read the caption
Table 3: Ratio of non-canonicalizable eigenvectors on ZINC.
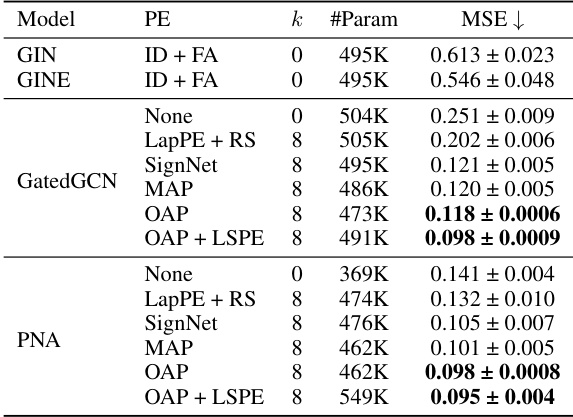
🔼 This table presents the Mean Squared Error (MSE) results on the ZINC dataset for various graph neural network models using different positional encodings. The models are GatedGCN and PNA, with different positional encoding methods: None, LapPE + RS (Laplacian Positional Encoding with Random Signs), SignNet, MAP (Ma et al.’s canonicalization), OAP (Orthogonal Axis Projection), and OAP + LSPE (OAP with Laplacian Spectral Positional Encoding layers). The table shows the performance of different methods with 500K parameter budget, averaged over four runs with four different seeds to ensure reliable results. OAP and OAP + LSPE show the best results.
read the caption
Table 4: Results on ZINC with 500K parameter budget. All scores are averaged over 4 runs with 4 different seeds.
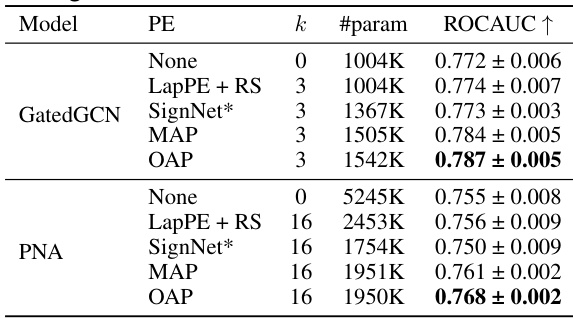
🔼 This table presents the results of graph regression experiments on the ZINC dataset. Multiple models (GatedGCN and PNA) are evaluated, each with different positional encoding (PE) methods: None, LapPE + RS (Laplacian Positional Encoding with Random Signs), SignNet, MAP (Ma et al.’s canonicalization), and OAP (Orthogonal Axis Projection, the authors’ proposed method). The table shows the mean squared error (MSE) for each model and PE combination, averaged over four runs with different random seeds. The results highlight the performance improvements achieved by using the proposed OAP method compared to other baselines. The ‘k’ column represents the number of eigenvectors used.
read the caption
Table 4: Results on ZINC with 500K parameter budget. All scores are averaged over 4 runs with 4 different seeds.
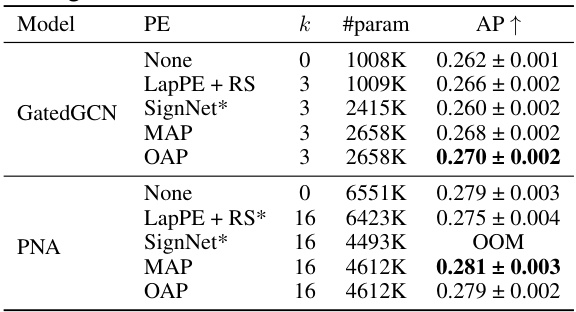
🔼 This table presents the results of graph property prediction experiments on the MOLPCBA dataset. Different positional encodings (PE) are used with GatedGCN and PNA backbones. The table shows the average Area Under the Precision-Recall Curve (AUC-PR or AP↑) for each model and PE method, averaged over four runs with four different random seeds. The results illustrate the performance improvements achieved by incorporating different positional encodings, particularly OAP.
read the caption
Table 6: Results on MOLPCBA. All scores are averaged over 4 runs with 4 different seeds.

🔼 This table compares the pre-processing time, training time, total time, and memory usage of different models on the ZINC dataset. The models are categorized by the backbone network used (GatedGCN or PNA) and whether they incorporate SignNet, MAP, or OAP for canonicalization. It highlights the computational overhead associated with different canonicalization techniques and the two-branch architecture of SignNet.
read the caption
Table 7: Comparison of time and memory of canonicalization methods with their non-FA backbone on ZINC. For the backbone models, the node features are first concatenated with positional encodings and fed to a positional encoding network (we use masked GIN in our experiments), then the outputs of the positional encoding network are used as input for the main network (GatedGCN or PNA). For the SignNet models, the positional encoding network is substituted with SignNet, which has a two-branch architecture. For models with MAP and OAP, the positional encodings are canonicalized before fed to the positional encoding network.

🔼 This table compares the average frame size and canonicalization size of two different canonicalization algorithms, FA-graph and OAP-graph, on the EXP dataset. The frame size represents the number of group actions considered in frame averaging, while the canonicalization size represents the number of unique canonical forms produced. The ratio of the frame size to the canonicalization size is also provided for each algorithm. This table demonstrates the computational efficiency advantage of canonicalization over frame averaging, particularly when dealing with highly symmetrical inputs.
read the caption
Table 2: The average frame size (F) and canonicalization size (C) on EXP with two canonicalization algorithms: FA-graph and OAP-graph.

🔼 This table presents a comparison of the average frame size and canonicalization size for two different canonicalization algorithms (FA-graph and OAP-graph) on the EXP dataset. It highlights the computational efficiency gains achieved by using canonicalization (OAP-graph) compared to frame averaging (FA-graph), showing that OAP-graph has significantly smaller sizes (and thus faster computation). The F/C ratio shows that OAP-graph is orders of magnitude more efficient than FA-graph. This table supports the claim that the canonicalization approach is superior to frame averaging in terms of efficiency.
read the caption
Table 2: The average frame size (F) and canonicalization size (C) on EXP with two canonicalization algorithms: FA-graph and OAP-graph.
🔼 This table presents a comparison of the average frame size and canonicalization size for two different canonicalization algorithms (FA-graph and OAP-graph) on the EXP dataset. It demonstrates the computational efficiency gains achieved by using canonicalization (OAP-graph) compared to frame averaging (FA-graph), especially highlighted by the significant reduction in the F/C ratio for OAP-graph across different graph sizes.
read the caption
Table 2: The average frame size (F) and canonicalization size (C) on EXP with two canonicalization algorithms: FA-graph and OAP-graph.
🔼 This table compares the average frame size and canonicalization size for two different canonicalization algorithms (FA-graph and OAP-graph) on the EXP dataset. The frame size represents the number of group elements considered in frame averaging, while the canonicalization size indicates the number of unique canonical forms. The F/C ratio shows how much larger the frame size is compared to the canonicalization size, illustrating the efficiency gain of using canonicalization. The FA/OAP ratio compares the average frame size of FA-graph to the average frame size of OAP-graph for each of the three dataset sizes, showing the reduction in frame size achieved by the OAP-graph algorithm.
read the caption
Table 2: The average frame size (F) and canonicalization size (C) on EXP with two canonicalization algorithms: FA-graph and OAP-graph.
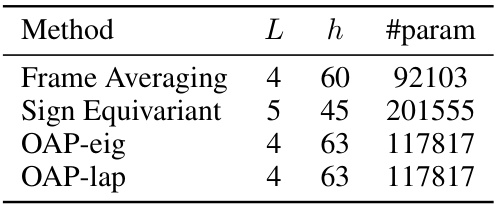
🔼 This table shows the hyper-parameters used for different methods in the n-body experiment when the dimension d is set to 3. It lists the number of layers (L), hidden dimension (h), and the total number of parameters (#param) for each method, including Frame Averaging, Sign Equivariant, OAP-eig, and OAP-lap.
read the caption
Table 8: Hyper-parameter settings of different methods in the n-body experiment with dimension d = 3.
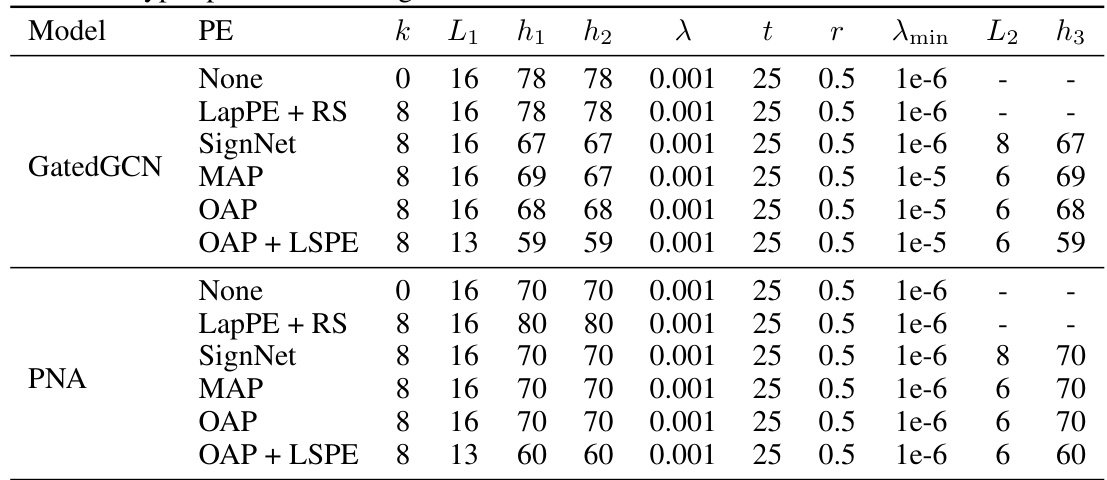
🔼 This table lists the hyperparameter settings used in the ZINC experiment for different models and positional encodings (PE). It includes the number of eigenvectors (k), the number of layers (L1, L2), the hidden dimension (h1, h2, h3), the learning rate (λ), the patience (t) and the factor (r) of the learning rate scheduler, the minimum learning rate (λmin), and the output dimension of SignNet or the normal GNN (when using canonicalization as PE).
read the caption
Table 9: Hyper-parameter settings of different models with different PE methods on ZINC.
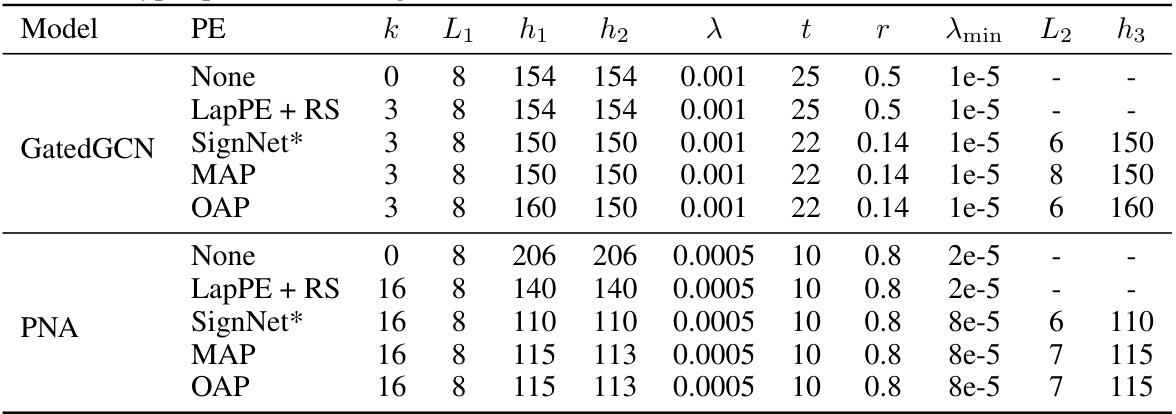
🔼 This table presents the hyperparameter settings used in the ZINC experiment for different models. It includes the number of eigenvectors (k), the number of layers (L1, L2) and hidden dimensions (h1, h2, h3) for the base model and the optional SignNet/GNN, the learning rate (λ), the patience and factor for the learning rate scheduler (t, r), the minimum learning rate (λmin), and the hidden dimension (h3) when using canonicalization as PE.
read the caption
Table 9: Hyper-parameter settings of different models with different PE methods on ZINC.
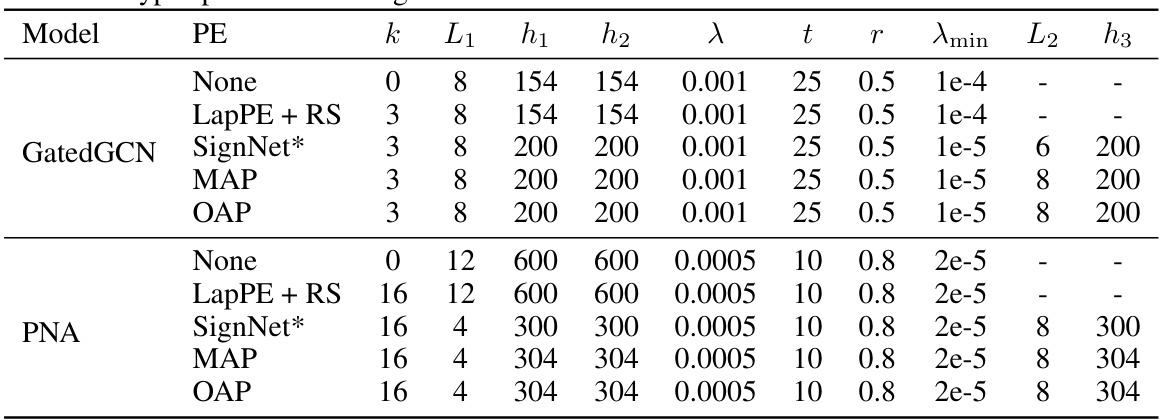
🔼 This table lists the hyperparameters used for different graph neural network models on the ZINC dataset. The models are evaluated with different positional encodings (PE): None, LapPE+RS, SignNet, MAP, OAP, and OAP+LSPE. The hyperparameters include the number of eigenvectors (k), number of layers (L1 and L2), hidden dimensions (h1, h2, h3), learning rate (λ), patience (t), learning rate decay factor (r), minimum learning rate (λmin), etc. The table allows comparison of hyperparameter choices based on PE methods.
read the caption
Table 9: Hyper-parameter settings of different models with different PE methods on ZINC.
Full paper#


