TL;DR#
Current neuroscience struggles to deeply explore neural representations of behaviors due to decoding models lacking encoding details and varied behavioral encoding across brain regions. This paper’s challenge is to enable in-depth exploration and reveal interpretable neural dynamics associated with behaviors. Mixed selectivity across brain regions poses a significant hurdle to understanding behavior’s neural basis.
To address these challenges, the researchers introduce BeNeDiff. This novel method uses a behavior-informed latent variable model to identify a disentangled neural subspace. State-of-the-art generative diffusion models are used to create behavior videos that interpret neural dynamics. BeNeDiff’s validation on multi-session datasets showcases its ability to interpret behaviors across brain regions with high disentanglement and neural reconstruction quality. This technique significantly improves our understanding of complex interrelationships between behavioral data and neural activity, enabling fine-grained behavior quantification.
Key Takeaways#
Why does it matter?#
This paper is important because it presents a novel method, BeNeDiff, for analyzing large-scale neuro-behavioral data. BeNeDiff offers a new way to understand how neural activity encodes behavior by combining behavior-informed latent variable models with generative diffusion models. This approach addresses the limitations of traditional decoding models and offers researchers a powerful tool for exploring the complex relationships between neural dynamics and behavior. Its findings have implications for various fields, including neuroscience, psychiatry, and neurology, opening up new avenues for research on the neural basis of behavior.
Visual Insights#
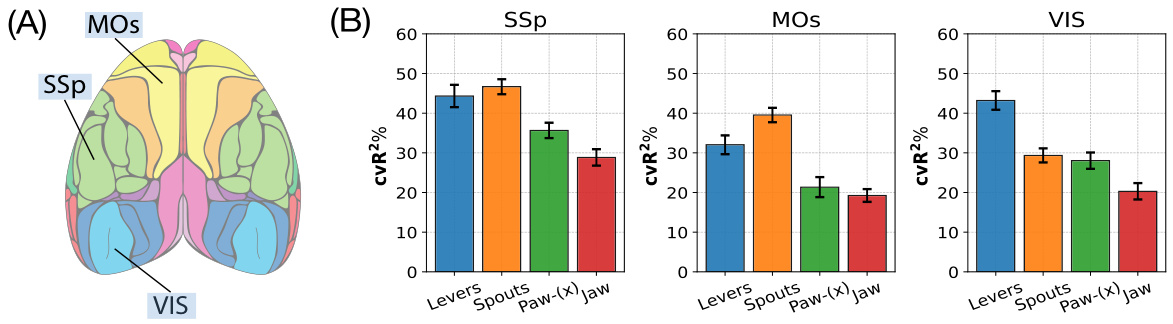
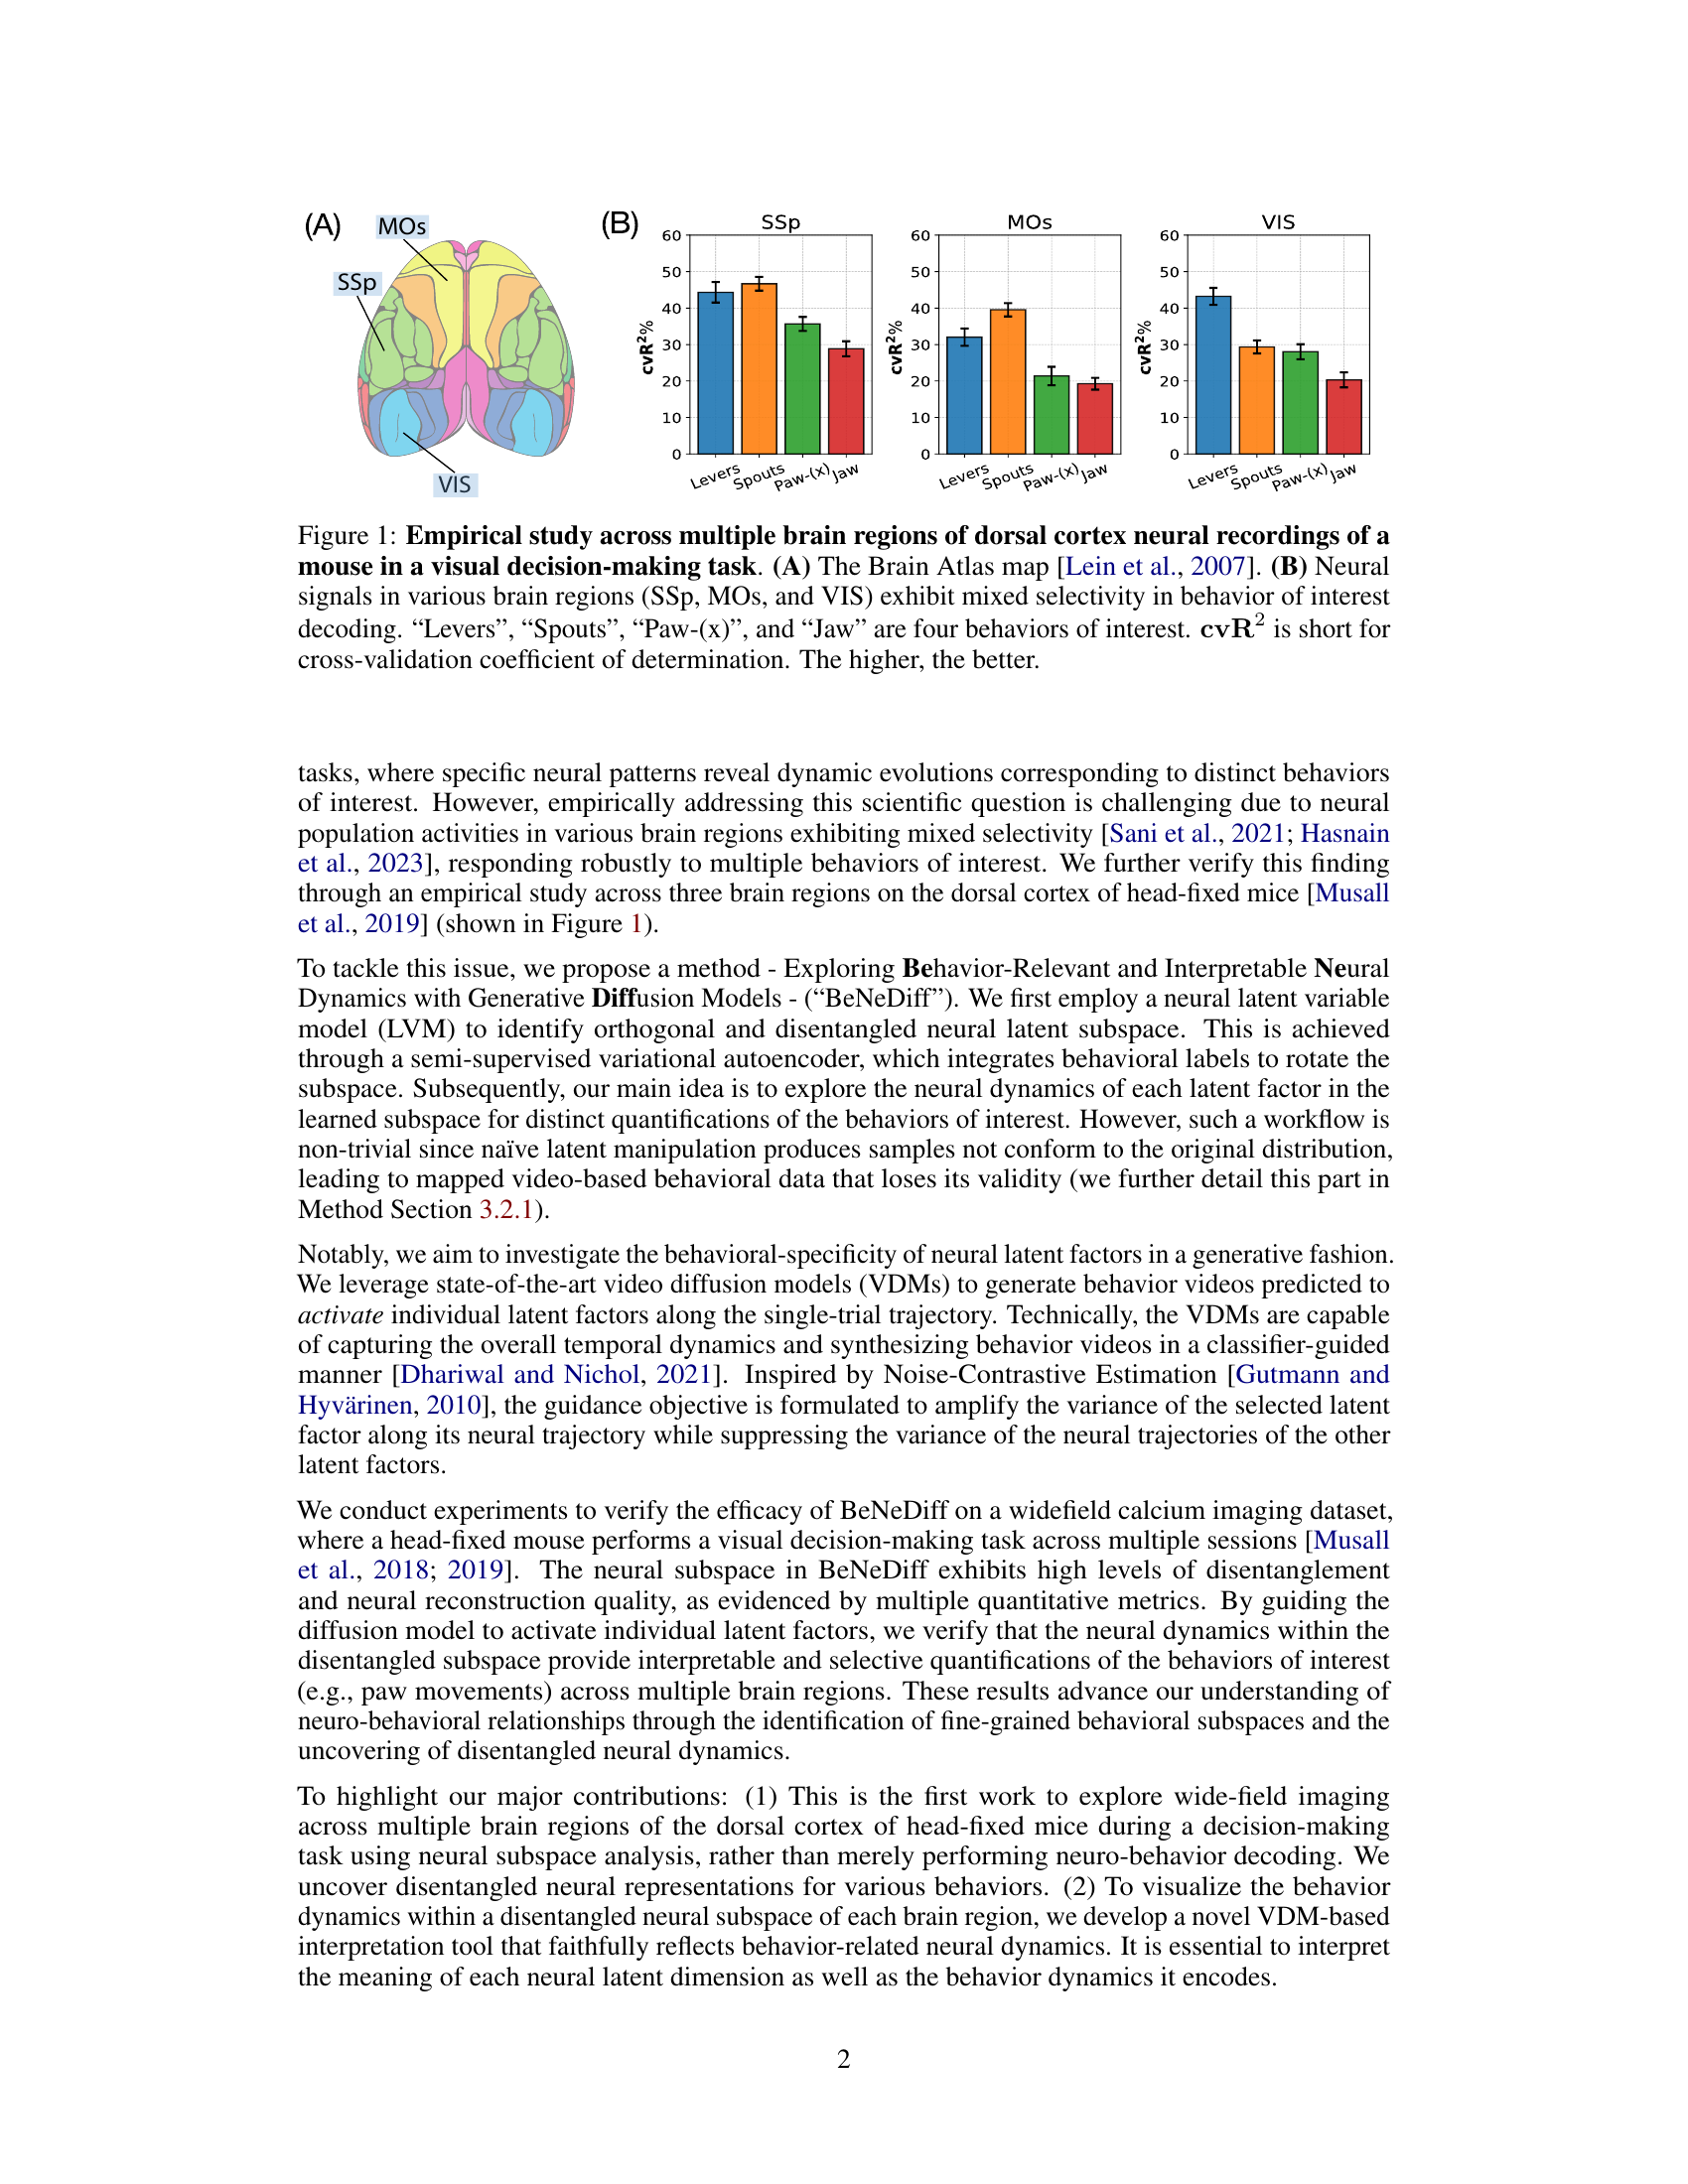
🔼 This figure shows the results of an empirical study on a mouse performing a visual decision-making task. Panel A displays a brain map highlighting three regions of interest: SSp, MOs, and VIS. Panel B presents bar graphs illustrating the mixed selectivity of neural signals in these brain regions for four different behaviors (Levers, Spouts, Paw-(x), and Jaw). The cross-validation coefficient of determination (cvR²) is used as a metric to quantify how well the neural signals predict each behavior, with higher cvR² indicating better prediction accuracy.
read the caption
Figure 1: Empirical study across multiple brain regions of dorsal cortex neural recordings of a mouse in a visual decision-making task. (A) The Brain Atlas map [Lein et al., 2007]. (B) Neural signals in various brain regions (SSp, MOs, and VIS) exhibit mixed selectivity in behavior of interest decoding. “Levers”, “Spouts”, “Paw-(x)”, and “Jaw” are four behaviors of interest. cvR² is short for cross-validation coefficient of determination. The higher, the better.
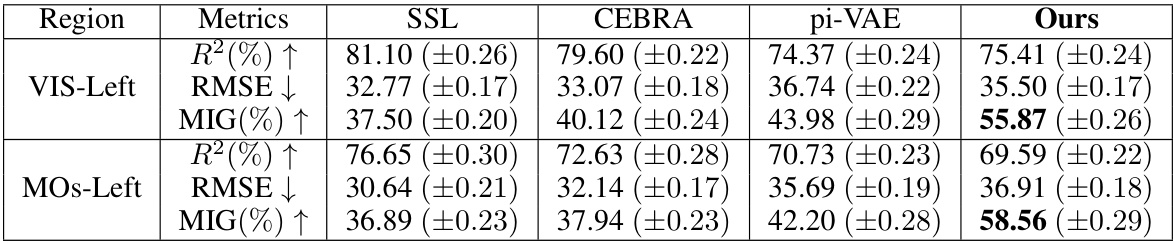
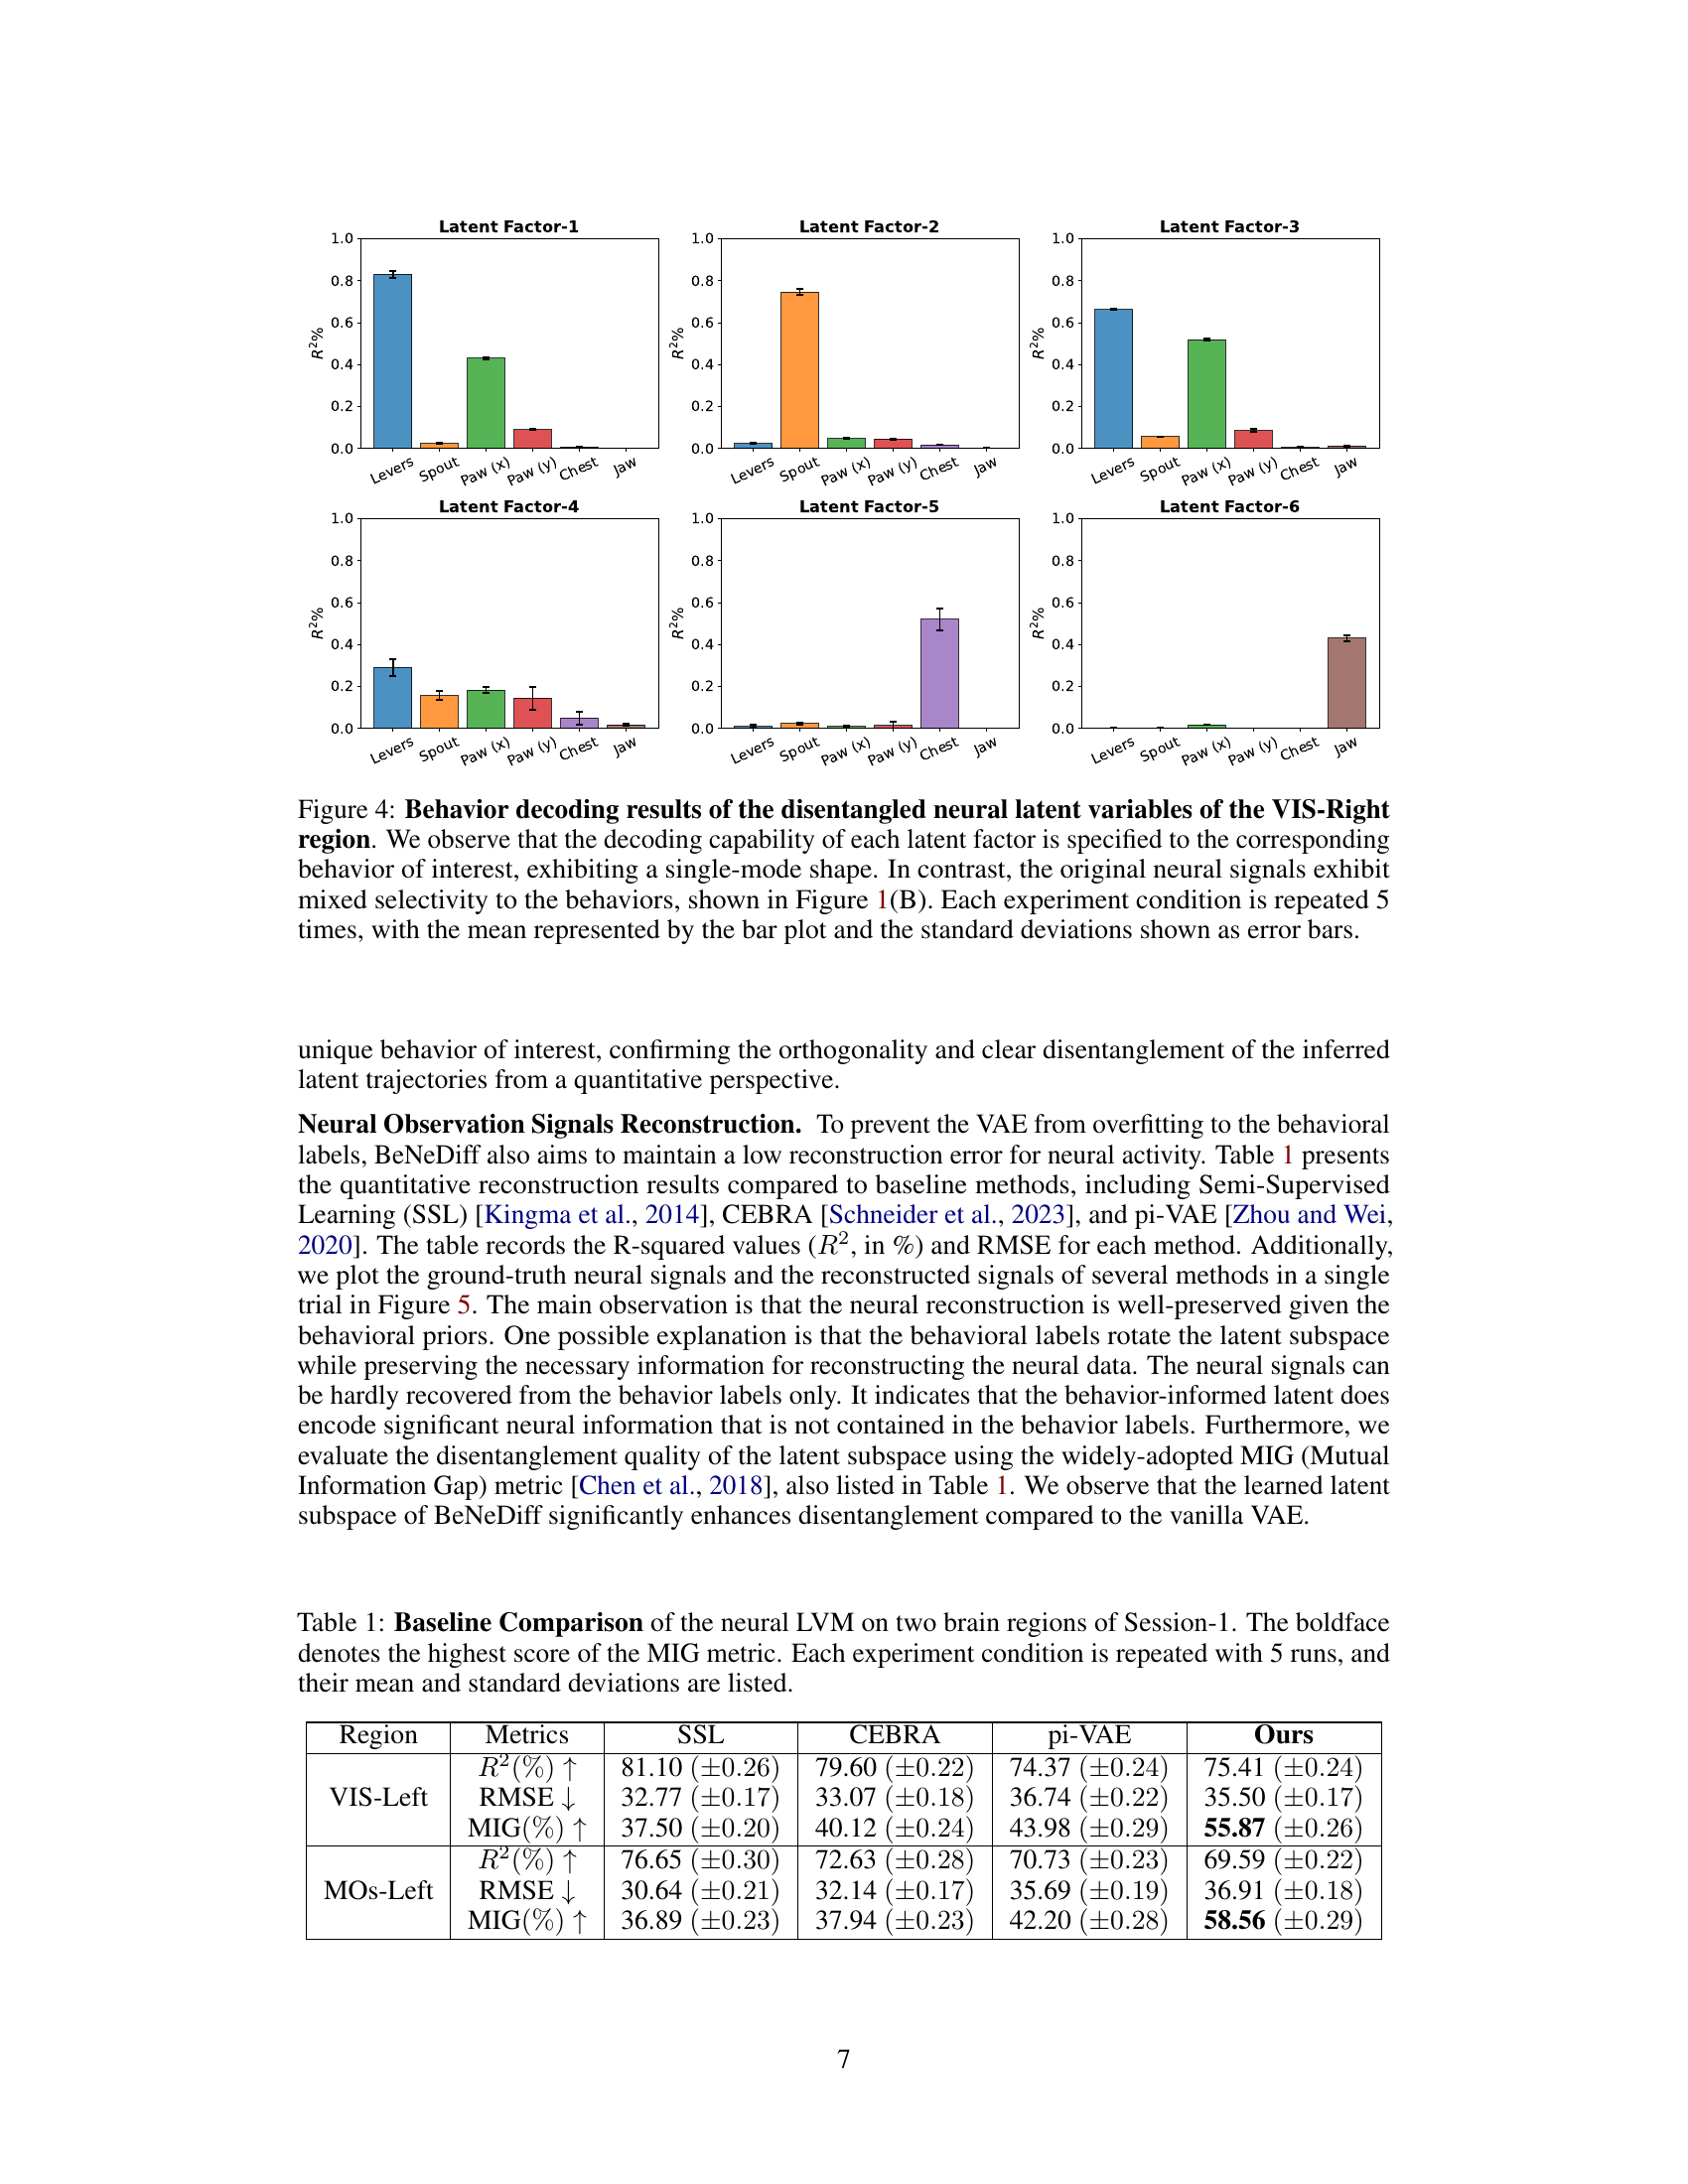
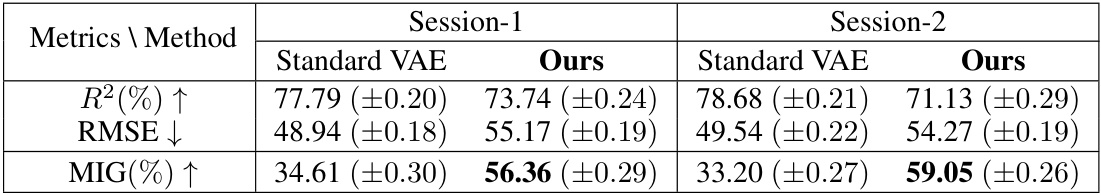
🔼 This table compares the performance of the neural latent variable model (LVM) used in BeNeDiff against three baseline methods: Semi-Supervised Learning (SSL), CEBRA, and pi-VAE. The comparison is done across two brain regions (VIS-Left and MOs-Left) and three metrics: R-squared (R²), Root Mean Squared Error (RMSE), and Mutual Information Gap (MIG). Higher R² and MIG values are better, while a lower RMSE value is better. The bold values highlight the best performance achieved by BeNeDiff across all the metrics.
read the caption
Table 1: Baseline Comparison of the neural LVM on two brain regions of Session-1. The boldface denotes the highest score of the MIG metric. Each experiment condition is repeated with 5 runs, and their mean and standard deviations are listed.
In-depth insights#
Neural Subspace ID#
The concept of ‘Neural Subspace ID’ points towards a crucial advancement in neuroscience research. It suggests a methodology for identifying and characterizing lower-dimensional structures within high-dimensional neural activity data. This is significant because it allows researchers to reduce the complexity of neural recordings, focusing on the most behaviorally relevant information. By identifying these subspaces, we can gain a deeper understanding of how neural activity is organized and how it relates to behavior. Disentangling these subspaces is key, as it helps to isolate the contributions of individual factors influencing behavior, moving beyond simple correlations to reveal causal relationships. The methods for achieving this ‘Neural Subspace ID’ likely involve dimensionality reduction techniques, potentially incorporating machine learning approaches like factor analysis, independent component analysis, or autoencoders. The effectiveness of the method would depend heavily on the quality of the data and the appropriateness of the chosen dimensionality reduction method. Successfully identifying informative neural subspaces could revolutionize our ability to interpret neural activity, paving the way for more precise and accurate models of brain function and behavior.
Diffusion Model Use#
The research paper utilizes diffusion models as a core component for generating behavior videos based on disentangled neural dynamics. This innovative approach leverages the models’ capacity for high-quality video synthesis and temporal consistency, effectively translating neural latent trajectories into visual representations of the observed behaviors. A key aspect is the classifier-guided diffusion process, enabling precise control over the generated video content by activating specific neural latent factors, thereby providing interpretable quantifications of the neural dynamics. The authors demonstrate the effectiveness of this approach in fine-grained behavioral analysis, showcasing how different neural factors contribute to various aspects of a behavior. The choice to use diffusion models directly addresses the challenge of generating temporally consistent videos, improving on prior methods that often struggled with this aspect. The success hinges on the model’s capacity for learning and representing complex temporal patterns inherent in behavioral data.
Behavioral Specificity#
Behavioral specificity in neuroscience research refers to the degree to which neural activity patterns are uniquely associated with specific behaviors. High behavioral specificity suggests that a given neural pattern reliably predicts a particular behavior, while low specificity indicates that the same pattern might be involved in multiple behaviors. Understanding this specificity is crucial because it informs our understanding of how the brain encodes and represents behavior. Disentangling mixed selectivity, where neural populations respond to multiple behaviors, is key to achieving high behavioral specificity. This often requires sophisticated analytical techniques that can separate the neural signals related to different behavioral dimensions. Studies investigating this often utilize advanced machine learning models and statistical methods to decode or generate behavioral data from neural activity, to understand how specific neuronal subpopulations differentially contribute to various behaviors. The level of behavioral specificity revealed can greatly influence interpretations of neural function and informs future research directions, potentially leading to novel insights into the neural organization of behavior and the underlying mechanisms driving complex actions.
Cross-Region Dynamics#
Analyzing cross-region dynamics in neural activity is crucial for understanding integrated brain function. A key challenge lies in disentangling how different brain regions contribute to complex behaviors, especially when neural responses show mixed selectivity. Investigating how information flows and transforms across regions requires advanced methods capable of analyzing high-dimensional data with temporal dynamics. Generative models offer a promising avenue by allowing exploration of latent neural representations that map onto behavioral patterns across brain areas. Such methods can reveal how neural activity in one region influences and is influenced by the activity of another, thus highlighting the interaction patterns that govern behavior. Successful application requires robust methods that handle noise, mixed selectivity, and large datasets. Future work should focus on developing interpretable models that specifically isolate and quantify cross-region influence, ultimately providing a mechanistic understanding of how distributed neural circuits generate behavior.
Future Work#
The ‘Future Work’ section of this research paper presents exciting avenues for expanding upon the current findings. Extending the approach to a wider array of neural datasets is crucial to validate the model’s generalizability and robustness. This includes exploring different brain regions, species, behavioral paradigms, and imaging modalities. Refining the generative diffusion models is another key area. Improving the model’s ability to generate more realistic and less noisy behavior videos will be vital for enhancing interpretability. This might involve exploring alternative architectures or incorporating techniques to better control temporal consistency and reduce artifacts. Finally, investigating the underlying theoretical mechanisms driving the observed neural dynamics is a significant area that needs deeper exploration. The connection between the disentangled neural subspaces and the specific behavioral dynamics needs to be further clarified through theoretical modeling. This would strengthen the causal inferences drawn and contribute to a more profound understanding of the neural basis of behavior.
More visual insights#
More on figures
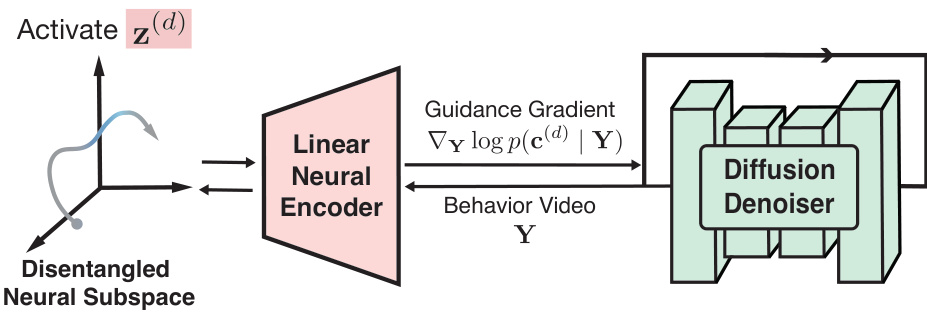
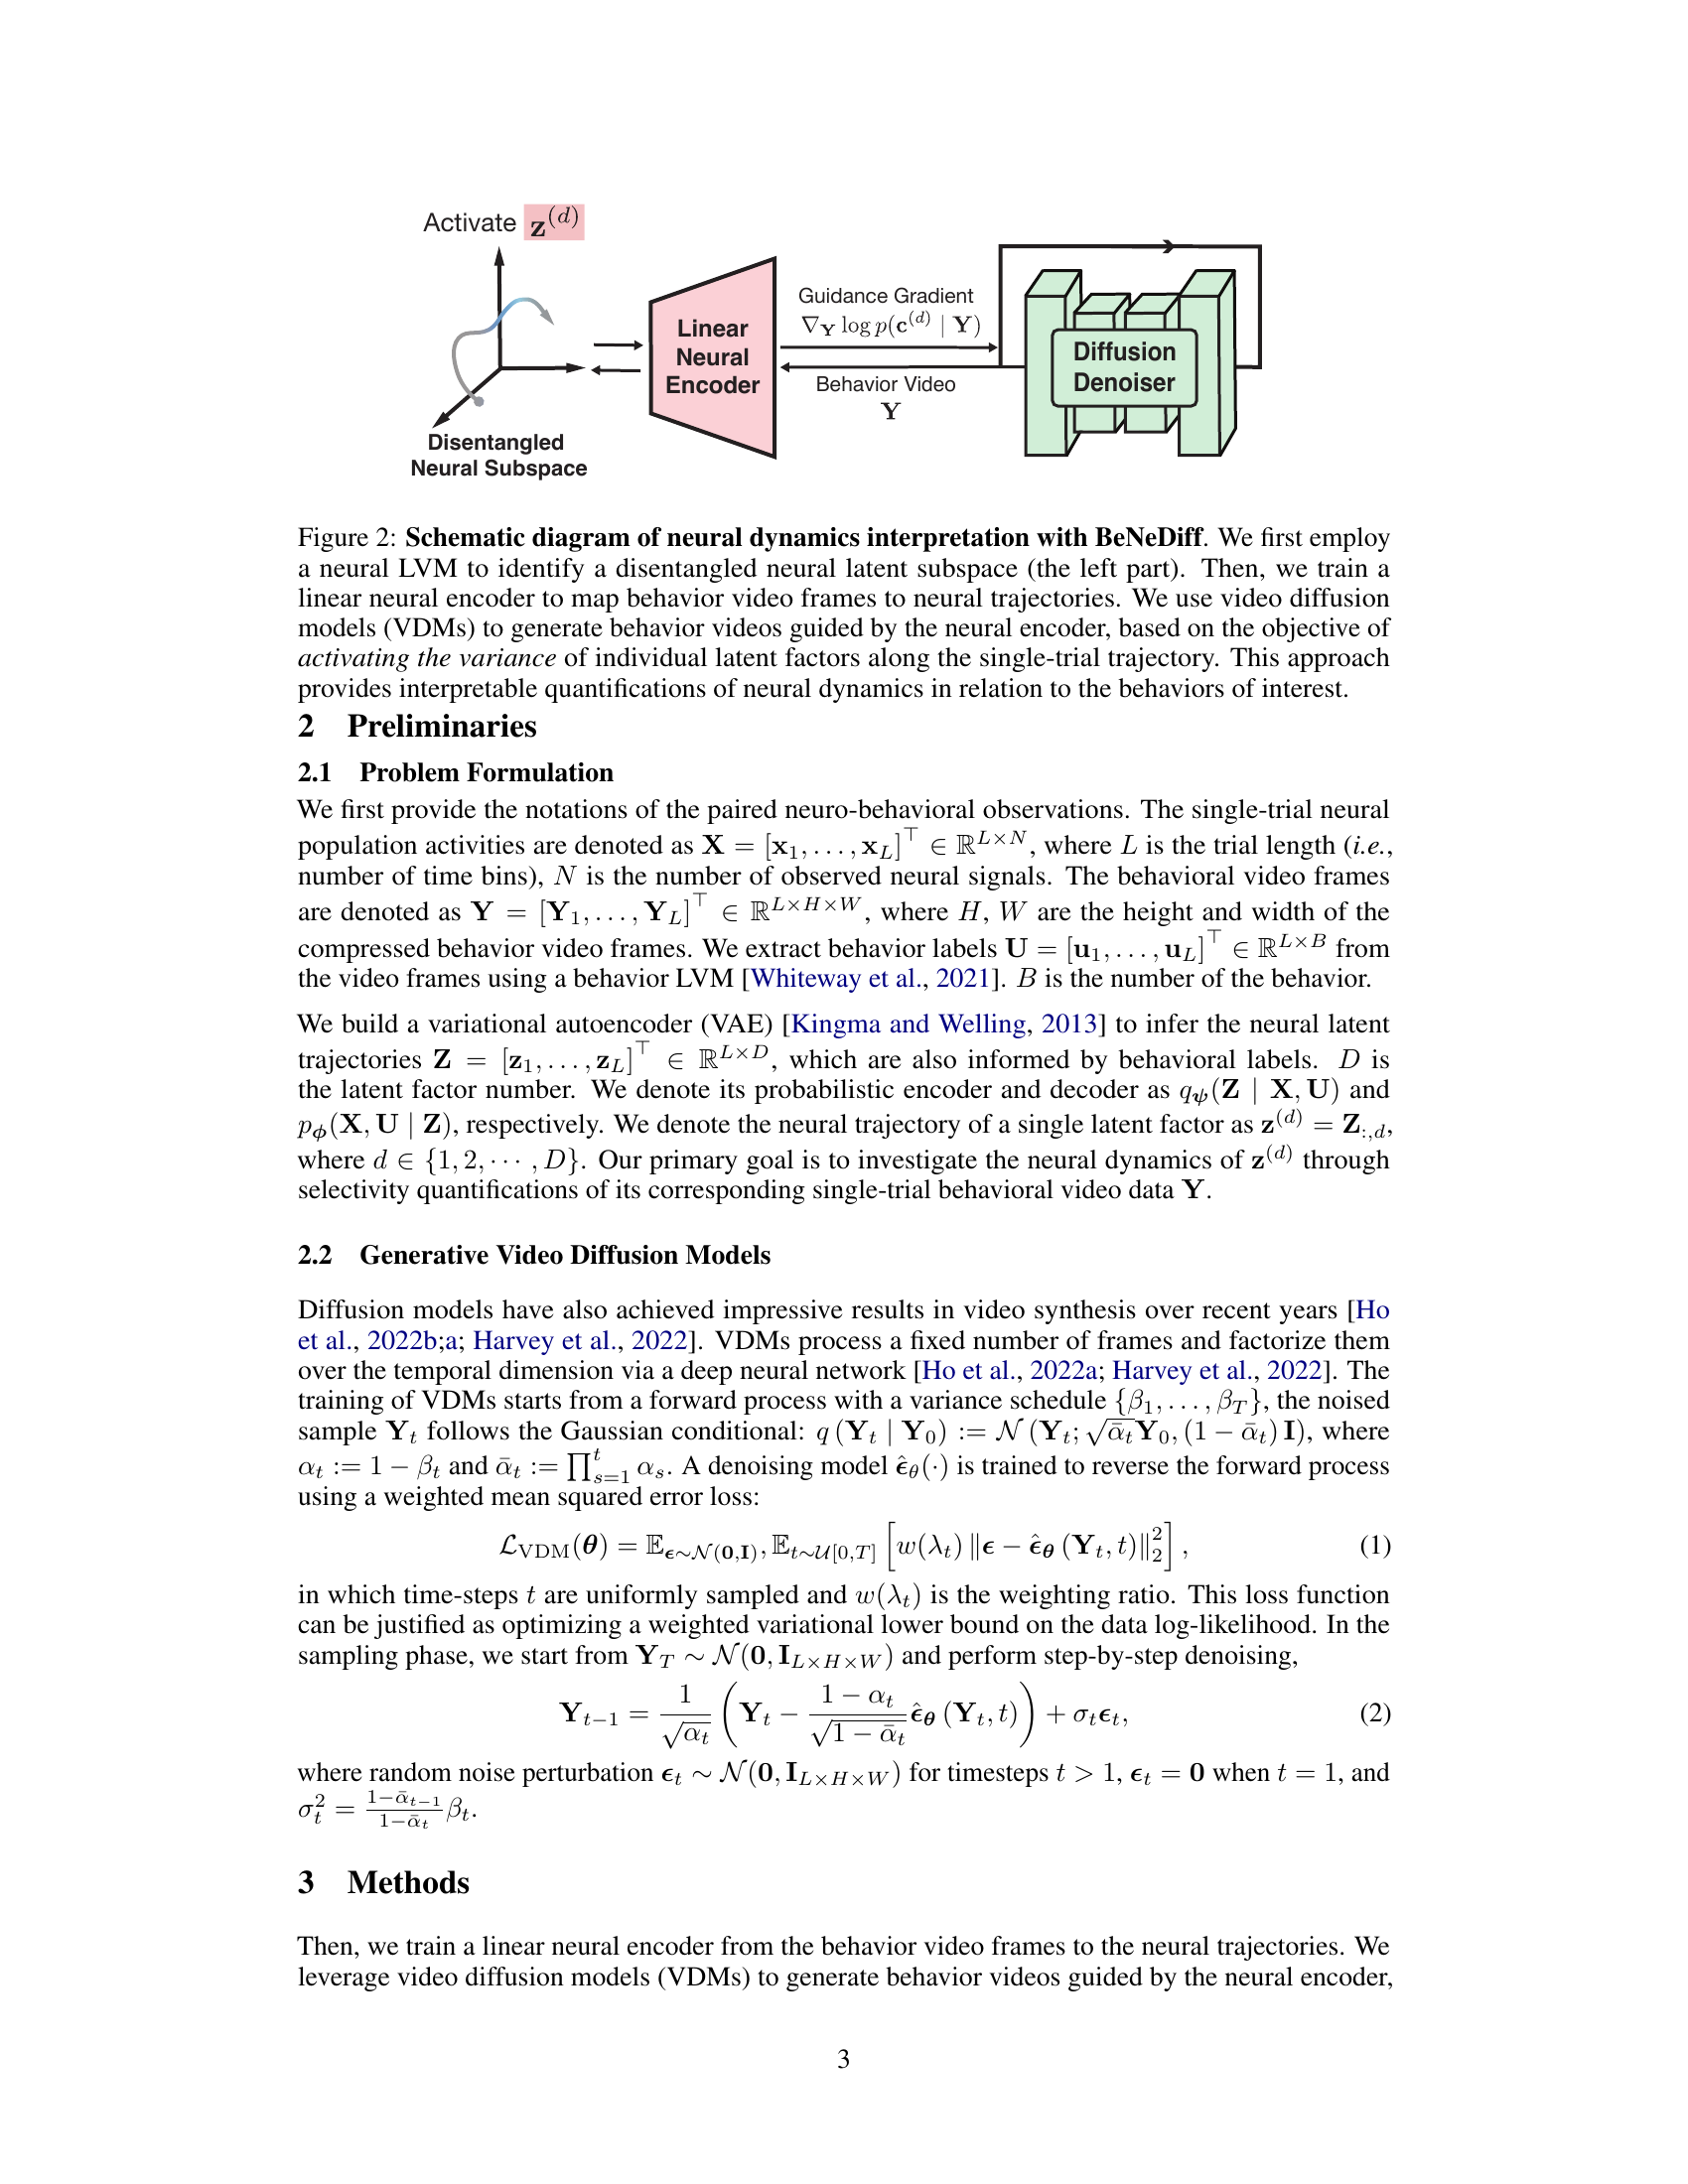
🔼 This figure illustrates the BeNeDiff framework for interpreting neural dynamics. It shows how a disentangled neural subspace is identified using a latent variable model (LVM). A linear neural encoder maps behavior videos to neural trajectories. Finally, video diffusion models (VDMs) generate behavior videos by activating individual latent factors, enabling interpretable quantification of neural dynamics related to specific behaviors.
read the caption
Figure 2: Schematic diagram of neural dynamics interpretation with BeNeDiff. We first employ a neural LVM to identify a disentangled neural latent subspace (the left part). Then, we train a linear neural encoder to map behavior video frames to neural trajectories. We use video diffusion models (VDMs) to generate behavior videos guided by the neural encoder, based on the objective of activating the variance of individual latent factors along the single-trial trajectory. This approach provides interpretable quantifications of neural dynamics in relation to the behaviors of interest.
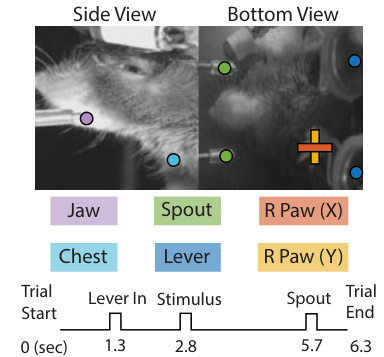
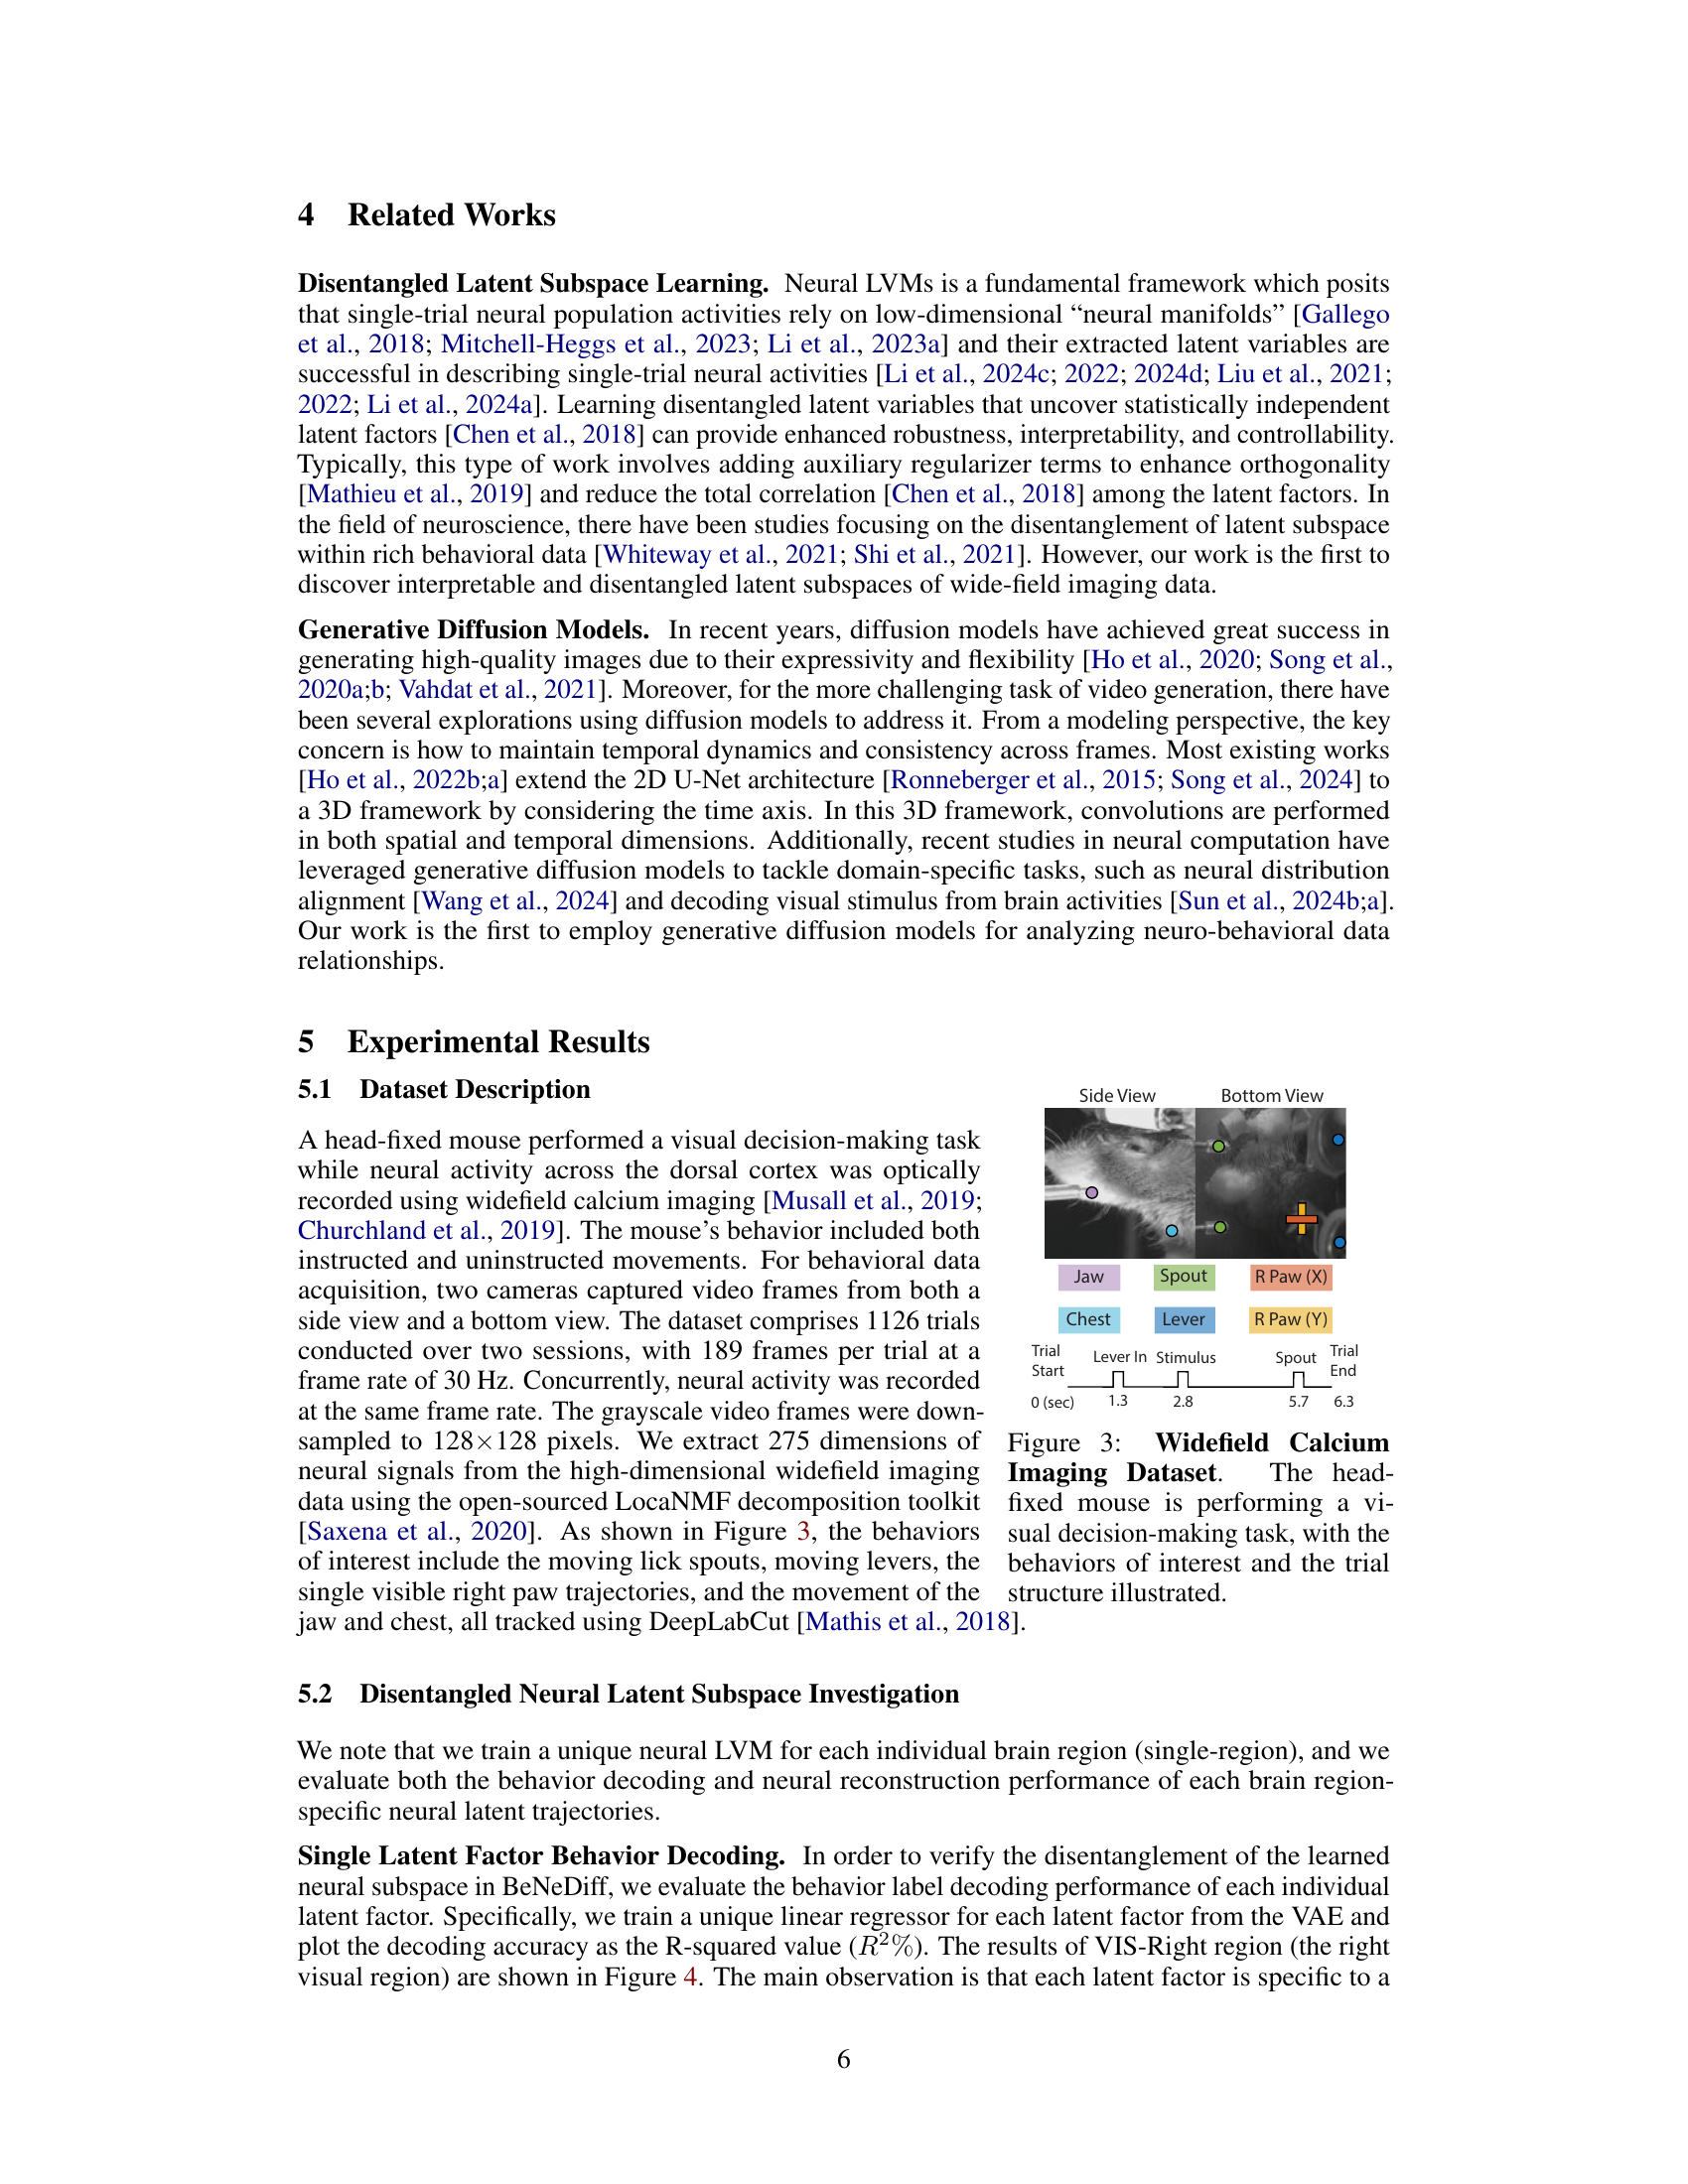
🔼 The figure shows a schematic of the experimental setup and the behavioral data collected. The top panel shows images from two cameras, side and bottom views, capturing the mouse performing a task. Colored dots on the images represent different body parts tracked, including the jaw, spout, right paw (x and y coordinates), chest, and lever. The bottom panel displays a timeline of the trial, indicating the timing of events like trial start, lever insertion, stimulus presentation, spout activation, and trial end. This illustrates the types of behavioral data collected along with the neural data for the study.
read the caption
Figure 3: Widefield Calcium Imaging Dataset. The head-fixed mouse is performing a visual decision-making task, with the behaviors of interest and the trial structure illustrated.
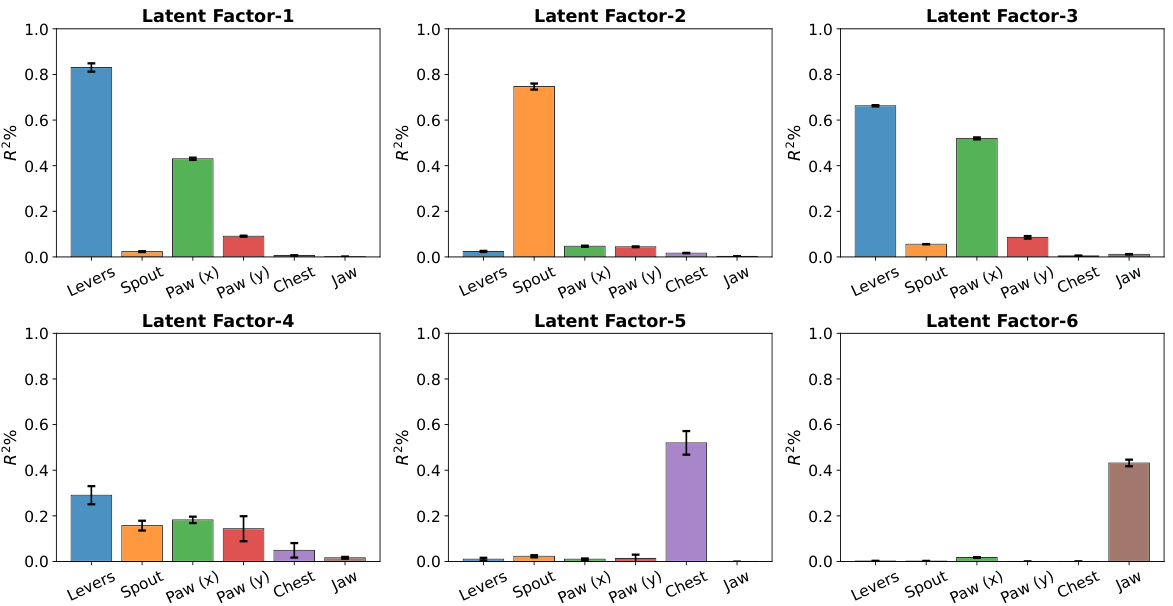
🔼 This figure presents the behavior decoding results for each disentangled latent variable in the right visual region (VIS-Right) of the mouse brain. Each bar represents the R-squared (R²) value, indicating the proportion of variance in each behavior explained by a specific latent factor. The error bars represent standard deviations across five repeated experiments. The figure demonstrates that each latent factor is highly selective for a single behavior (e.g., one factor mainly explains ‘Levers’ movement while another explains ‘Jaw’ movement). This contrasts with the mixed selectivity observed in the original neural signals (Figure 1B), where individual neurons often responded to multiple behaviors.
read the caption
Figure 4: Behavior decoding results of the disentangled neural latent variables of the VIS-Right region. We observe that the decoding capability of each latent factor is specified to the corresponding behavior of interest, exhibiting a single-mode shape. In contrast, the original neural signals exhibit mixed selectivity to the behaviors, shown in Figure 1(B). Each experiment condition is repeated 5 times, with the mean represented by the bar plot and the standard deviations shown as error bars.
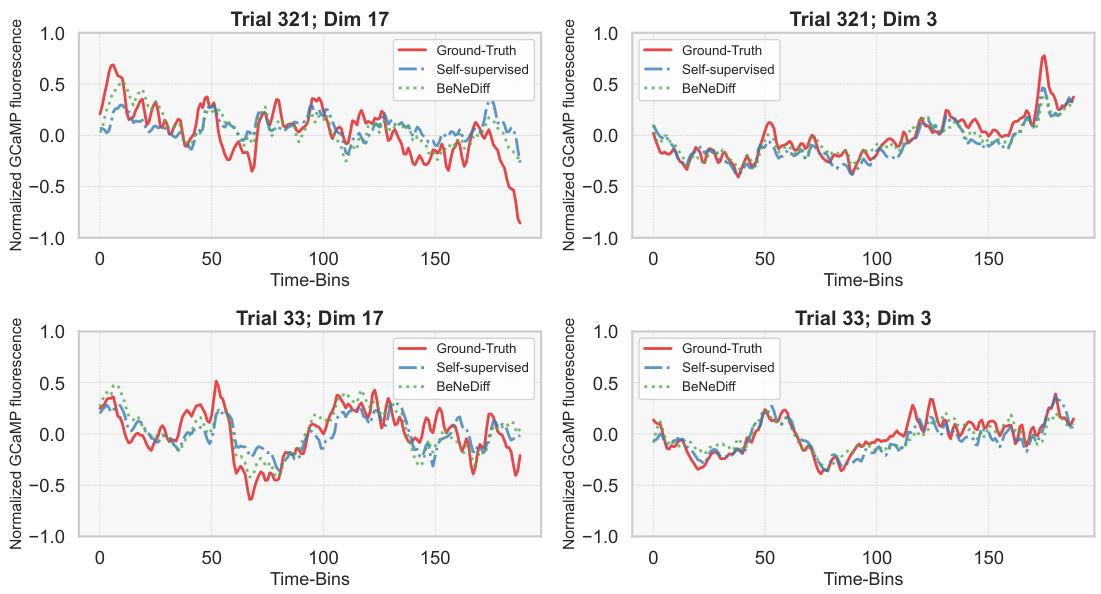
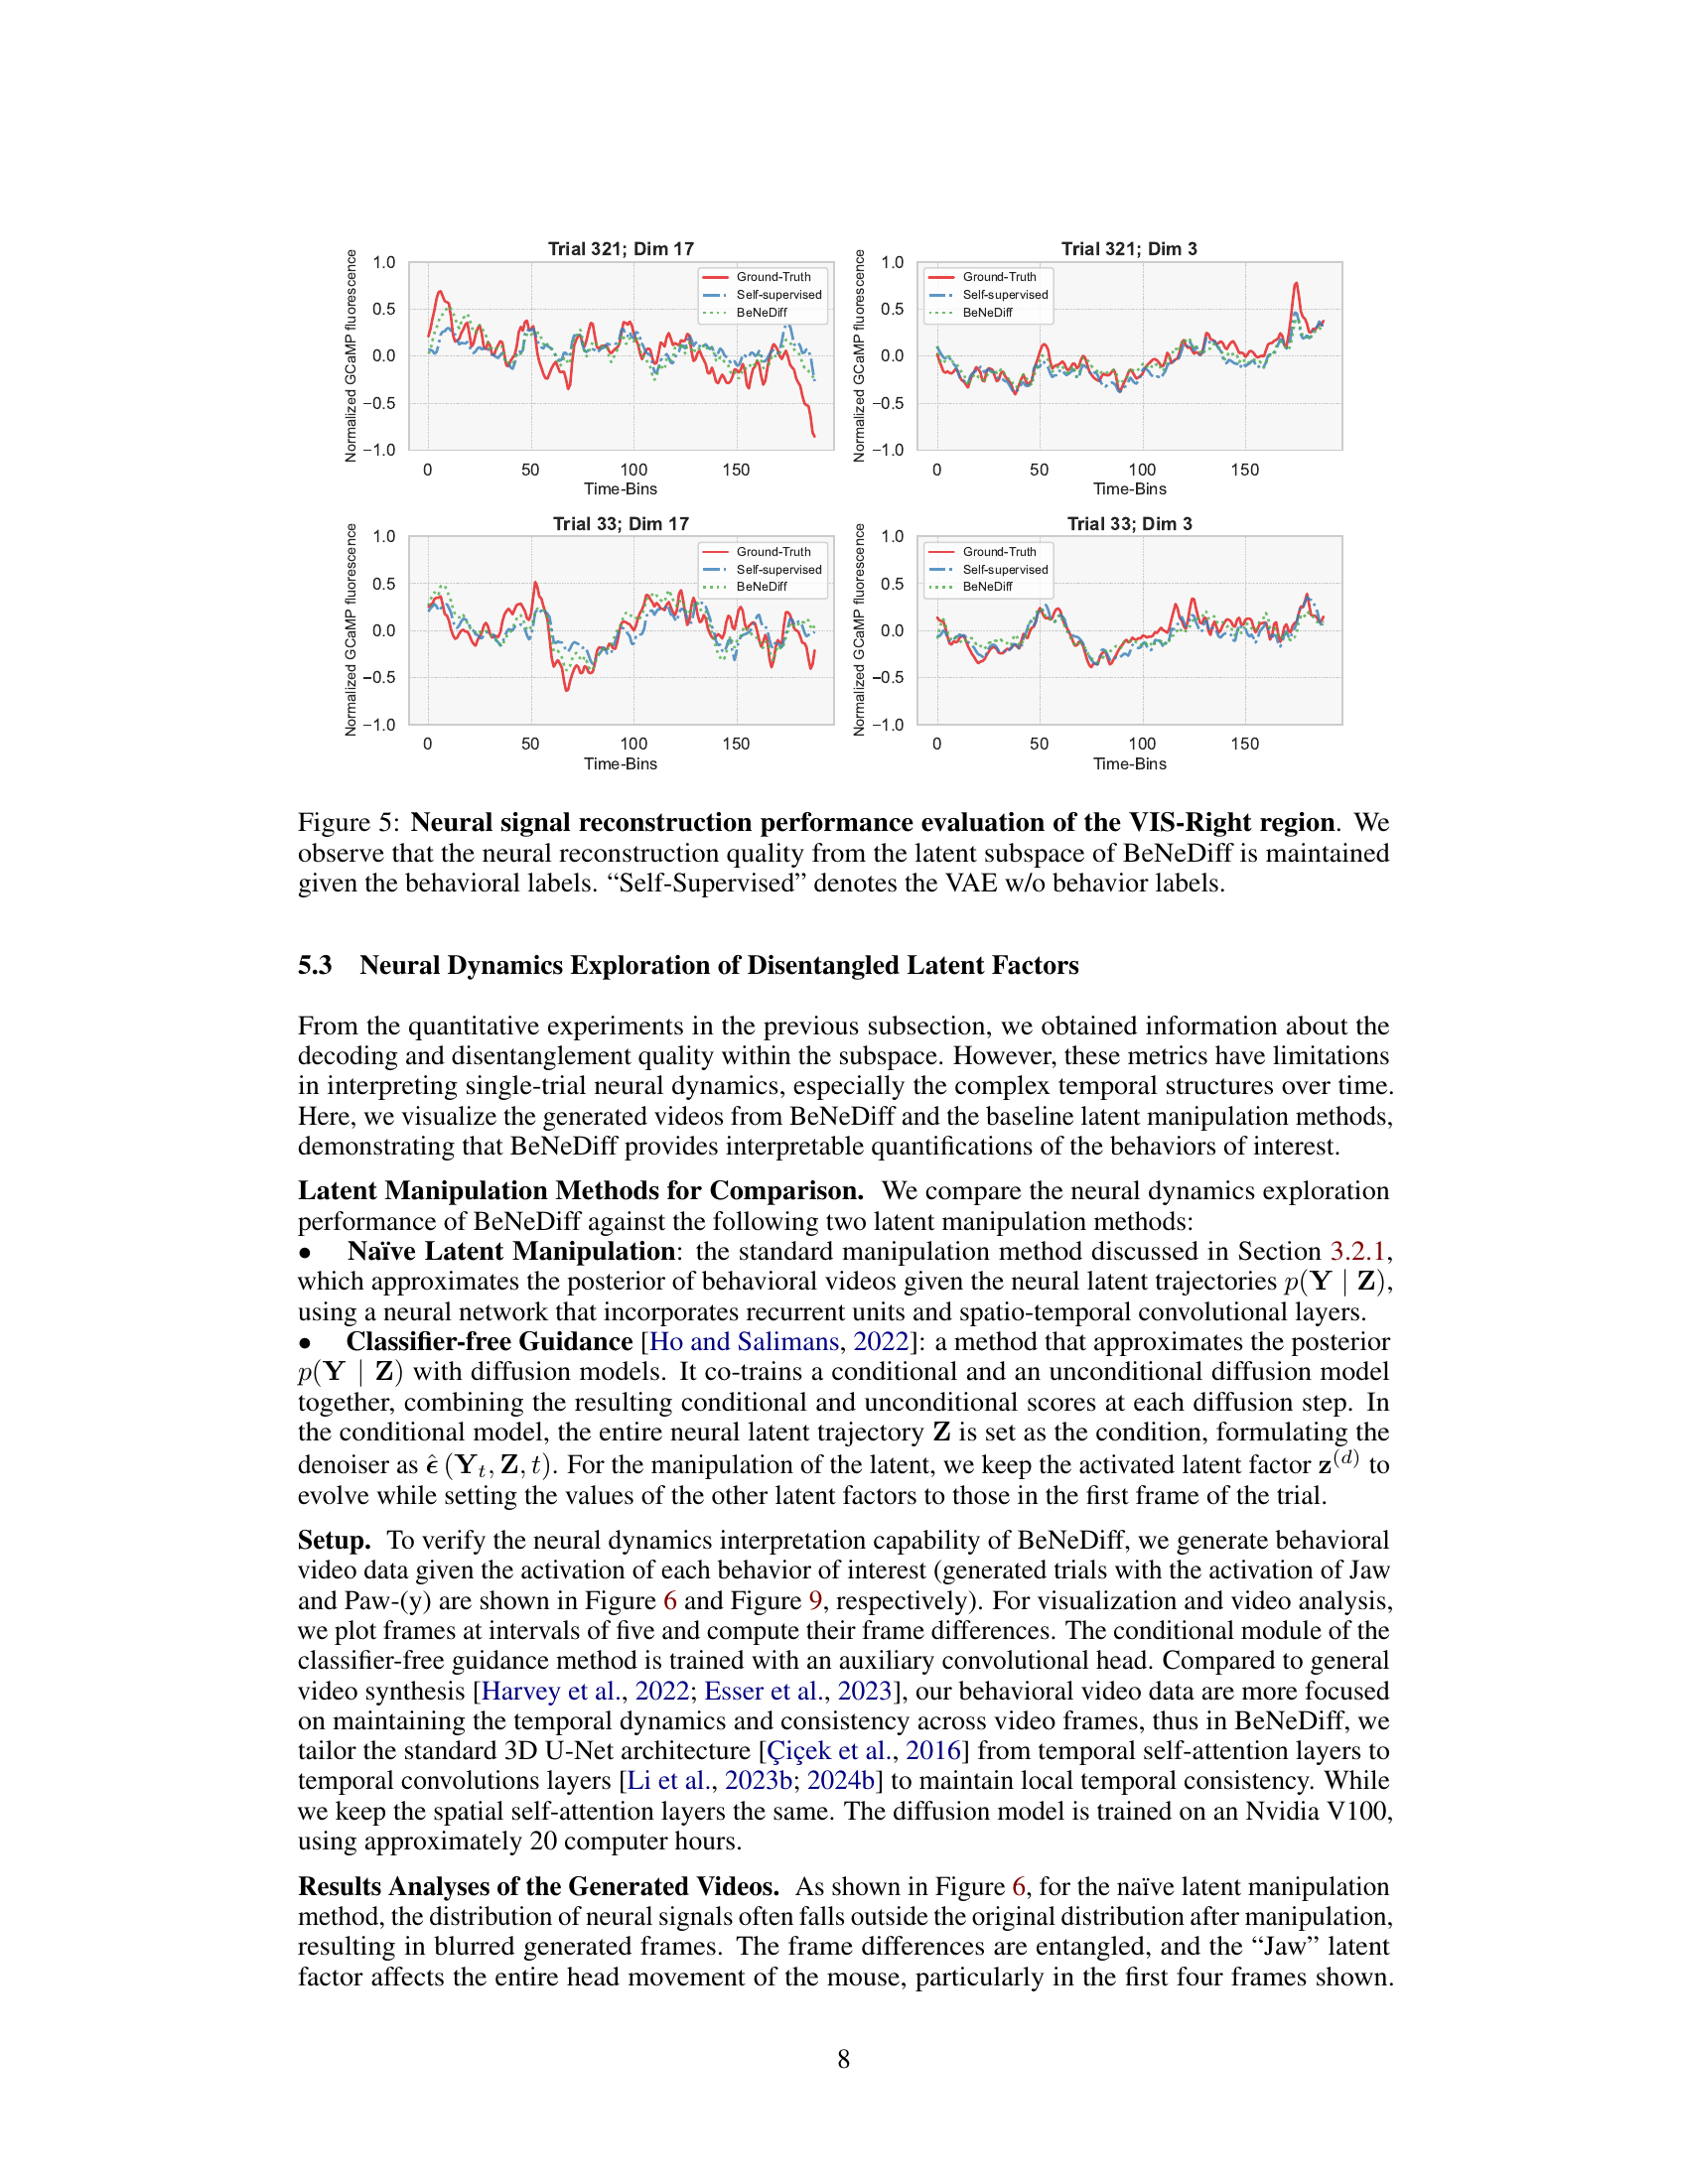
🔼 This figure displays the neural signal reconstruction performance of the VIS-Right region using different methods: ground truth, self-supervised learning (no behavioral labels), and BeNeDiff. It shows how well each method reconstructs the neural activity given the behavioral labels. The results demonstrate that BeNeDiff maintains good reconstruction quality even while incorporating behavioral information.
read the caption
Figure 5: Neural signal reconstruction performance evaluation of the VIS-Right region. We observe that the neural reconstruction quality from the latent subspace of BeNeDiff is maintained given the behavioral labels. “Self-Supervised” denotes the VAE w/o behavior labels.
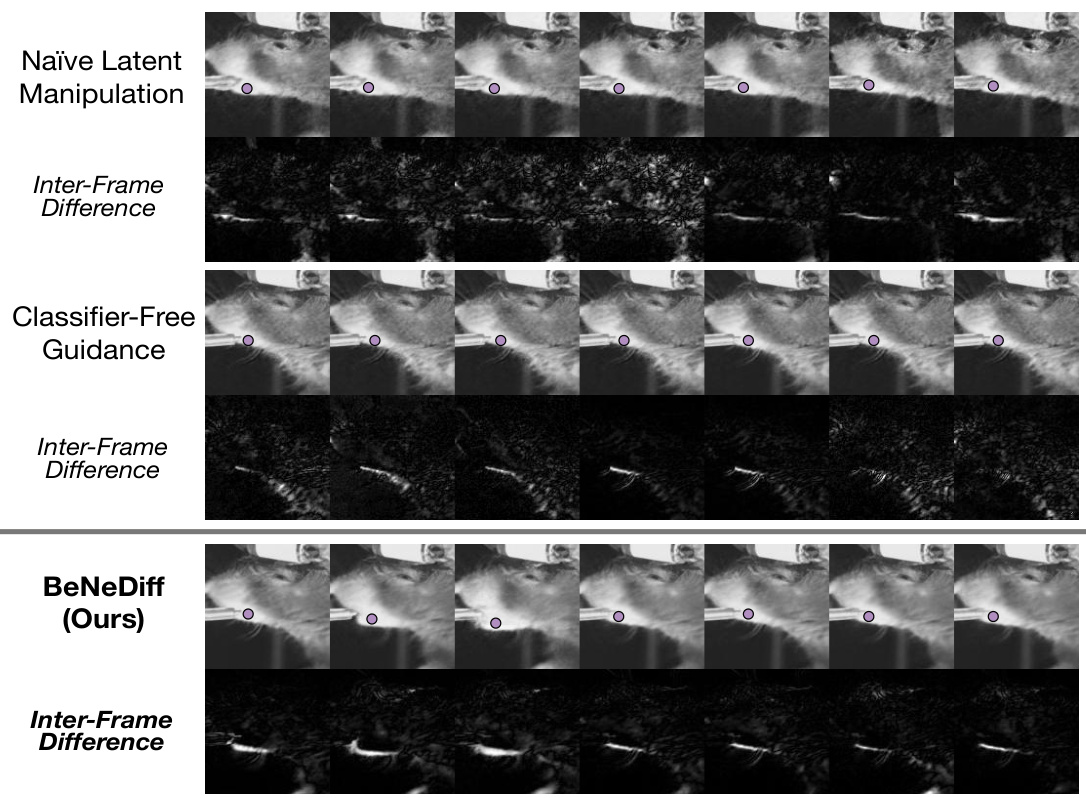
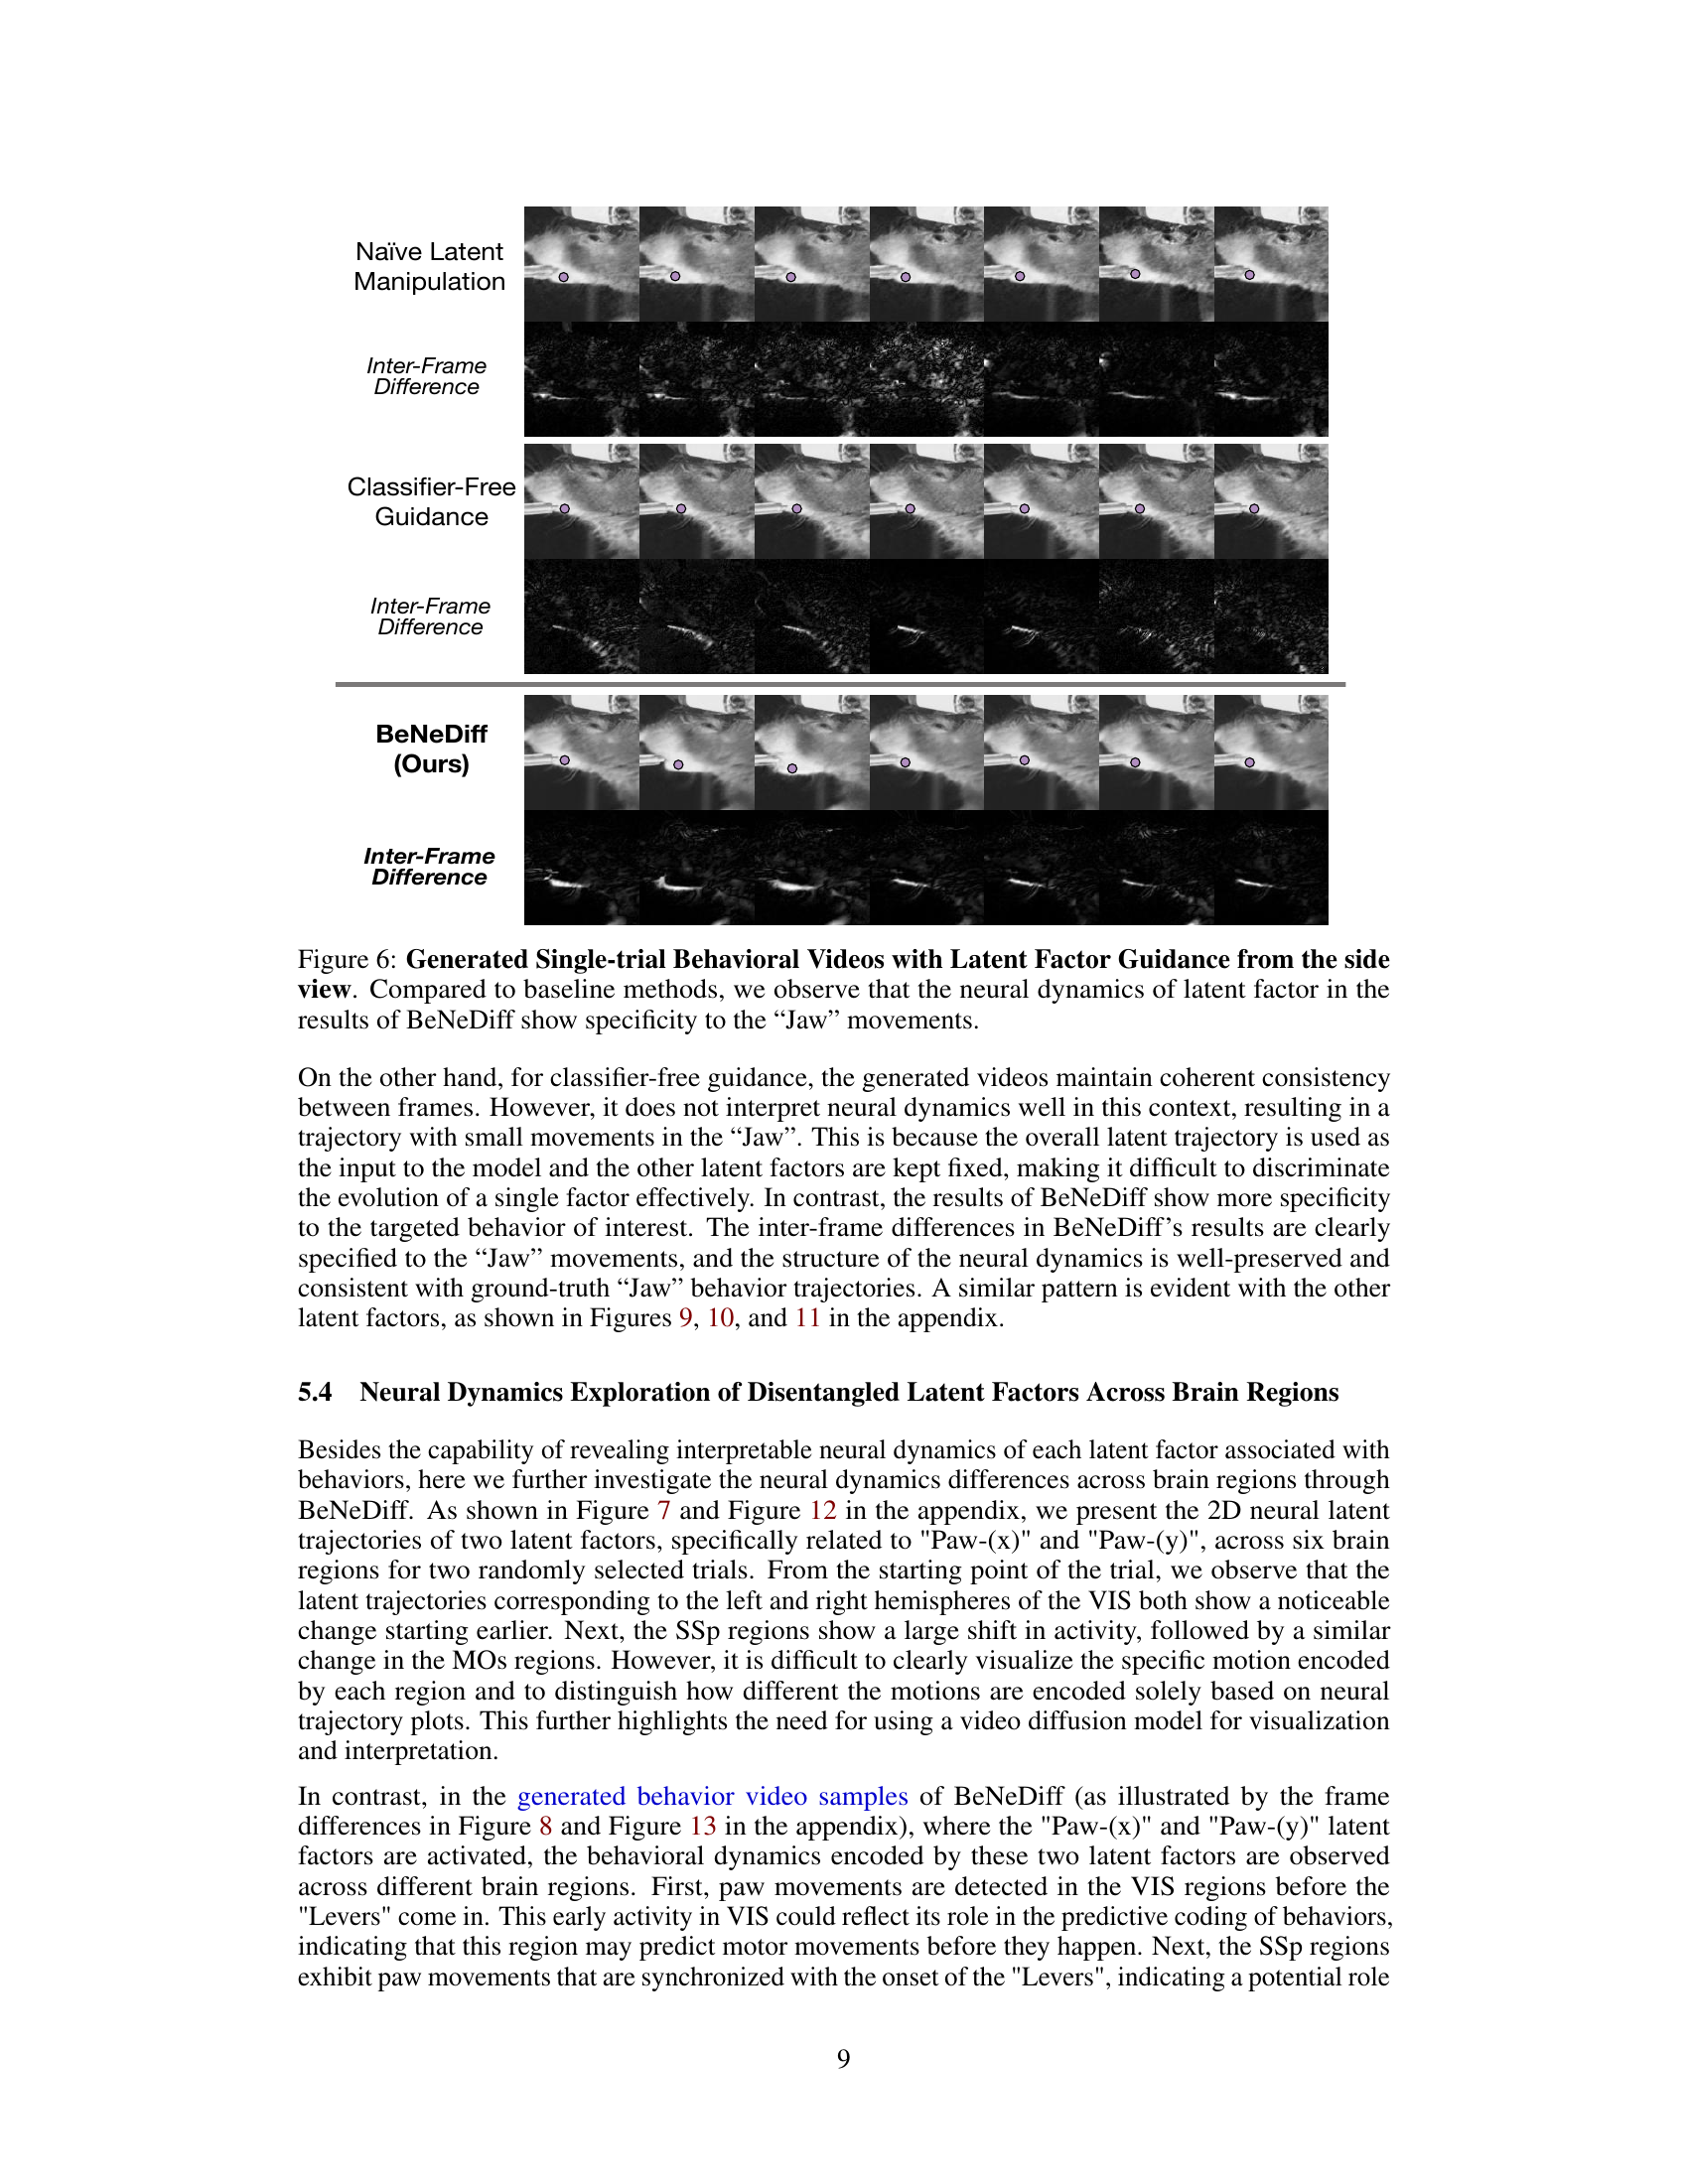
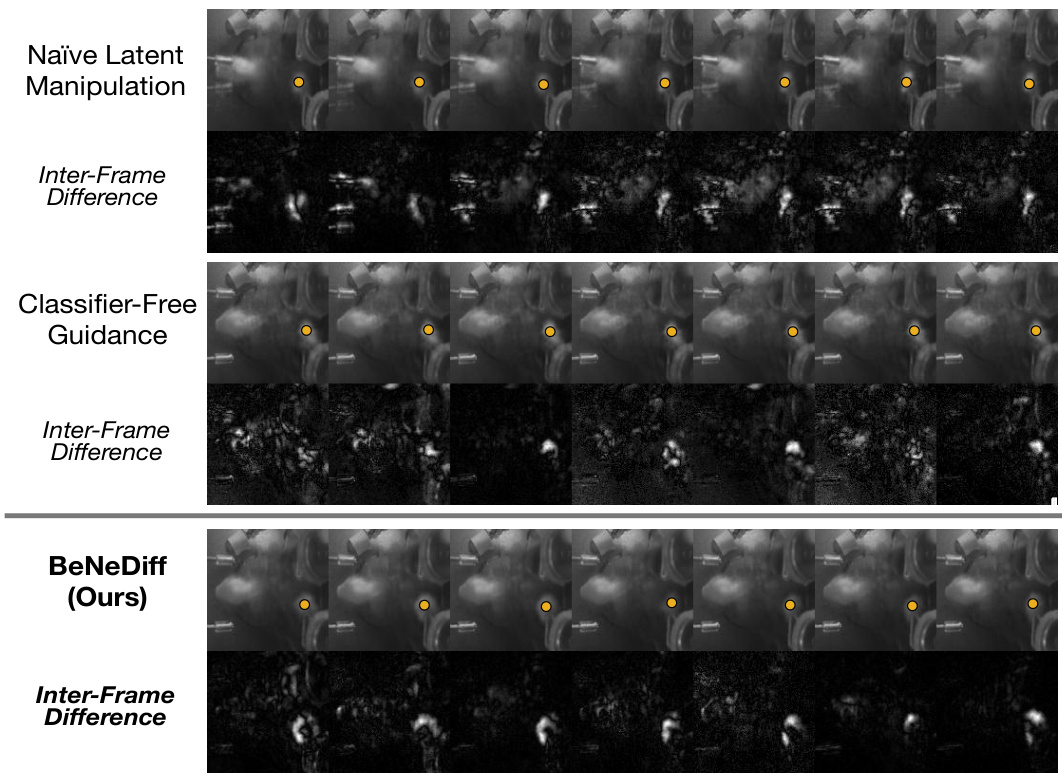
🔼 This figure compares the results of three different methods for generating single-trial behavioral videos using latent factor guidance: Naïve Latent Manipulation, Classifier-Free Guidance, and BeNeDiff (the authors’ proposed method). The top row shows the generated video frames for each method. The second row displays the inter-frame difference, highlighting the changes in the video frames over time. The figure demonstrates that BeNeDiff produces videos with neural dynamics that are more specific to the ‘Jaw’ movements compared to the other methods. The inter-frame difference for BeNeDiff shows a more focused and consistent pattern of changes related to the jaw movement than the other two methods.
read the caption
Figure 6: Generated Single-trial Behavioral Videos with Latent Factor Guidance from the side view. Compared to baseline methods, we observe that the neural dynamics of latent factor in the results of BeNeDiff show specificity to the “Jaw” movements.
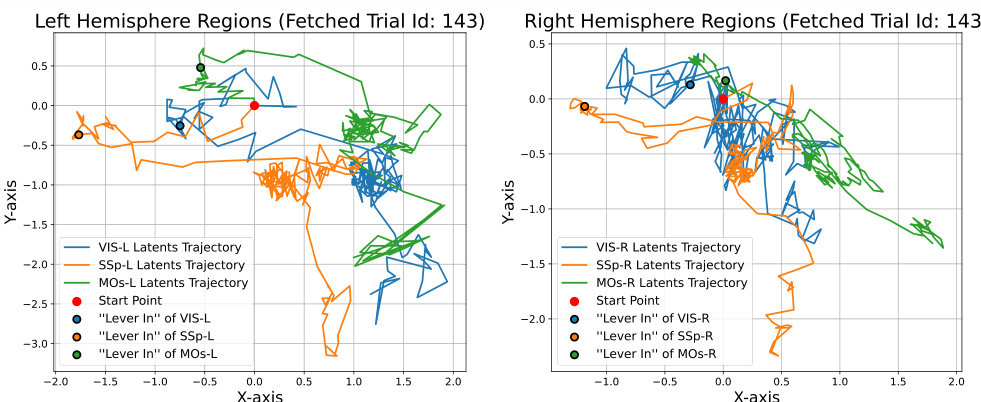
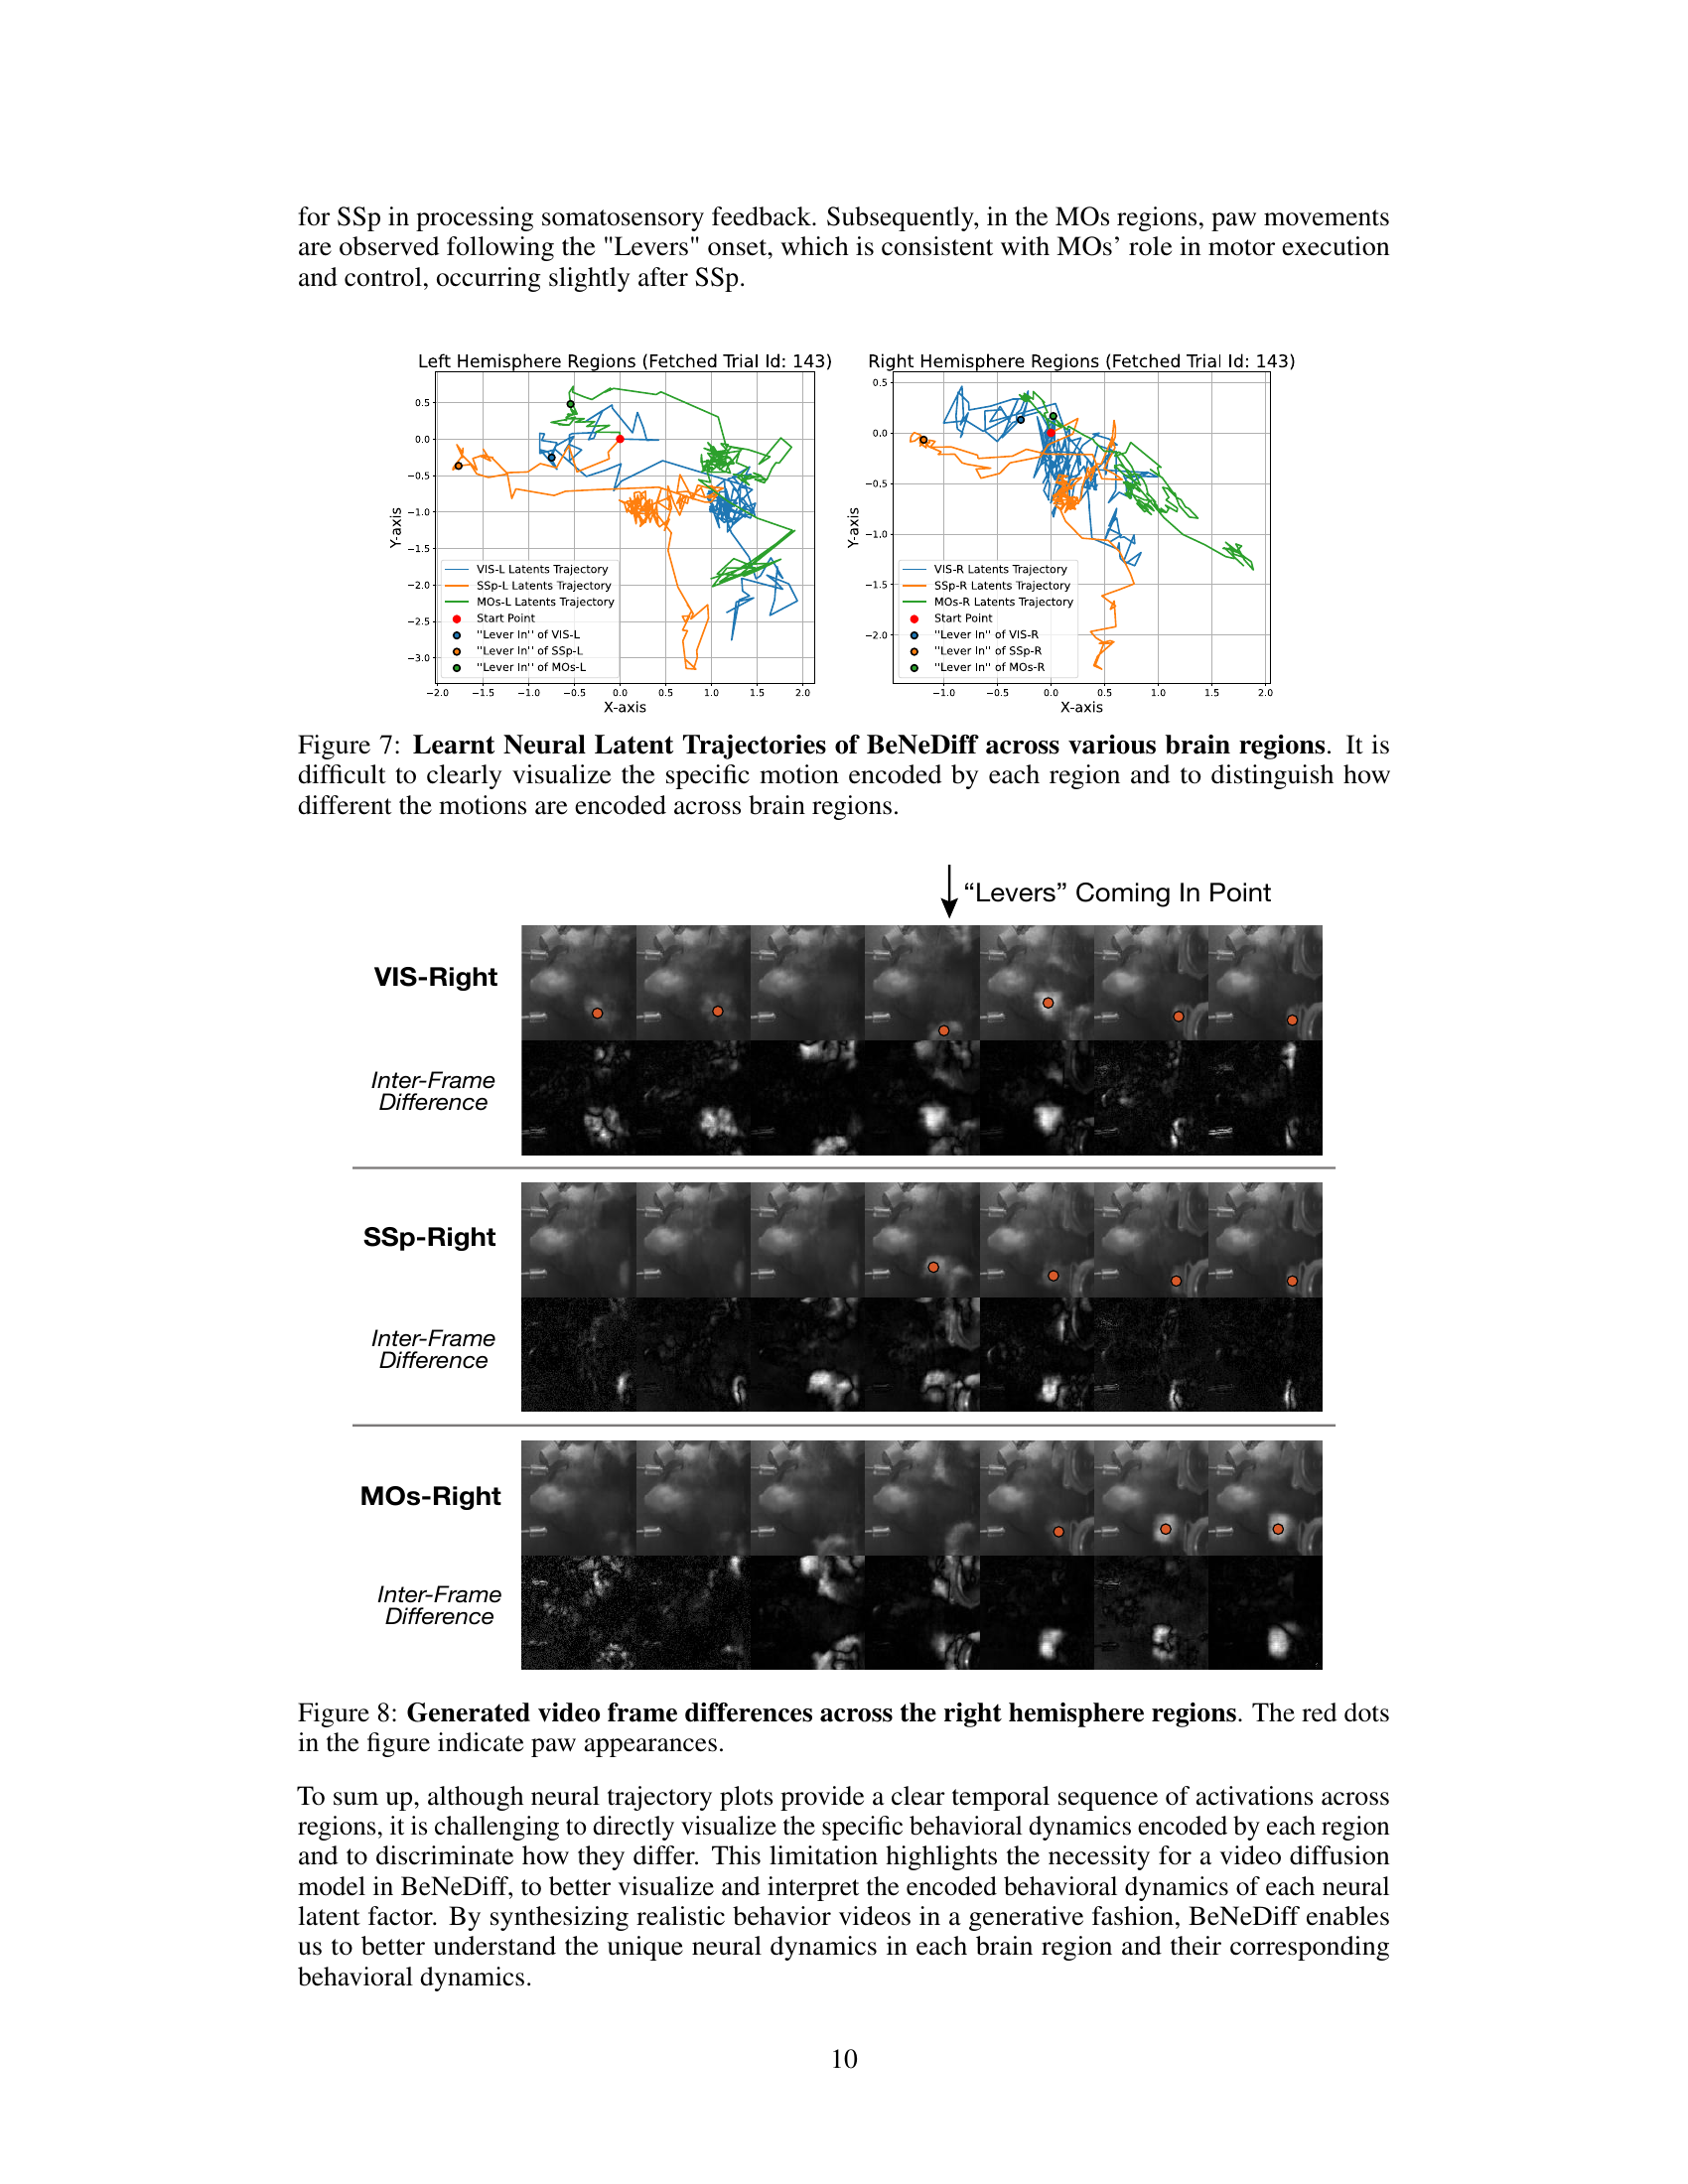
🔼 This figure displays the neural latent trajectories generated by the BeNeDiff model across multiple brain regions (VIS, SSp, MOs) in both left and right hemispheres. The trajectories show the neural activity changes over time for a single trial, focusing on the period around the ‘Lever In’ event. The plot visually represents the latent space dynamics in each brain region and highlights the complexity of neural activity patterns across multiple brain areas during a decision-making task. It emphasizes the challenge of interpreting neural dynamics without a generative method for visualization, as the trajectories alone are difficult to interpret in terms of specific motor behaviors.
read the caption
Figure 7: Learnt Neural Latent Trajectories of BeNeDiff across various brain regions. It is difficult to clearly visualize the specific motion encoded by each region and to distinguish how different the motions are encoded across brain regions.
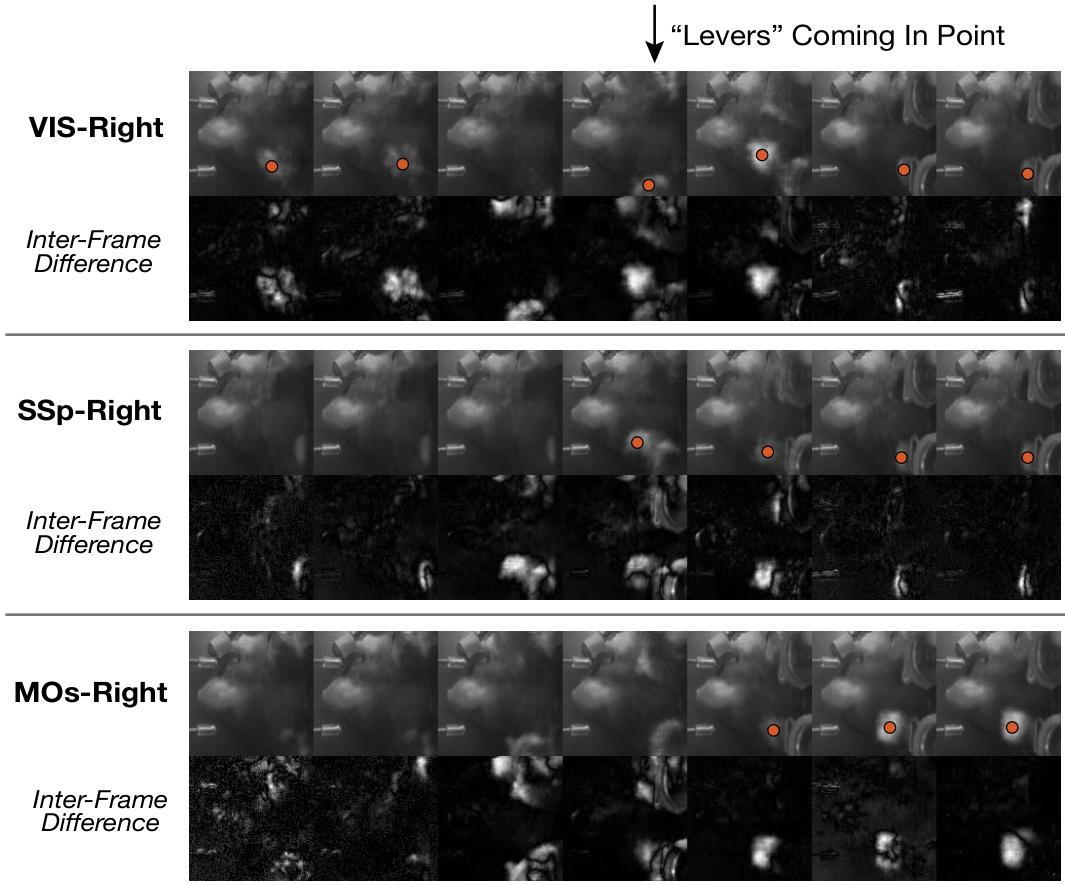
🔼 This figure visualizes the frame differences across three brain regions (VIS-Right, SSp-Right, and MOs-Right) of the right hemisphere when the ‘Levers’ are coming into the point. The red dots highlight paw movements. The inter-frame differences (bottom row of each section) show the changes in the video frames over time, allowing for a more detailed analysis of the temporal dynamics of paw movements across different brain areas. It demonstrates how the model captures the behavioral dynamics of paw movements and reflects it in the generated videos. The differences are most prominent in the VIS region, highlighting the visual cortex’s role in processing paw movement information, followed by the SSp and then the MOs, reflecting a sequential activation across regions.
read the caption
Figure 8: Generated video frame differences across the right hemisphere regions. The red dots in the figure indicate paw appearances.
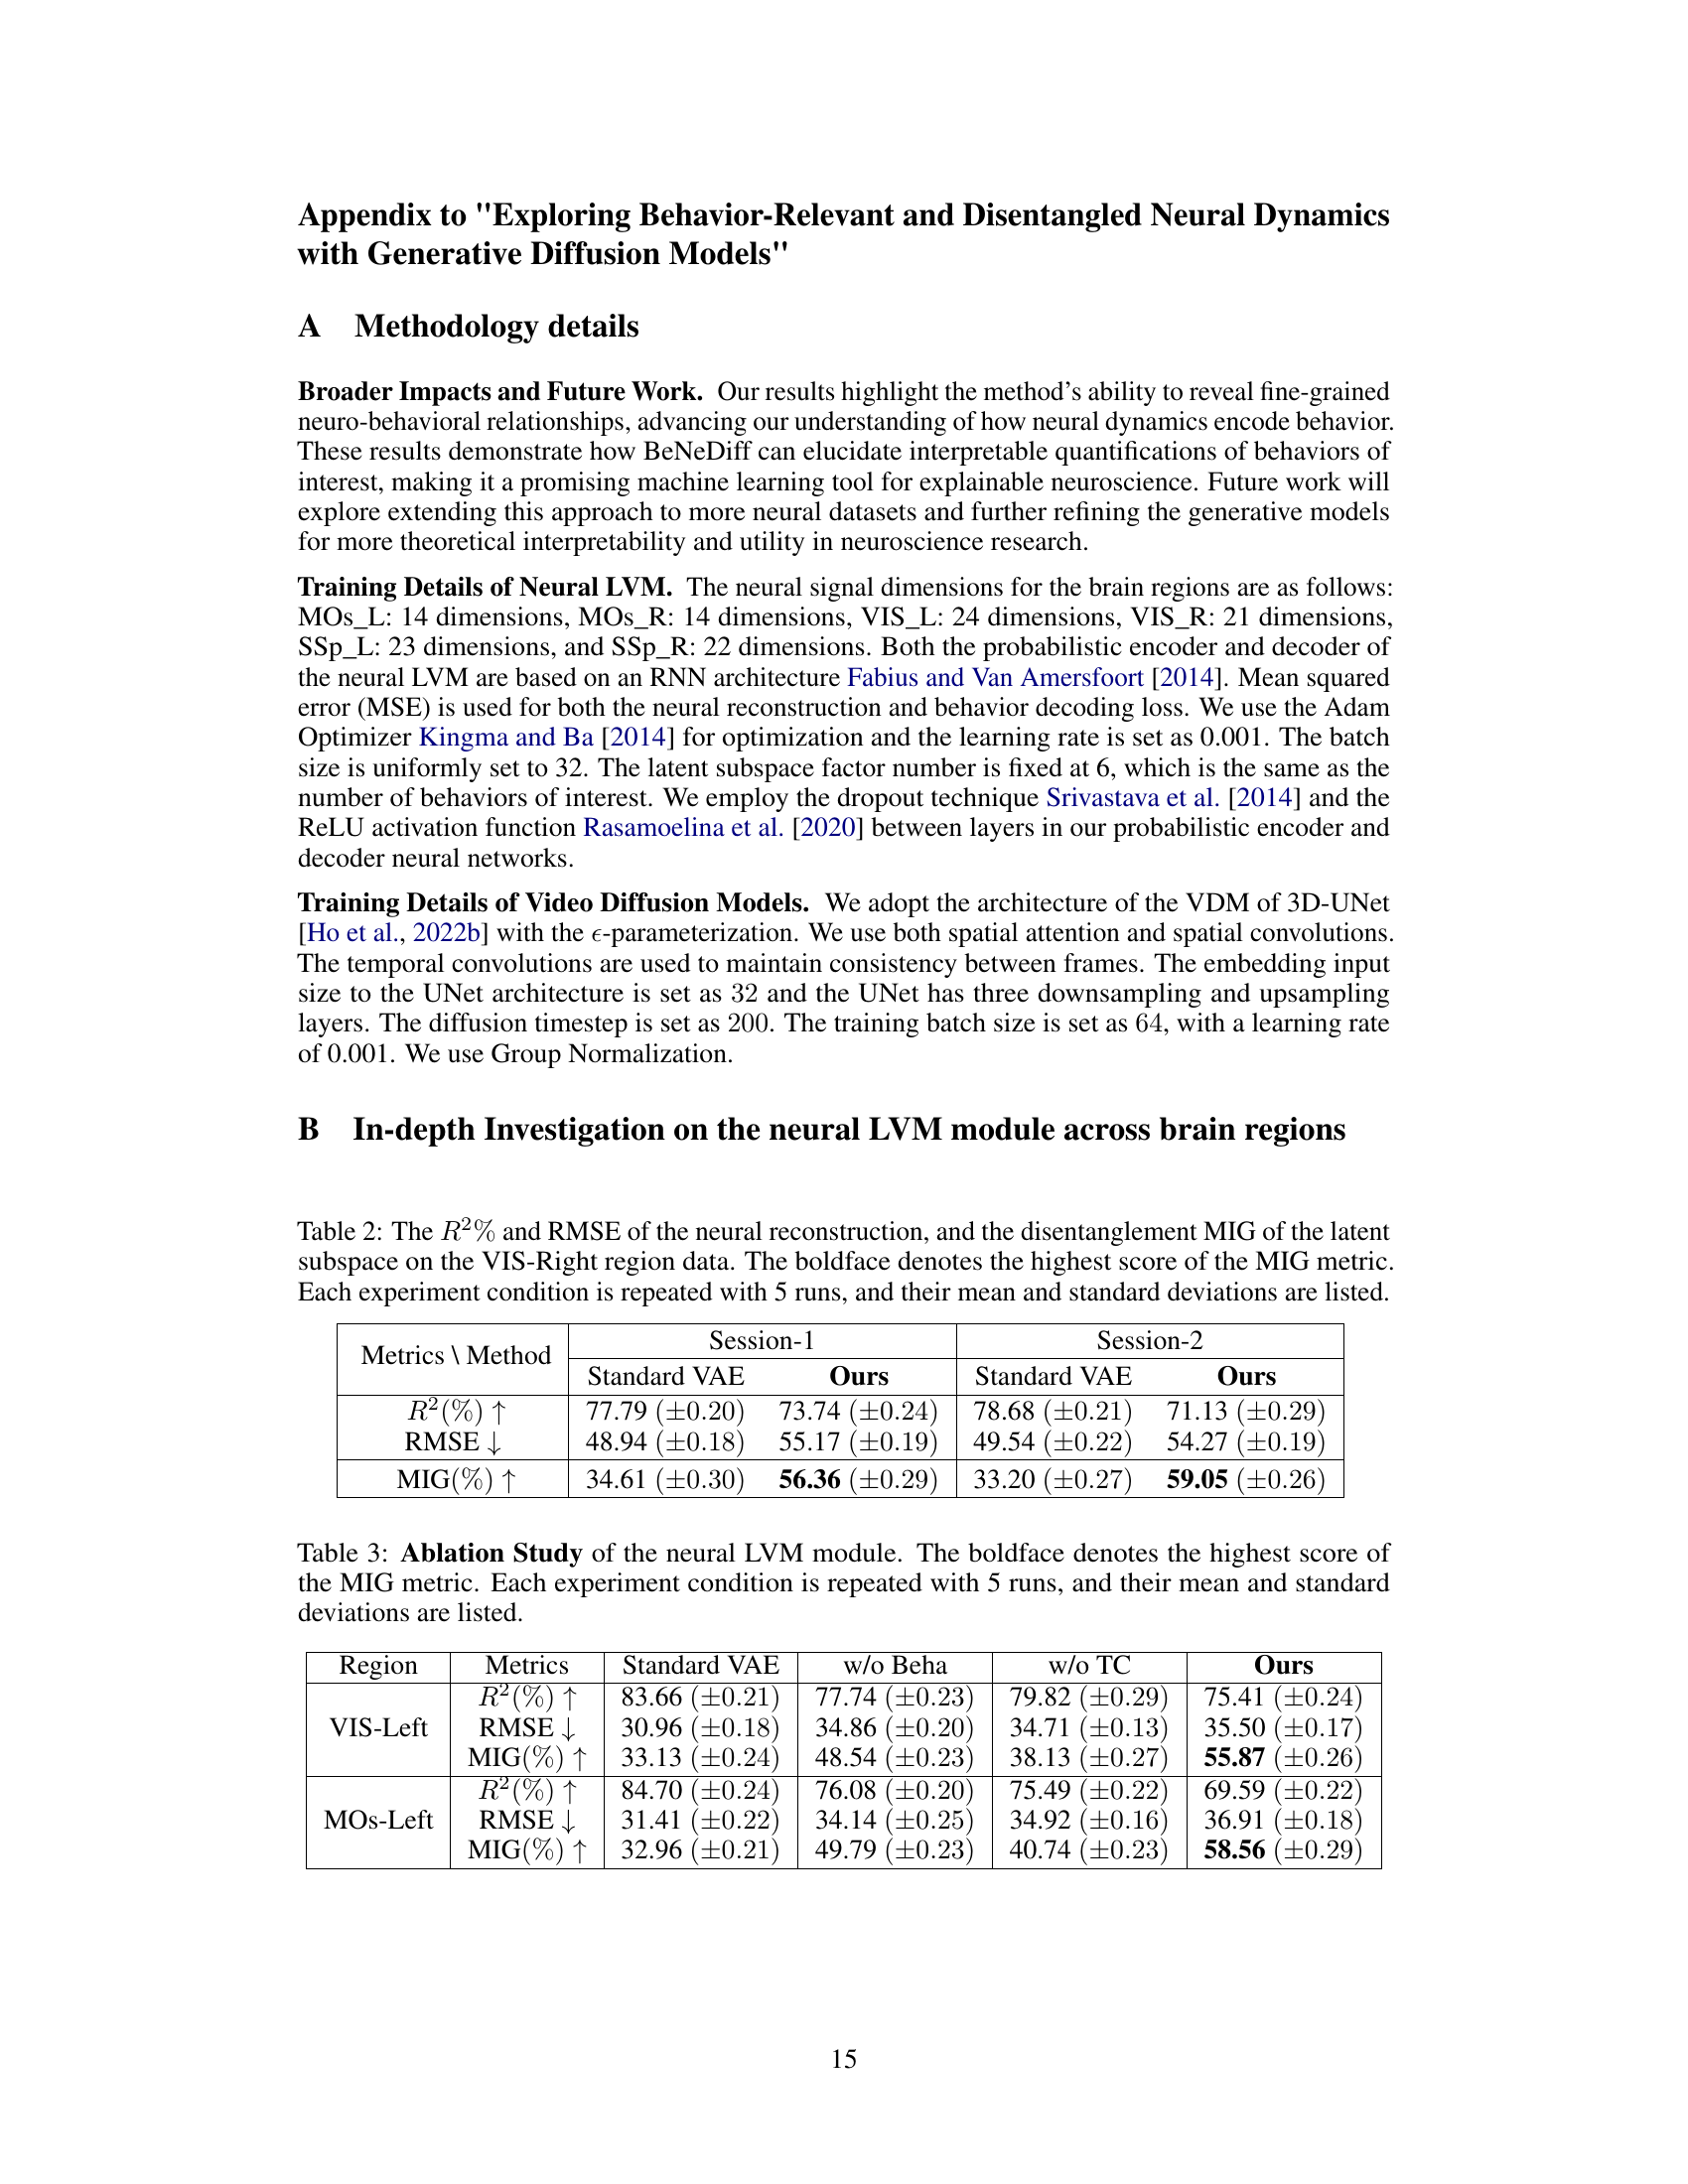
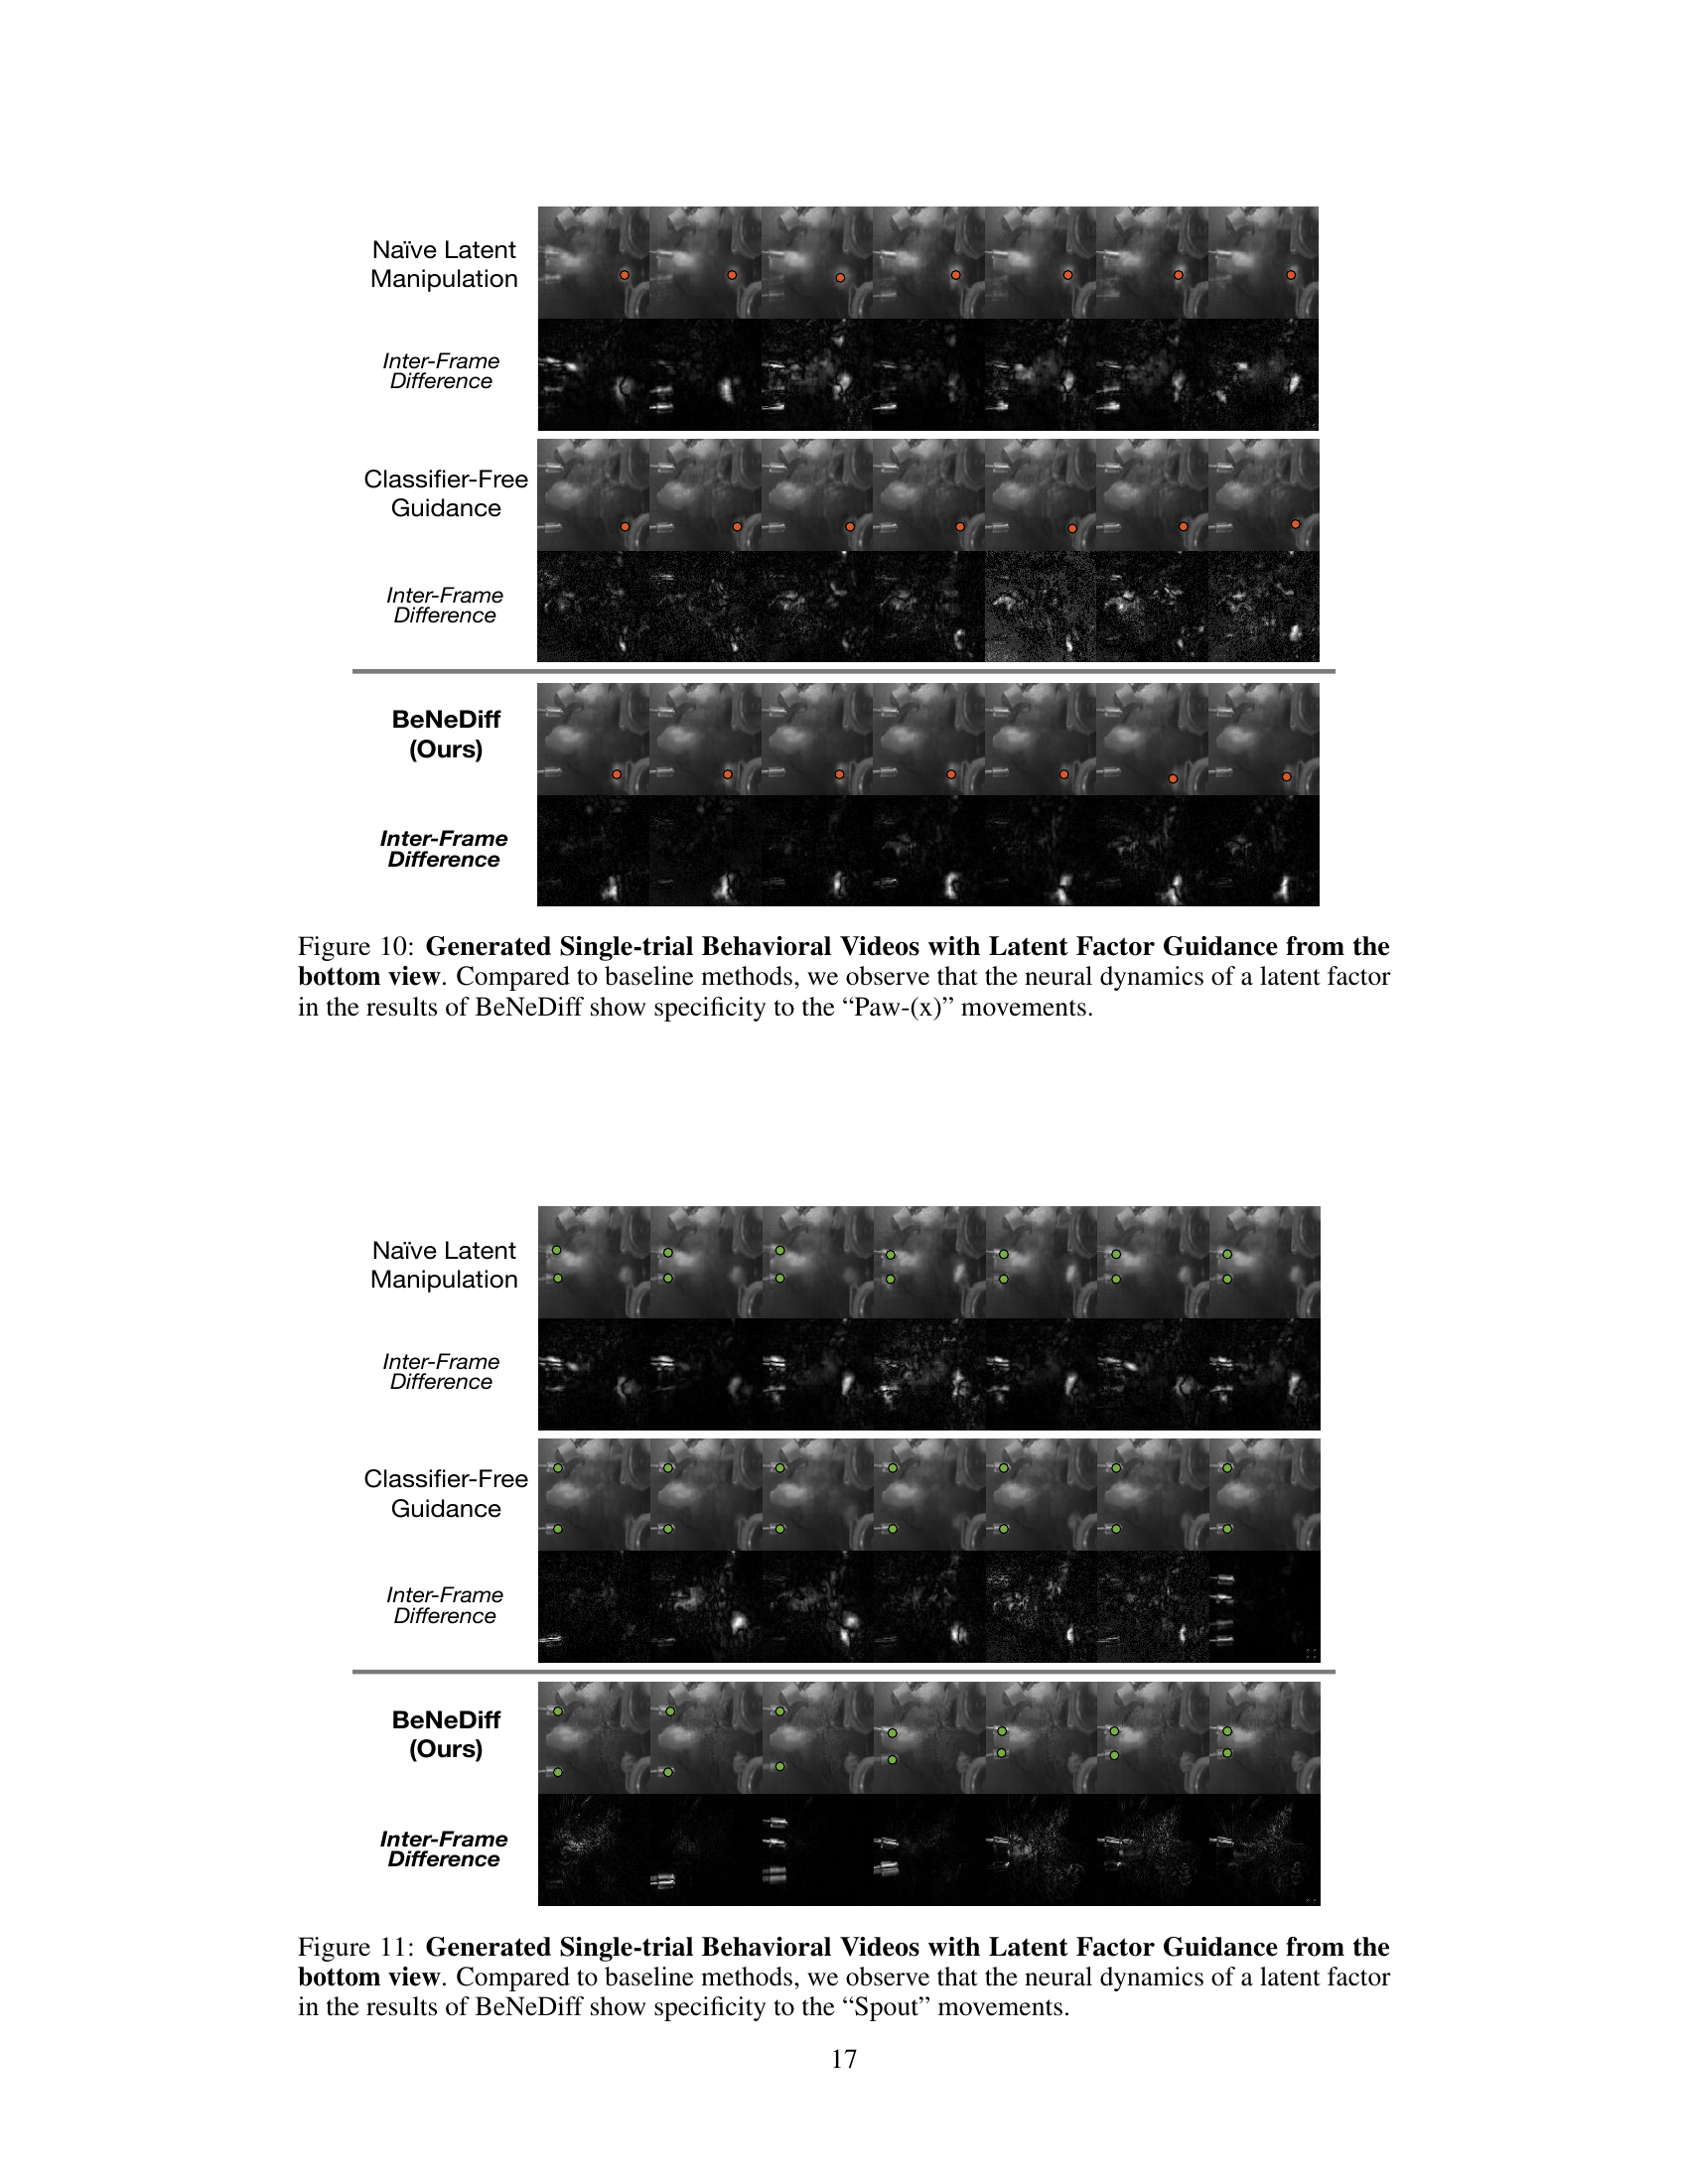
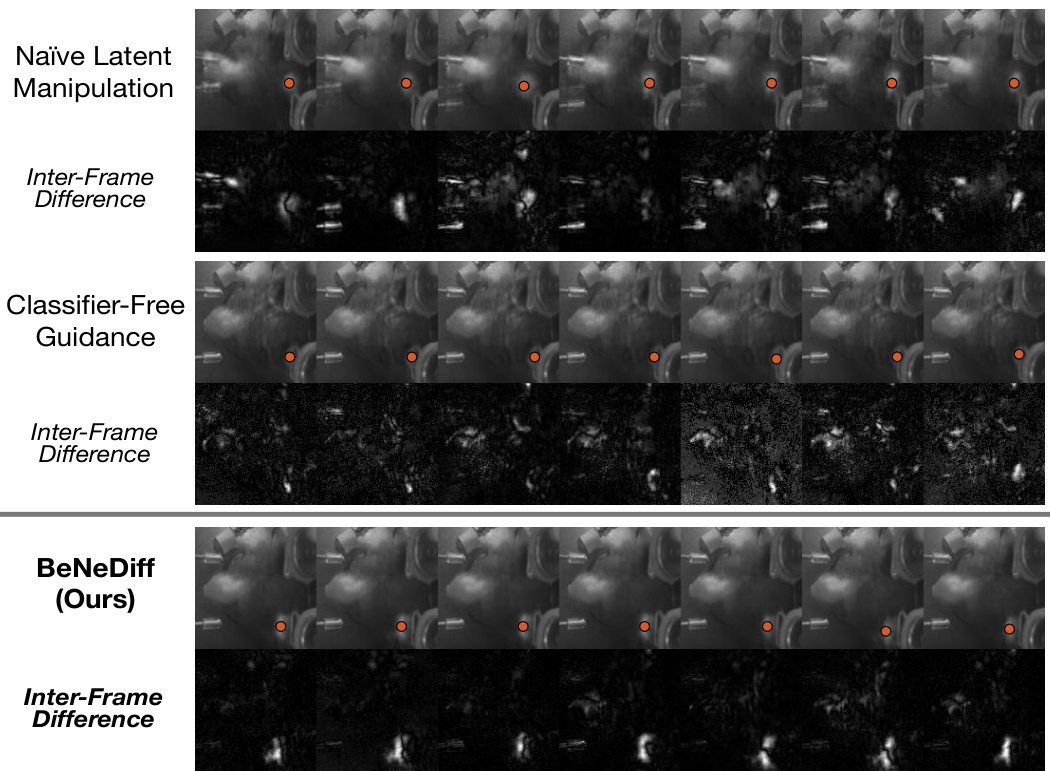
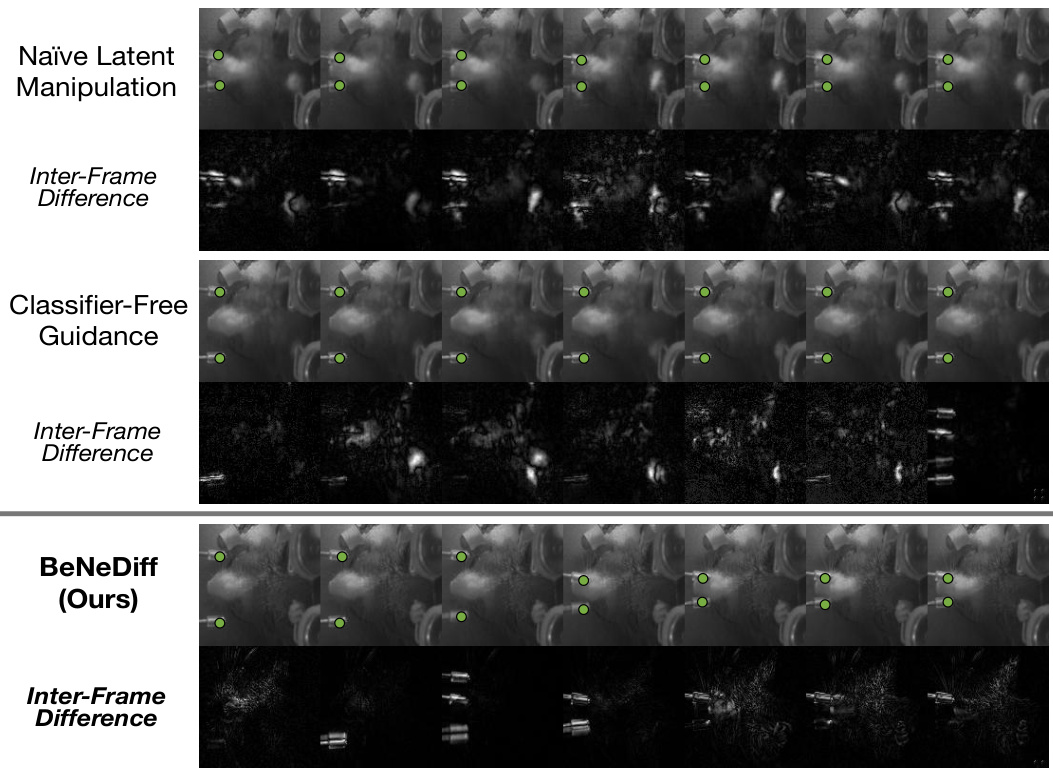
🔼 This figure compares the results of three different methods for generating single-trial behavioral videos using latent factor guidance. The three methods are Naïve Latent Manipulation, Classifier-Free Guidance, and BeNeDiff (the proposed method). For each method, the figure shows a series of video frames and their corresponding inter-frame differences. The results demonstrate that BeNeDiff produces more accurate and specific videos compared to the other two methods.
read the caption
Figure 9: Generated Single-trial Behavioral Videos with Latent Factor Guidance from the bottom view. Compared to baseline methods, we observe that the neural dynamics of a latent factor in the results of BeNeDiff show specificity to the “Paw-(y)” movements.
🔼 This figure compares the results of three different methods for generating single-trial behavioral videos, focusing on the ‘Jaw’ movements. The methods compared are Naïve Latent Manipulation, Classifier-Free Guidance, and BeNeDiff (the proposed method). The top row shows the generated video frames for each method. The bottom row shows the inter-frame differences. BeNeDiff is highlighted as producing more specific and consistent results reflecting ‘Jaw’ movements, demonstrating better interpretation of neural dynamics.
read the caption
Figure 6: Generated Single-trial Behavioral Videos with Latent Factor Guidance from the side view. Compared to baseline methods, we observe that the neural dynamics of latent factor in the results of BeNeDiff show specificity to the “Jaw” movements.
🔼 This figure compares the results of three different methods for generating single-trial behavioral videos using latent factor guidance: Naïve Latent Manipulation, Classifier-Free Guidance, and BeNeDiff (the authors’ method). The top row shows the generated videos for each method, while the bottom row displays the inter-frame differences. BeNeDiff’s results demonstrate a higher specificity to the ‘Jaw’ movements compared to the other two methods, as indicated by the clearer and more focused changes in the inter-frame differences.
read the caption
Figure 6: Generated Single-trial Behavioral Videos with Latent Factor Guidance from the side view. Compared to baseline methods, we observe that the neural dynamics of latent factor in the results of BeNeDiff show specificity to the “Jaw” movements.
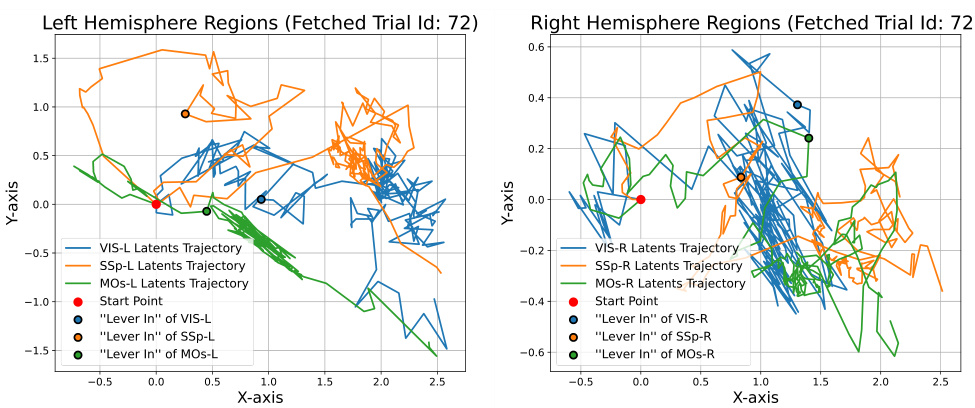
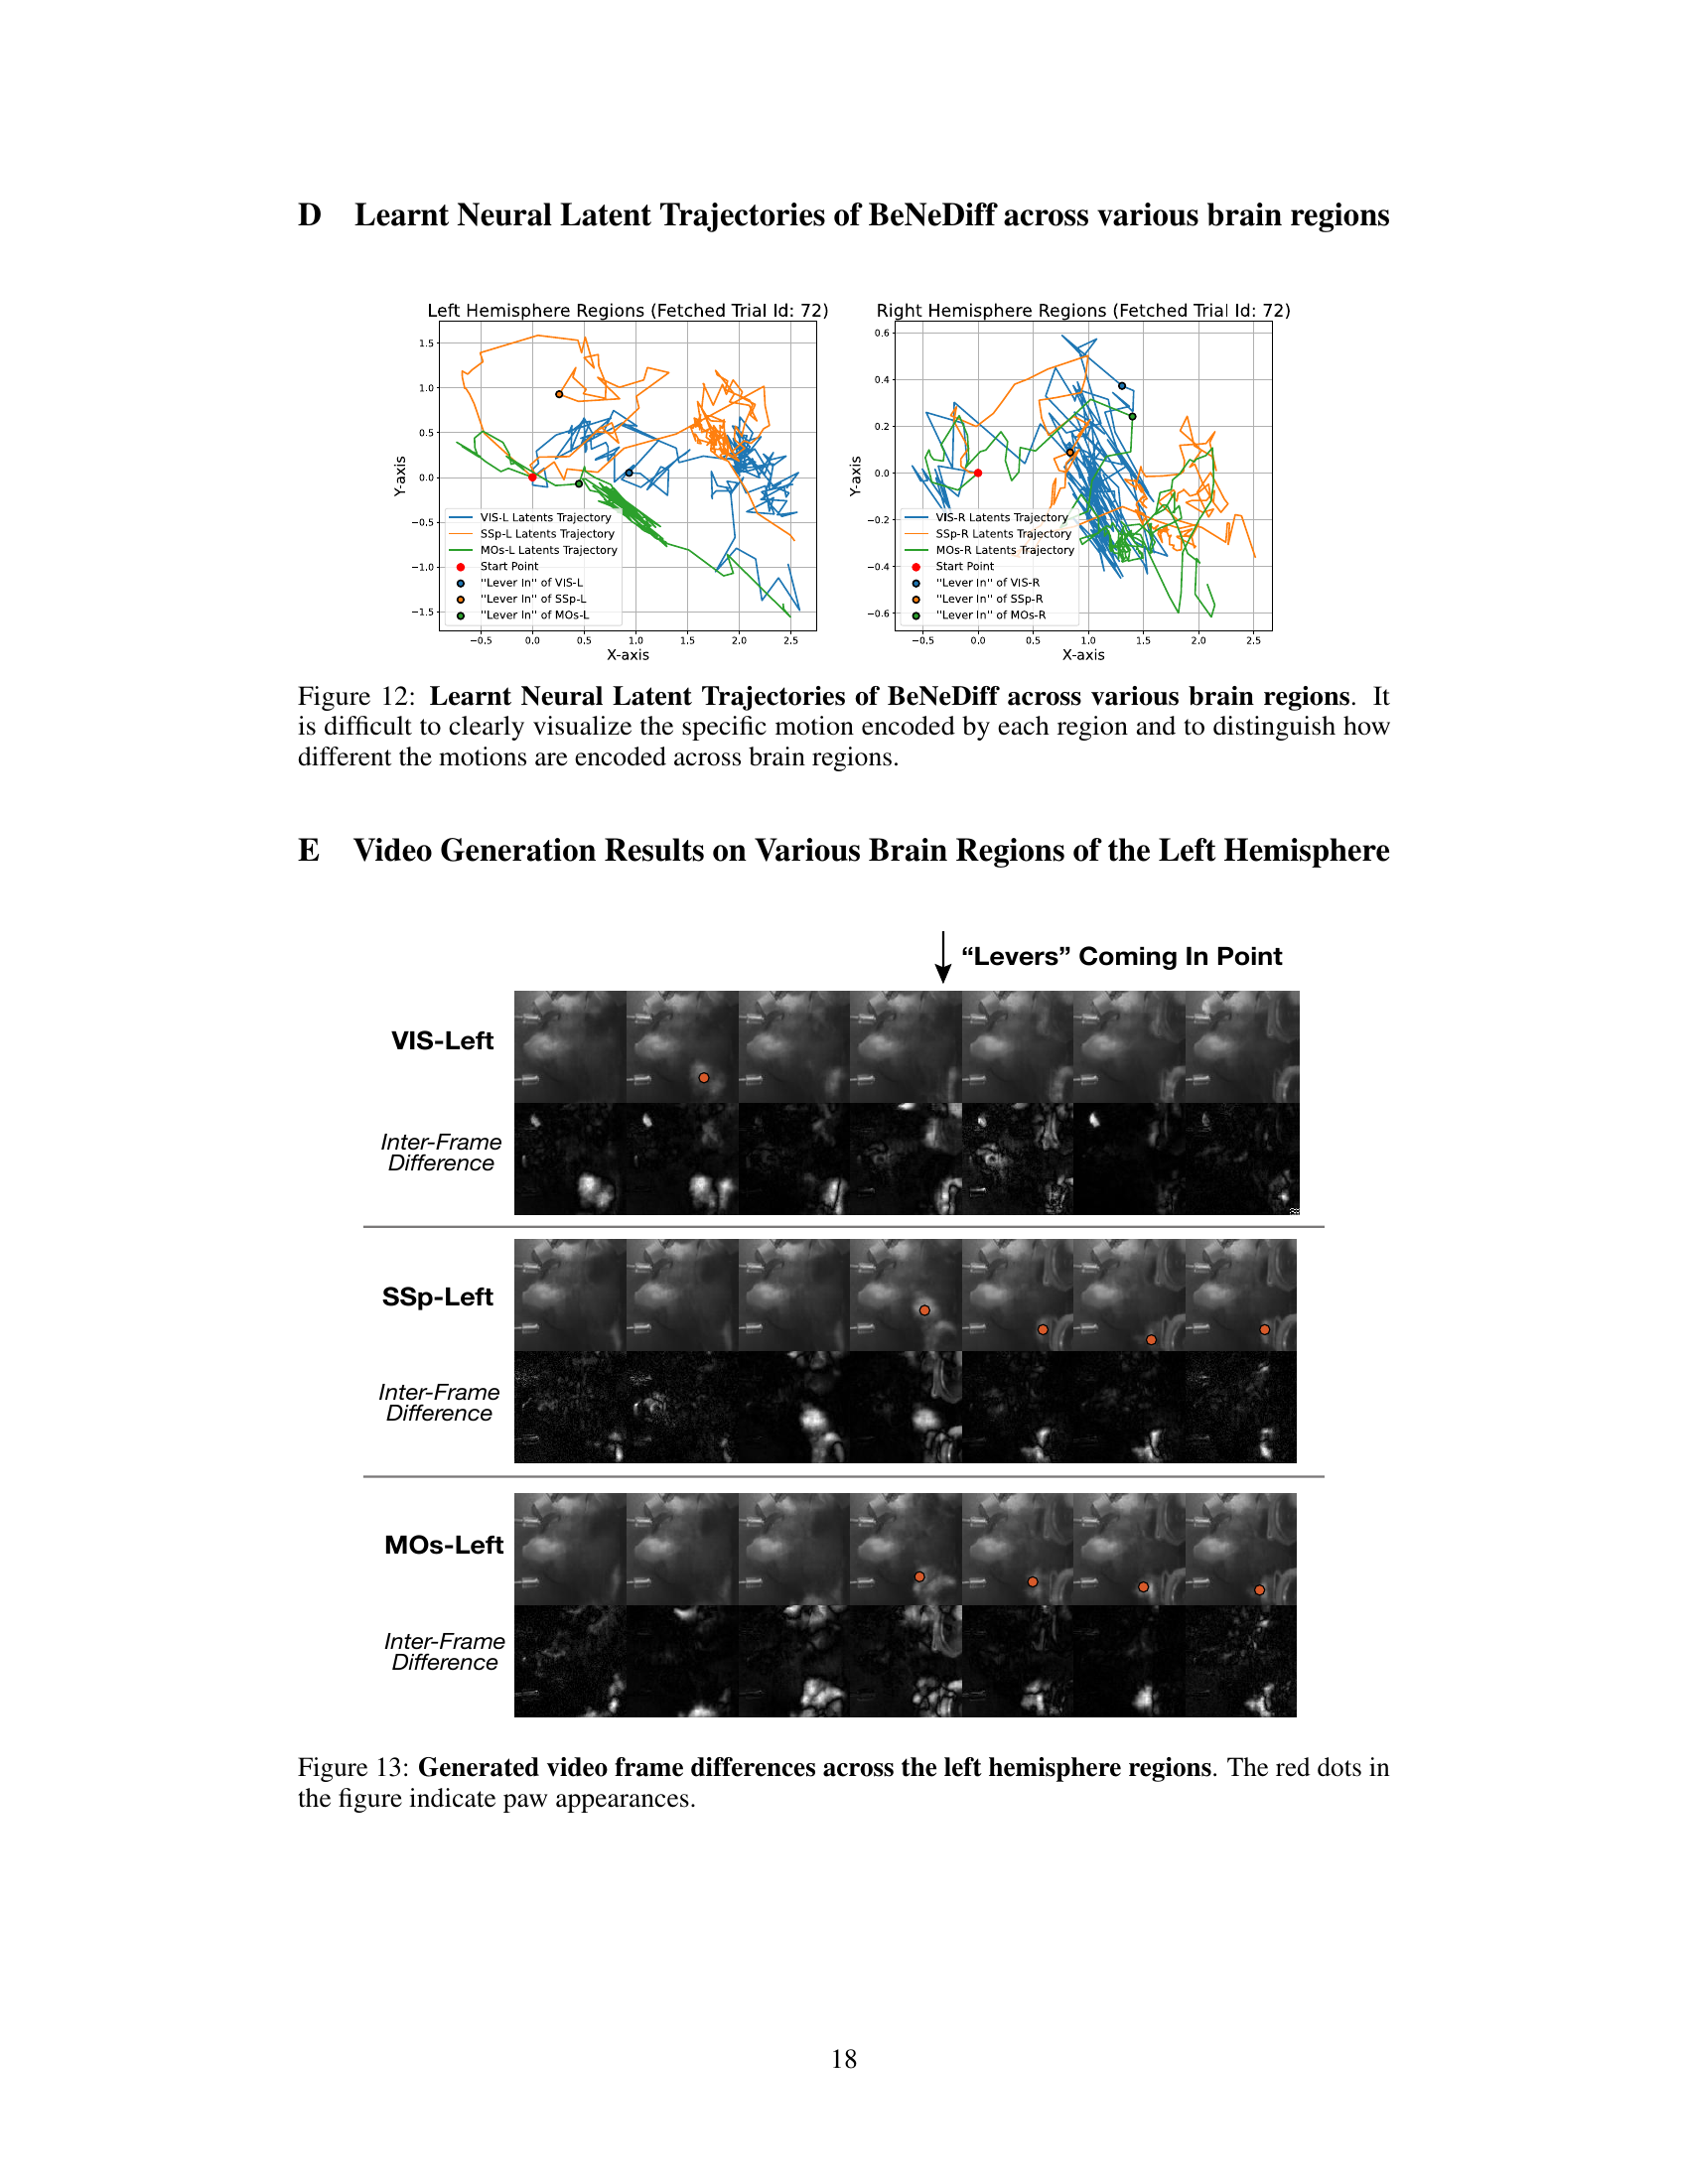
🔼 This figure shows the neural latent trajectories generated by BeNeDiff across different brain regions. The plots illustrate the trajectories in two dimensions (X and Y axis) for left and right hemisphere regions. It highlights the challenge of visually interpreting the specific motion encoded by each brain region and how these motions might differ between regions solely based on the trajectory plots. This motivates the use of video generation to visualize and better understand the neural dynamics.
read the caption
Figure 12: Learnt Neural Latent Trajectories of BeNeDiff across various brain regions. It is difficult to clearly visualize the specific motion encoded by each region and to distinguish how different the motions are encoded across brain regions.
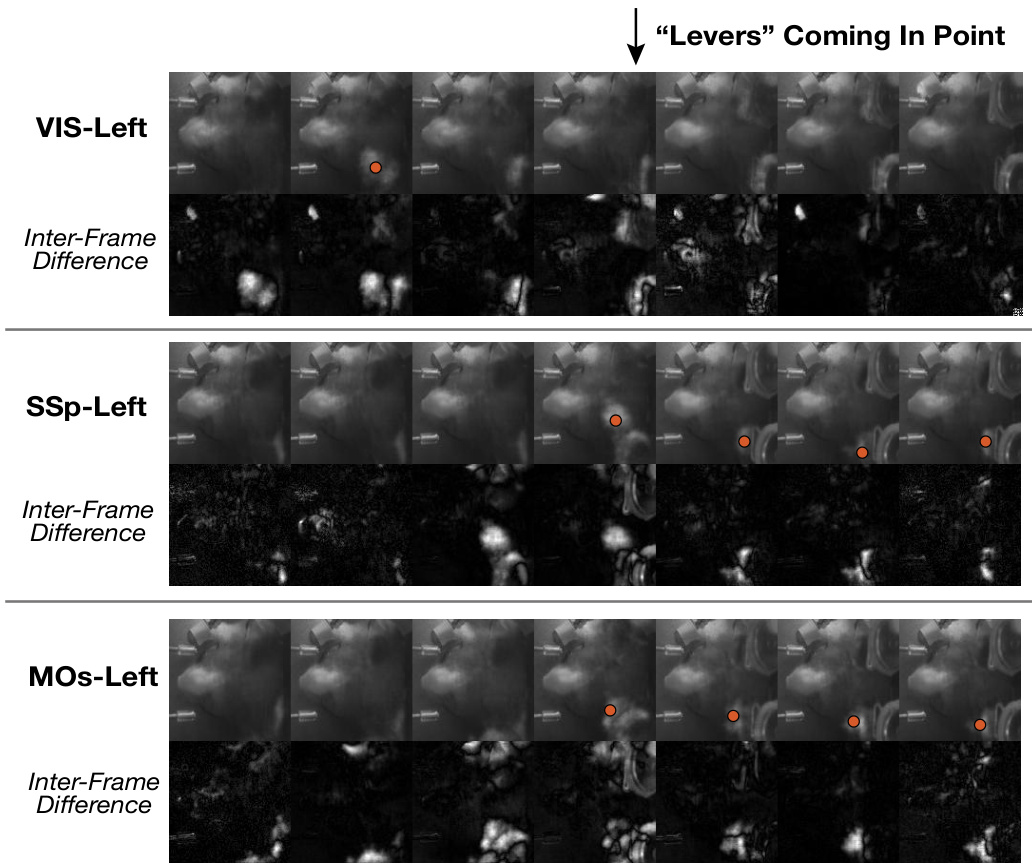
🔼 This figure shows the generated video frame differences across three brain regions in the left hemisphere (VIS-Left, SSp-Left, and MOs-Left) during a ‘Levers Coming In Point’ event. The video frames are generated using BeNeDiff (the proposed model), highlighting differences in the temporal dynamics of paw movements across the different cortical areas. Red dots indicate the paw appearances in the frames. The inter-frame differences help to visualize the changes in the behavior video over time more clearly, showcasing the temporal resolution of the model’s output.
read the caption
Figure 13: Generated video frame differences across the left hemisphere regions. The red dots in the figure indicate paw appearances.
More on tables
🔼 This table presents a comparison of the neural latent variable model (LVM) performance on two brain regions (VIS-Left and MOs-Left) from Session 1 of the experiment. It compares the performance of BeNeDiff against three baseline methods: Semi-Supervised Learning (SSL), CEBRA, and pi-VAE. The metrics used for comparison include R-squared (R²), Root Mean Squared Error (RMSE), and Mutual Information Gap (MIG). Higher R² and MIG values indicate better performance, while lower RMSE indicates better performance. The boldface numbers indicate the best performance for each metric, highlighting BeNeDiff’s superior performance in terms of both disentanglement and reconstruction quality.
read the caption
Table 1: Baseline Comparison of the neural LVM on two brain regions of Session-1. The boldface denotes the highest score of the MIG metric. Each experiment condition is repeated with 5 runs, and their mean and standard deviations are listed.
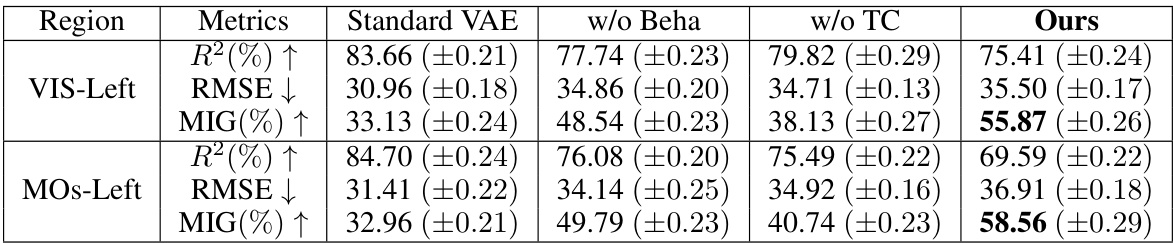
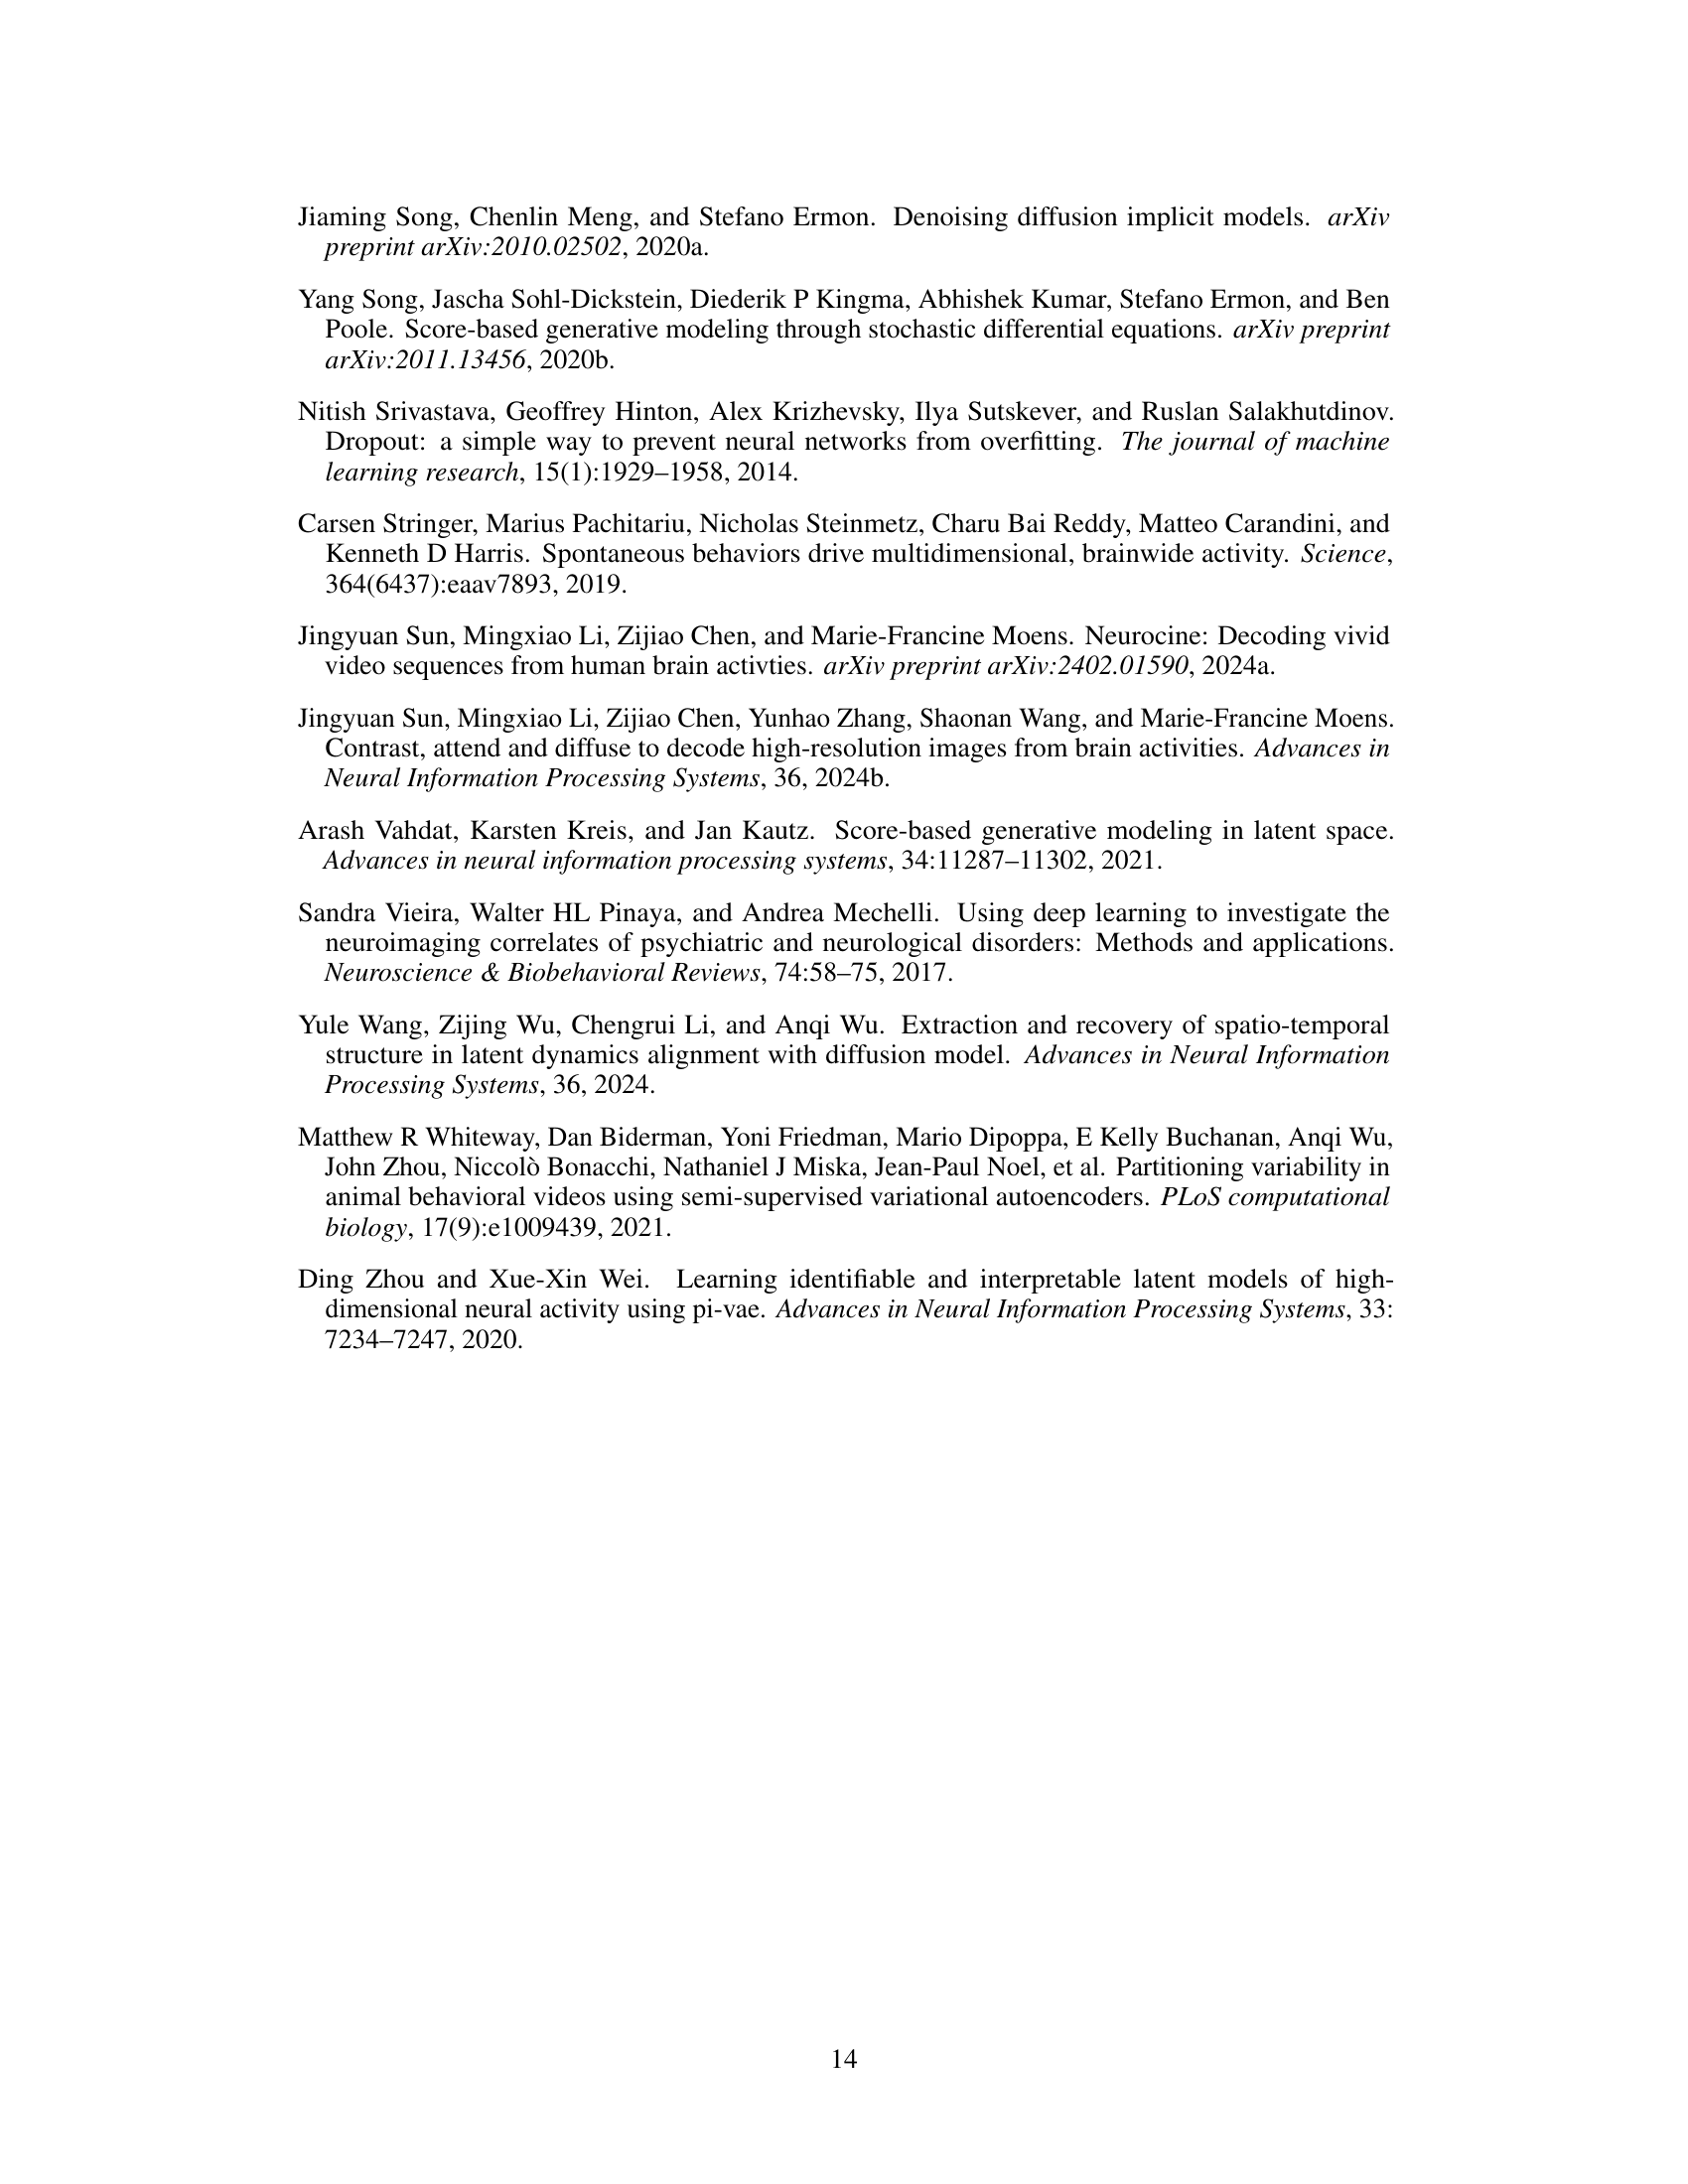
🔼 This table presents a comparison of the neural latent variable model (LVM) performance on two brain regions (VIS-Left and MOs-Left) from Session 1. It compares the performance of BeNeDiff against three baseline methods (Standard VAE, w/o Beha, w/o TC) using three metrics: R-squared (R²), Root Mean Squared Error (RMSE), and Mutual Information Gap (MIG). Higher R² and MIG values are better, indicating better reconstruction quality and disentanglement, respectively, while lower RMSE is better. The bold values show the highest MIG score for each region, indicating the best disentanglement performance achieved by BeNeDiff.
read the caption
Table 1: Baseline Comparison of the neural LVM on two brain regions of Session-1. The boldface denotes the highest score of the MIG metric. Each experiment condition is repeated with 5 runs, and their mean and standard deviations are listed.
Full paper#