↗ OpenReview ↗ NeurIPS Homepage ↗ Chat
TL;DR#
High-resolution image harmonization is challenging due to local color inconsistencies that global adjustment methods often fail to address. Existing methods either rely on global color adjustments which ignore local variations or upscale low-resolution parameter maps, causing artifacts. These limitations result in inharmonious appearances and suboptimal results.
The proposed method, Adaptive-Interval Color Transformation (AICT), directly tackles these issues by predicting pixel-wise color transformations and adaptively adjusting sampling intervals at high-resolution. It uses a parameter network that generates multiple position-dependent 3D LUTs for pixel-wise color transformation and a global consistent weight learning method to enhance the overall harmony. Extensive experiments show that AICT achieves state-of-the-art performance, surpassing other methods in terms of accuracy while maintaining a lightweight architecture.
Key Takeaways#
Why does it matter?#
This paper is important because it presents a novel method for high-resolution image harmonization, a crucial task in image editing and computer vision. It addresses limitations of existing methods by focusing on local color variations and proposes a lightweight architecture. The adaptive-interval color transformation approach and the use of 3D LUTs offer significant improvement over current state-of-the-art methods. This opens new avenues for research in image processing and composition, impacting various applications such as art, entertainment, and data augmentation.
Visual Insights#

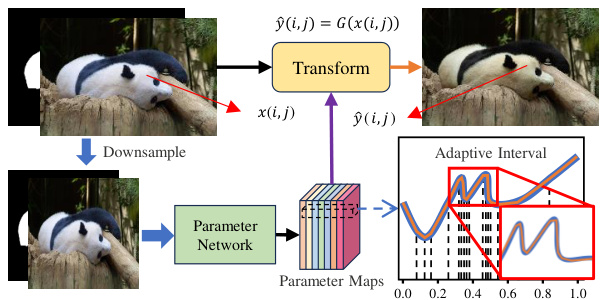
The figure illustrates the overall process of the Adaptive-Interval Color Transformation (AICT) method. It shows how the method works at low resolution by predicting pixel-wise color transformations, then adaptively adjusts the sampling interval to accurately model local color variations at high resolution. The adaptive interval is represented by the non-uniformly spaced vertical lines in the graph, which shows how the sampling of the color transformation adapts to local non-linearities. The final output is a harmonized image.

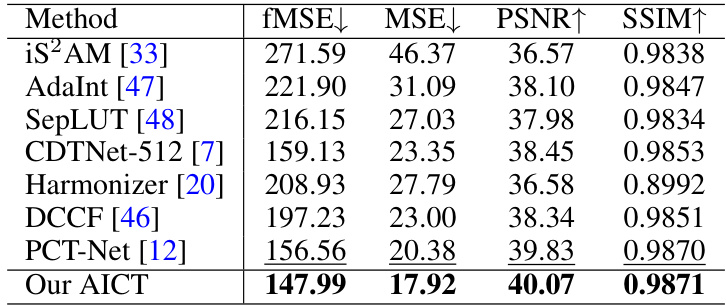
This table presents a quantitative comparison of the proposed AICT method against several state-of-the-art image harmonization methods on the full-resolution test images from the iHarmony4 dataset. The comparison is done across four subsets of the dataset (HAdobe5k, HCOCO, HDay2night, and HFlickr) and an overall average. Metrics used for comparison include foreground-normalized Mean Squared Error (fMSE), Mean Squared Error (MSE), Peak Signal-to-Noise Ratio (PSNR), and Structural Similarity Index (SSIM). The best performing method for each metric and dataset is highlighted in bold, with the second-best underlined. This allows for a clear view of the relative performance of each method across various aspects of image quality.
In-depth insights#
Adaptive Colorization#
Adaptive colorization, a concept not explicitly detailed in the provided research paper, presents a fascinating area of image processing. It suggests a system that goes beyond simple colorization by intelligently adjusting the color palette based on the context of the image. This could involve analyzing the surrounding pixels, identifying objects or regions, and then applying a color scheme tailored to those specific elements. Adaptivity is key, enabling a natural and realistic rendering of color, avoiding the artificial or uniform appearance often seen in standard colorization techniques. Such a system might employ machine learning models trained on large diverse datasets to understand relationships between grayscale images and their corresponding full-color versions. The algorithm would then learn to predict plausible color assignments based on the input grayscale image’s content. Challenges would include handling inconsistencies in the grayscale images (e.g., shadows, lighting variations), and ensuring accurate and consistent color assignment across the entire image. This adaptive approach would be particularly useful for applications requiring high-quality and realistic colorization such as photo restoration or enhancing medical imagery.
High-Res Harmonization#
High-resolution image harmonization presents a significant challenge in image processing, demanding efficient methods to seamlessly integrate foreground objects into background images while maintaining photorealism. Existing approaches often rely on global color adjustments or upsampling of low-resolution parameter maps, resulting in inharmonious appearances, especially at high resolutions. Adaptive-Interval Color Transformation (AICT) addresses this by predicting pixel-wise color transformations, thus capturing local variations more effectively. The method’s innovation lies in its adaptive adjustment of the sampling interval, modeling local non-linearities of color transformation to avoid artifacts. AICT uses position-dependent 3D lookup tables for pixel-wise manipulation and a global consistent weight learning approach for overall harmony. A key advantage is its lightweight architecture, balancing performance with computational efficiency, making it particularly suitable for handling high-resolution images. Although promising, the method’s success depends on accurate mask generation and might struggle with complex scenes containing elements like reflections or transparent objects. Future research may explore extending AICT to handle more challenging scenarios and diverse image content to improve its robustness and versatility.
LUT-Based Approach#
LUT-based approaches in image processing offer a powerful way to perform non-linear color transformations efficiently. They leverage the speed and simplicity of look-up tables to map input color values to desired output values. A key advantage is their computational efficiency, making them suitable for real-time applications or processing high-resolution images where complex calculations would be prohibitive. However, the expressiveness of a LUT is limited by its size. A small LUT may not capture fine-grained color adjustments, leading to quantization artifacts. Larger LUTs, while more expressive, consume more memory and increase processing time. Adaptive techniques that learn or dynamically adjust the LUT parameters based on image content or context can improve their flexibility and reduce artifacts. This could involve predicting multiple LUTs for different regions or conditions and combining them, or learning a mapping that generates LUT parameters on the fly. Another area of improvement lies in combining LUTs with other techniques, such as deep learning, to leverage the strengths of both approaches. Deep learning could predict initial parameter estimates or refine LUT results for higher fidelity. Despite limitations, LUT-based methods remain a significant tool in image processing due to their speed and relatively simple implementation. The future likely holds further innovations involving hybrid approaches that integrate LUTs with other methods for superior performance and increased expressiveness.
Ablation Study Results#
An ablation study systematically removes components of a model to assess their individual contributions. In the context of image harmonization, this might involve removing or altering modules responsible for adaptive interval learning, pixel-wise transformations, or global consistency weighting. Results would reveal the impact of each component on key metrics like fMSE, PSNR, and SSIM. A well-designed ablation study should show a clear performance degradation when essential components are removed, thereby validating their necessity. Conversely, if removing a component leads to negligible performance changes, it suggests that component is less crucial and might be simplified or eliminated to optimize model efficiency. Analyzing ablation results helps determine the most critical parts of the model and provides guidance on potential improvements or streamlining for future versions. It’s important to note that the choice of components to ablate should be justified and linked to the model’s design and proposed mechanisms. Finally, ablation studies are particularly valuable in showcasing the unique contributions of the proposed method and its individual parts when compared to existing image harmonization techniques.
Future Research#
Future research directions stemming from this high-resolution image harmonization work could explore several promising avenues. Improving the handling of complex foreground elements, such as reflections and transparency, would significantly enhance the realism of composite images. Addressing the computational cost associated with high-resolution processing remains crucial; investigating more efficient network architectures or alternative approaches like learning-based upsampling techniques could lead to significant advancements. Expanding the method’s applicability to diverse image domains, including medical imaging and satellite imagery, would broaden its impact. Research into a more robust and generalized approach that handles varying lighting conditions and color palettes more effectively is also needed. Finally, integrating the harmonization model with other image editing tasks within a unified framework could offer a more seamless and powerful editing experience. Furthermore, exploration into adversarial training techniques might improve the method’s ability to handle more complex scenes and generate more realistic results. A focus on developing quantitative evaluation metrics that better capture perceived visual quality would also be valuable.
More visual insights#
More on figures

The figure shows a comparison of the model size and the fMSE score of different image harmonization methods. The proposed method (AICT) achieves state-of-the-art performance with a relatively small model size compared to other methods like Harmonizer, DCCF, and PCT-Net.

The figure shows the framework of the Adaptive-Interval Color Transformation (AICT) method. It’s a two-branch architecture. The low-resolution branch downsamples the input composite image and mask to predict parameter maps (C and F). These parameter maps represent pixel-wise color transformations and adaptive sampling intervals. The high-resolution branch uses these maps to adjust the colors of the original high-resolution image, achieving harmonization with enhanced local variations.

This figure shows the process of color redistribution and result prediction in the Adaptive-Interval Color Transformation (AICT) method. First, the coordinates and color values are mapped to new color values using a 3D lookup table (LUT) called KR. This redistribution step aims to adjust the sampling interval adaptively, enhancing local variations. The redistributed color values and coordinates are then input to another 3D LUT, FR, which produces the final color values for each pixel. This two-step process ensures pixel-wise adaptive adjustment of the sampling interval, allowing for highly accurate and realistic image harmonization.

The figure shows a schematic of the proposed Adaptive-Interval Color Transformation (AICT) method. The input is a composite image containing a foreground object and a background. The method first downsamples the image to a low resolution. A parameter network then predicts pixel-wise color transformations and an adaptive sampling interval. These are then upsampled to high resolution and applied to the original image, resulting in a harmonized image. The adaptive sampling interval helps to model local non-linearities in the color transformation, improving the quality of the harmonization, particularly in high-resolution images.

This figure illustrates the framework of the Adaptive-Interval Color Transformation (AICT) method. The method uses a two-branch architecture. The low-resolution (LR) branch processes a downsampled composite image and mask to predict pixel-wise color transformation parameters. These parameters are then used in the high-resolution (HR) branch to perform pixel-wise color transformation on the full-resolution input image, adaptively adjusting the sampling interval to capture local non-linearities in color changes.

The figure shows the framework of the Adaptive-Interval Color Transformation (AICT) method. It consists of two branches: a high-resolution (HR) branch and a low-resolution (LR) branch. The LR branch downsamples the input composite image and mask to predict parameter maps C and F. The HR branch uses C to redistribute color values and adaptively adjust the sampling interval, then uses F to map the redistributed values to the final harmonized colors.

The figure illustrates the overall architecture of the proposed Adaptive-Interval Color Transformation (AICT) method for high-resolution image harmonization. It consists of two main branches: a low-resolution (LR) branch and a high-resolution (HR) branch. The LR branch processes a downsampled version of the composite image and mask to predict parameter maps that control the color transformation. The HR branch refines the color transformation based on the LR branch’s output, adaptively adjusting the sampling interval to model local non-linearities in the color transform. The final harmonized image is produced by combining the predicted color transformations and pixel coordinates.

This figure shows two examples where the proposed method, AICT, fails to produce satisfactory harmonization results. In the left example, a seemingly simple image with a reflective surface, the harmonization produces unnatural shading and color distortions. Similarly, in the right example, a headlight in a car, there are significant problems accurately matching the color and reflection of the headlight with the car’s surface. This highlights a limitation of AICT, specifically the method’s difficulty in accurately modeling complex reflections and light interactions.
More on tables

This table presents a quantitative comparison of different image harmonization methods on the HAdobe5k subset of the iHarmony4 dataset. The comparison is done at a high resolution (2048x2048 pixels). The metrics used for comparison are fMSE (Foreground-normalized Mean Squared Error), MSE (Mean Squared Error), PSNR (Peak Signal-to-Noise Ratio), and SSIM (Structural Similarity Index). Lower values for fMSE and MSE, and higher values for PSNR and SSIM, indicate better performance. The best performing method for each metric is highlighted in bold, with the second-best underlined.

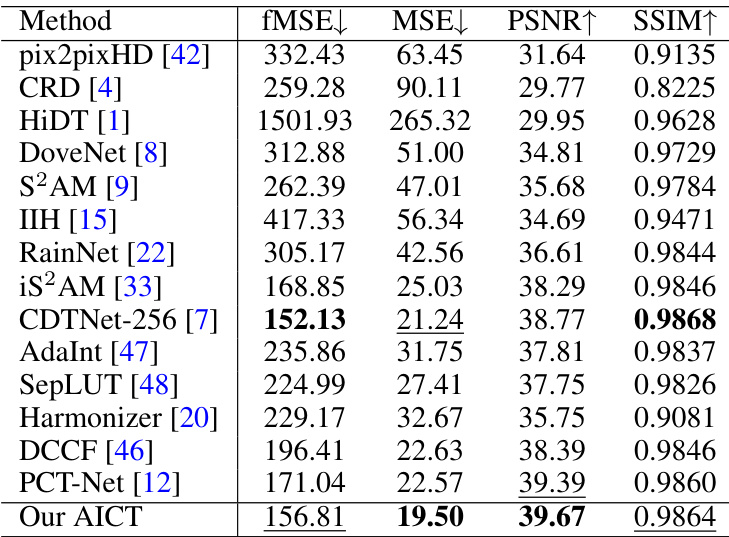
This table presents a quantitative comparison of the proposed AICT method against other state-of-the-art image harmonization methods on the ccHarmony dataset. The evaluation is performed at a resolution of 256x256 pixels. The metrics used for comparison are fMSE (Foreground-normalized Mean Squared Error), MSE (Mean Squared Error), and PSNR (Peak Signal-to-Noise Ratio). Lower fMSE and MSE values, and higher PSNR values indicate better performance. The best performing method for each metric is highlighted in bold, and the second-best is underlined.

This table presents the results of ablation studies conducted on the adaptive interval learning method of the AICT model. The ‘Single’ model represents AICT without the weight learning module and adaptive interval learning. The ‘Cross’ model adds channel-crossing. The ‘w/o Int’ model removes the adaptive interval learning. The ‘Int × 2’ and ‘Int × 3’ models use 2 and 3 LUTs for adaptive interval learning respectively. ‘Tra × 2’ and ‘Tra × 3’ cascade 2 and 3 LUTs for the color transformation. ‘Alt × 2’ and ‘Alt × 3’ cascade 4 and 6 LUTs for alternating adaptive interval learning and color transformation. Finally, ‘AdaInt + SepLUT’ combines AdaInt and SepLUT models for global transformations. The table shows the fMSE, MSE, and PSNR values for each model, demonstrating the effectiveness of the adaptive interval learning method. The lowest fMSE, MSE, and the highest PSNR values are highlighted in bold, indicating the best-performing model.

This table presents the ablation study results on the global consistent weight learning module. It shows the impact of removing different components of the weight learning module on the performance of the model, as measured by fMSE, MSE, and PSNR. The results demonstrate the importance of the weight learning module and its various components for achieving optimal performance in image harmonization. The baseline model is the full model (‘Our AICT’). Variants remove the weight vector corresponding to the red channel (‘w/o R’), the red and green channels (‘w/o RG’), the entire module (‘w/o Weight’), or use spatially varying weights instead of image-level weights (‘Spatial’).

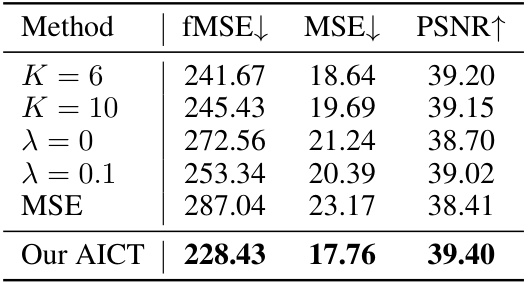
This ablation study investigates the influence of key hyperparameters on the performance of the AICT model. Specifically, it examines the impact of varying the number of knots (K) in the curve representation, the coefficient (λ) of the low-resolution branch loss, and the hyperparameter (Amin) within the foreground-normalized MSE loss function. The results reveal the optimal values for these parameters that yield the best performance of the AICT model on the iHarmony4 dataset.

This table presents a quantitative comparison of the proposed AICT method against other state-of-the-art image harmonization methods on the iHarmony4 dataset. The comparison is done using four metrics: foreground normalized mean square error (fMSE), mean square error (MSE), peak signal-to-noise ratio (PSNR), and structural similarity index (SSIM). The results are shown for four subsets of the iHarmony4 dataset (HAdobe5k, HCOCO, HDay2Night, HFlickr) and the overall dataset. Lower fMSE and MSE values, and higher PSNR and SSIM values indicate better performance. The best and second-best performing methods for each metric and dataset subset are highlighted.

This table presents a quantitative comparison of the proposed AICT method against several state-of-the-art image harmonization methods. The comparison is performed on the full-resolution test images of the iHarmony4 dataset, using four key metrics: fMSE (Foreground-normalized Mean Squared Error), MSE (Mean Squared Error), PSNR (Peak Signal-to-Noise Ratio), and SSIM (Structural Similarity Index). Lower values for fMSE and MSE, and higher values for PSNR and SSIM indicate better performance. The best result for each metric in each subset is bolded, and the second-best result is underlined, allowing for easy identification of the top-performing methods.

This table presents a quantitative comparison of the proposed AICT method against other state-of-the-art image harmonization methods on the full-resolution test images of the iHarmony4 dataset. The metrics used for comparison include fMSE (Foreground-normalized Mean Squared Error), MSE (Mean Squared Error), PSNR (Peak Signal-to-Noise Ratio), and SSIM (Structural Similarity Index). Lower values for fMSE and MSE, and higher values for PSNR and SSIM indicate better performance. The table shows the results broken down by each subset of the iHarmony4 dataset (HAdobe5k, HCOCO, HDay2Night, HFlickr) as well as the overall average across all subsets. The best performing method for each metric in each subset is shown in bold, and the second best is underlined.

This table presents a quantitative comparison of different image harmonization methods on the HAdobe5k subset of the iHarmony4 dataset. The comparison is performed using images with resolutions exceeding 5K (5120 x 2880 pixels). The metrics used are fMSE (Foreground Mean Squared Error), MSE (Mean Squared Error), PSNR (Peak Signal-to-Noise Ratio), and SSIM (Structural Similarity Index). Lower fMSE and MSE values and higher PSNR and SSIM values indicate better performance. The best performing method for each metric is highlighted in bold, and the second-best method is underlined.

This table compares the computational efficiency of different image harmonization methods (Harmonizer, DCCF, PCT-Net, and the proposed AICT) for images of size 1024 x 1024 pixels. It shows the FLOPs (floating-point operations), memory usage (in MB), and inference time (in milliseconds) for each method. This allows for a quantitative comparison of the methods’ speed and resource requirements.

This table compares the computational efficiency of different image harmonization methods (Harmonizer, DCCF, PCT-Net, and the proposed AICT) at a resolution of 2048 x 2048 pixels. It presents the FLOPs (floating-point operations), memory usage in MB, and inference time in milliseconds for each method, allowing for a quantitative comparison of their resource requirements.

This table presents the results of a user study comparing the visual quality of images harmonized by four different methods: Harmonizer, DCCF, PCT-Net, and the authors’ proposed method, AICT. Each method’s performance is represented by a score, where a higher score indicates better visual quality. The scores were obtained by having 20 volunteers independently rank images harmonized by each of the four methods, with scores of 3, 2, and 1 assigned to the first, second, and third ranks, respectively. The average score for each method is reported, with the best-performing method (AICT) highlighted in bold.
Full paper#


