TL;DR#
The Elo rating system, widely used for ranking players, lacks theoretical understanding. Existing research mainly focuses on offline BTL model parameter estimation, while Elo’s online update mechanism remains less explored. The paper addresses this gap by analyzing Elo’s convergence rate using Markov chain theory.
The study leverages the Bradley-Terry-Luce model and explores Elo as a Markov chain. It introduces a capped Elo variant to prevent unbounded ratings while preserving the zero-sum property. The main finding demonstrates Elo’s ability to learn model parameters at a competitive rate compared to existing offline algorithms, showcasing its robustness. The research connects Elo’s convergence to the fastest-mixing Markov chain problem, providing insights for efficient tournament design.
Key Takeaways#
Why does it matter?#
This paper is vital for researchers in machine learning, ranking systems, and Markov chain theory. It bridges the gap between theoretical understanding and practical applications of Elo systems. The novel probabilistic analysis provides a new perspective on Elo’s convergence rate, opening avenues for improved tournament design and efficient online learning algorithms. Its connection with the fastest-mixing Markov chain problem further enhances its significance.
Visual Insights#
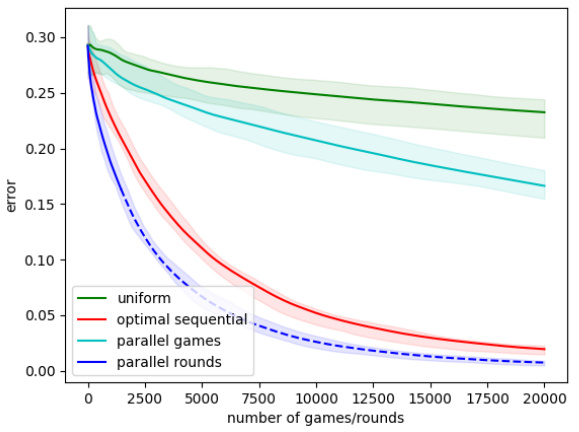
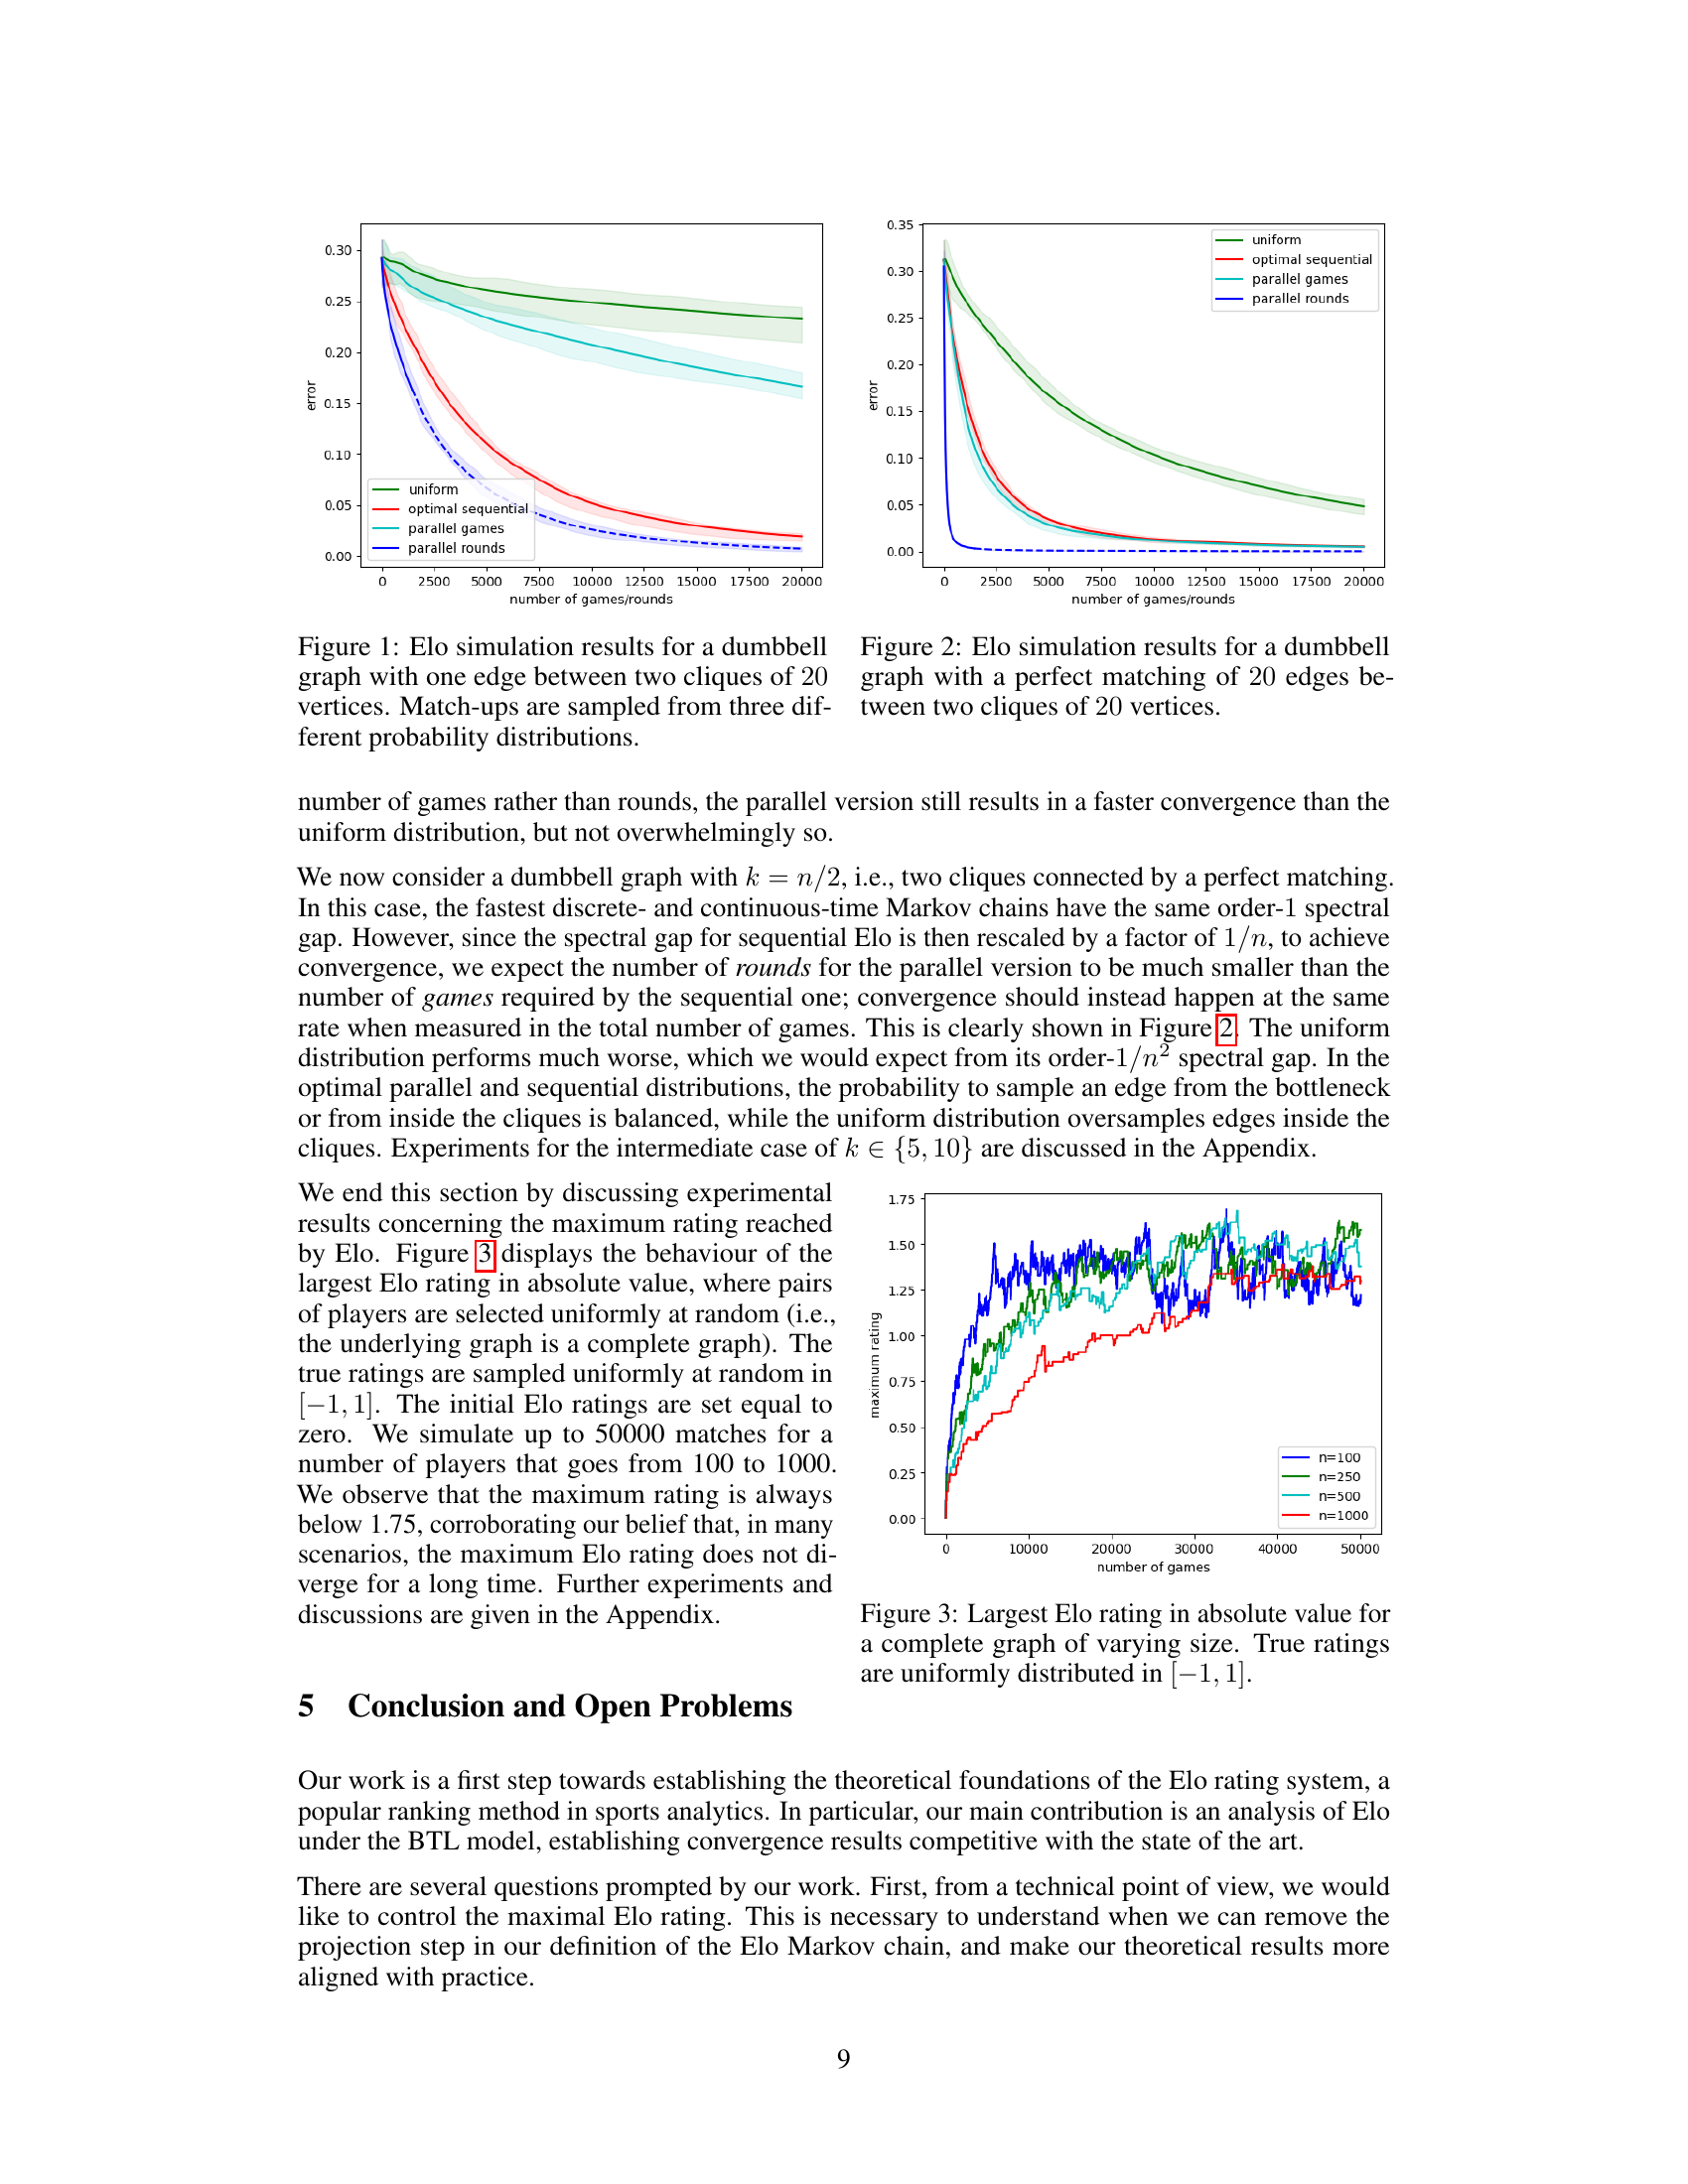
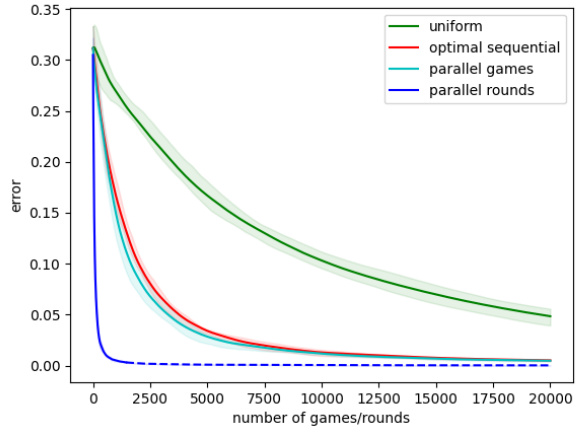
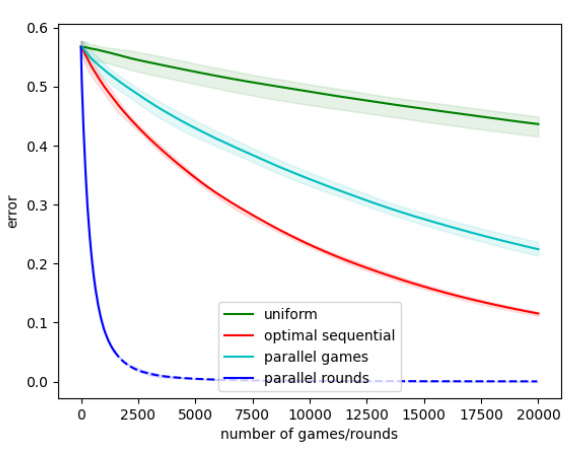
🔼 This figure displays the results of Elo rating simulations on a dumbbell graph, a graph consisting of two fully connected components (cliques) of 20 vertices each, connected by a single edge. Three different probability distributions for selecting the next match are compared: uniform, an optimal sequential distribution (maximizing the spectral gap), and an optimal parallel distribution (maximizing the spectral gap for parallel rounds). The plot shows the average L2 distance between the time-averaged Elo ratings and the true ratings, normalized by the number of players, over 20,000 games/rounds. The shaded regions represent the 25th to 75th percentiles across ten simulations, showcasing the variability in convergence rates. This experiment highlights how different matching schemes affect the speed and stability of Elo rating convergence.
read the caption
Figure 1: Elo simulation results for a dumbbell graph with one edge between two cliques of 20 vertices. Match-ups are sampled from three different probability distributions.
In-depth insights#
Elo’s Markov Chain#
The concept of “Elo’s Markov Chain” offers a novel perspective on the Elo rating system, framing it as a Markov process. This approach is valuable because it allows for a rigorous theoretical analysis using powerful tools from Markov chain theory, providing insights into the system’s convergence and dynamics. A key advantage is the ability to study Elo’s behavior in an online setting, unlike much of the existing BTL model literature which focuses on offline analysis. This allows for a more realistic understanding of how Elo ratings evolve over time with continuous updates. By modeling Elo as a Markov chain, we can better understand its convergence rate to the true player skill parameters, potentially optimizing tournament design. The connection to the fastest-mixing Markov chain problem is particularly interesting, suggesting ways to maximize Elo’s efficiency in estimating skill parameters. However, challenges remain. Elo’s non-reversibility complicates analysis, as does the lack of total variation convergence to equilibrium. Despite these challenges, the Markov chain approach offers a fruitful avenue for future research to refine our understanding of the Elo rating system and extend its applications.
Convergence Rates#
The heading ‘Convergence Rates’ in a research paper would typically delve into the speed at which a system or algorithm approaches a stable state or solution. A thoughtful analysis would require examining the mathematical framework used to quantify convergence (e.g., total variation distance, Wasserstein distance). Key factors influencing convergence rates would be explored, such as step size, algorithm parameters, and dataset properties. The paper might compare the convergence rate of the proposed method to existing state-of-the-art techniques, highlighting its strengths and weaknesses. Furthermore, a discussion of the practical implications of the convergence rate would be valuable, for example, how it impacts computational cost or the time required to obtain reliable results. A robust analysis would also address any theoretical limitations in determining the exact convergence rate, possibly mentioning challenges with non-reversible Markov chains or high-dimensional spaces. Finally, the results should be clearly linked back to the main research question, demonstrating their significance for the broader field.
Tournament Design#
The section on Tournament Design explores the optimization of Elo rating system convergence through strategic match-up probabilities. Instead of a uniform probability distribution, which is common in practice, the authors propose selecting match-ups based on the structure of a comparison graph representing the players and their possible pairings. This approach connects Elo rating convergence to the fastest-mixing Markov chain problem. By optimizing the match-up probabilities to maximize the spectral gap (a measure of how quickly a Markov chain converges to its stationary distribution), the authors aim to significantly improve Elo’s convergence rate, accelerating the estimation of true player skills. This strategic design is demonstrated to be particularly advantageous when dealing with graphs having bottlenecks or uneven player distributions, as in hierarchical league structures. The authors explore both sequential and parallel tournament designs, presenting theoretical and experimental results which highlight the superior convergence of their optimized tournament structure compared to traditional methods, while also addressing practical considerations for implementing this approach in real-world scenarios.
Bias & Variance#
The section on Bias & Variance is crucial for understanding the Elo rating system’s accuracy. Bias refers to the systematic error in the Elo ratings, meaning the expected value of the rating differs from the true skill level. This bias arises from the system’s inherent update mechanism and is not entirely eliminated even in equilibrium. The authors acknowledge this limitation. Variance, on the other hand, quantifies the randomness in the rating estimates, reflecting the system’s sensitivity to match outcomes. High variance implies less reliable ratings. The analysis highlights how the bias and variance depend on factors like the step size (η), the spectral gap (λq) which reflects the graph structure of match pairings, and the bounds (M) placed on the ratings to prevent unbounded growth. The analysis is not trivial, it involves sophisticated mathematical techniques, including Markov chain theory and spectral analysis, to estimate these quantities. Understanding the bias-variance tradeoff is critical for assessing the Elo system’s effectiveness and designing optimal tournament structures.
Future Directions#
The “Future Directions” section of this research paper would ideally delve into several promising avenues. Extending the Elo system’s theoretical underpinnings to encompass more complex scenarios, such as those involving non-zero-sum games or dynamic player skill changes, would be crucial. Investigating alternative update rules that offer improved convergence or robustness could yield practical benefits. Exploring the application of the Elo system to different problem domains, beyond competitive ranking, presents exciting possibilities. The study of optimal tournament design warrants further exploration, going beyond the connections already highlighted between fastest-mixing Markov chains and Elo’s convergence rate. Finally, empirical validation of theoretical results through large-scale experiments, incorporating diverse types of competitive settings and player populations, is essential. These future studies could also address the computational costs associated with Elo implementations and provide improvements for scalability and efficiency.
More visual insights#
More on figures
🔼 The figure displays simulation results for the Elo rating system on a dumbbell graph, which consists of two fully connected groups of 20 vertices each, linked by a single edge. The simulations compare the performance of three different match-up probability distributions: uniform, optimal sequential, and optimal parallel. The y-axis represents the average error (presumably L2 distance between estimated and true ratings), and the x-axis represents the number of games played. The graph shows that the optimal sequential and parallel methods significantly outperform the uniform distribution, achieving much lower errors with the same number of games played. The parallel method shows that using parallel rounds can offer additional benefits in convergence speed.
read the caption
Figure 1: Elo simulation results for a dumbbell graph with one edge between two cliques of 20 vertices. Match-ups are sampled from three different probability distributions.
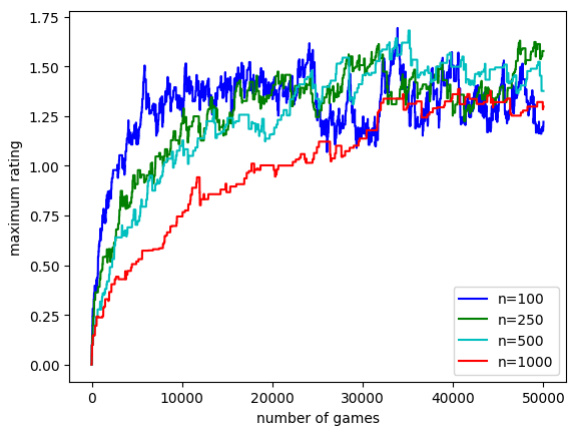
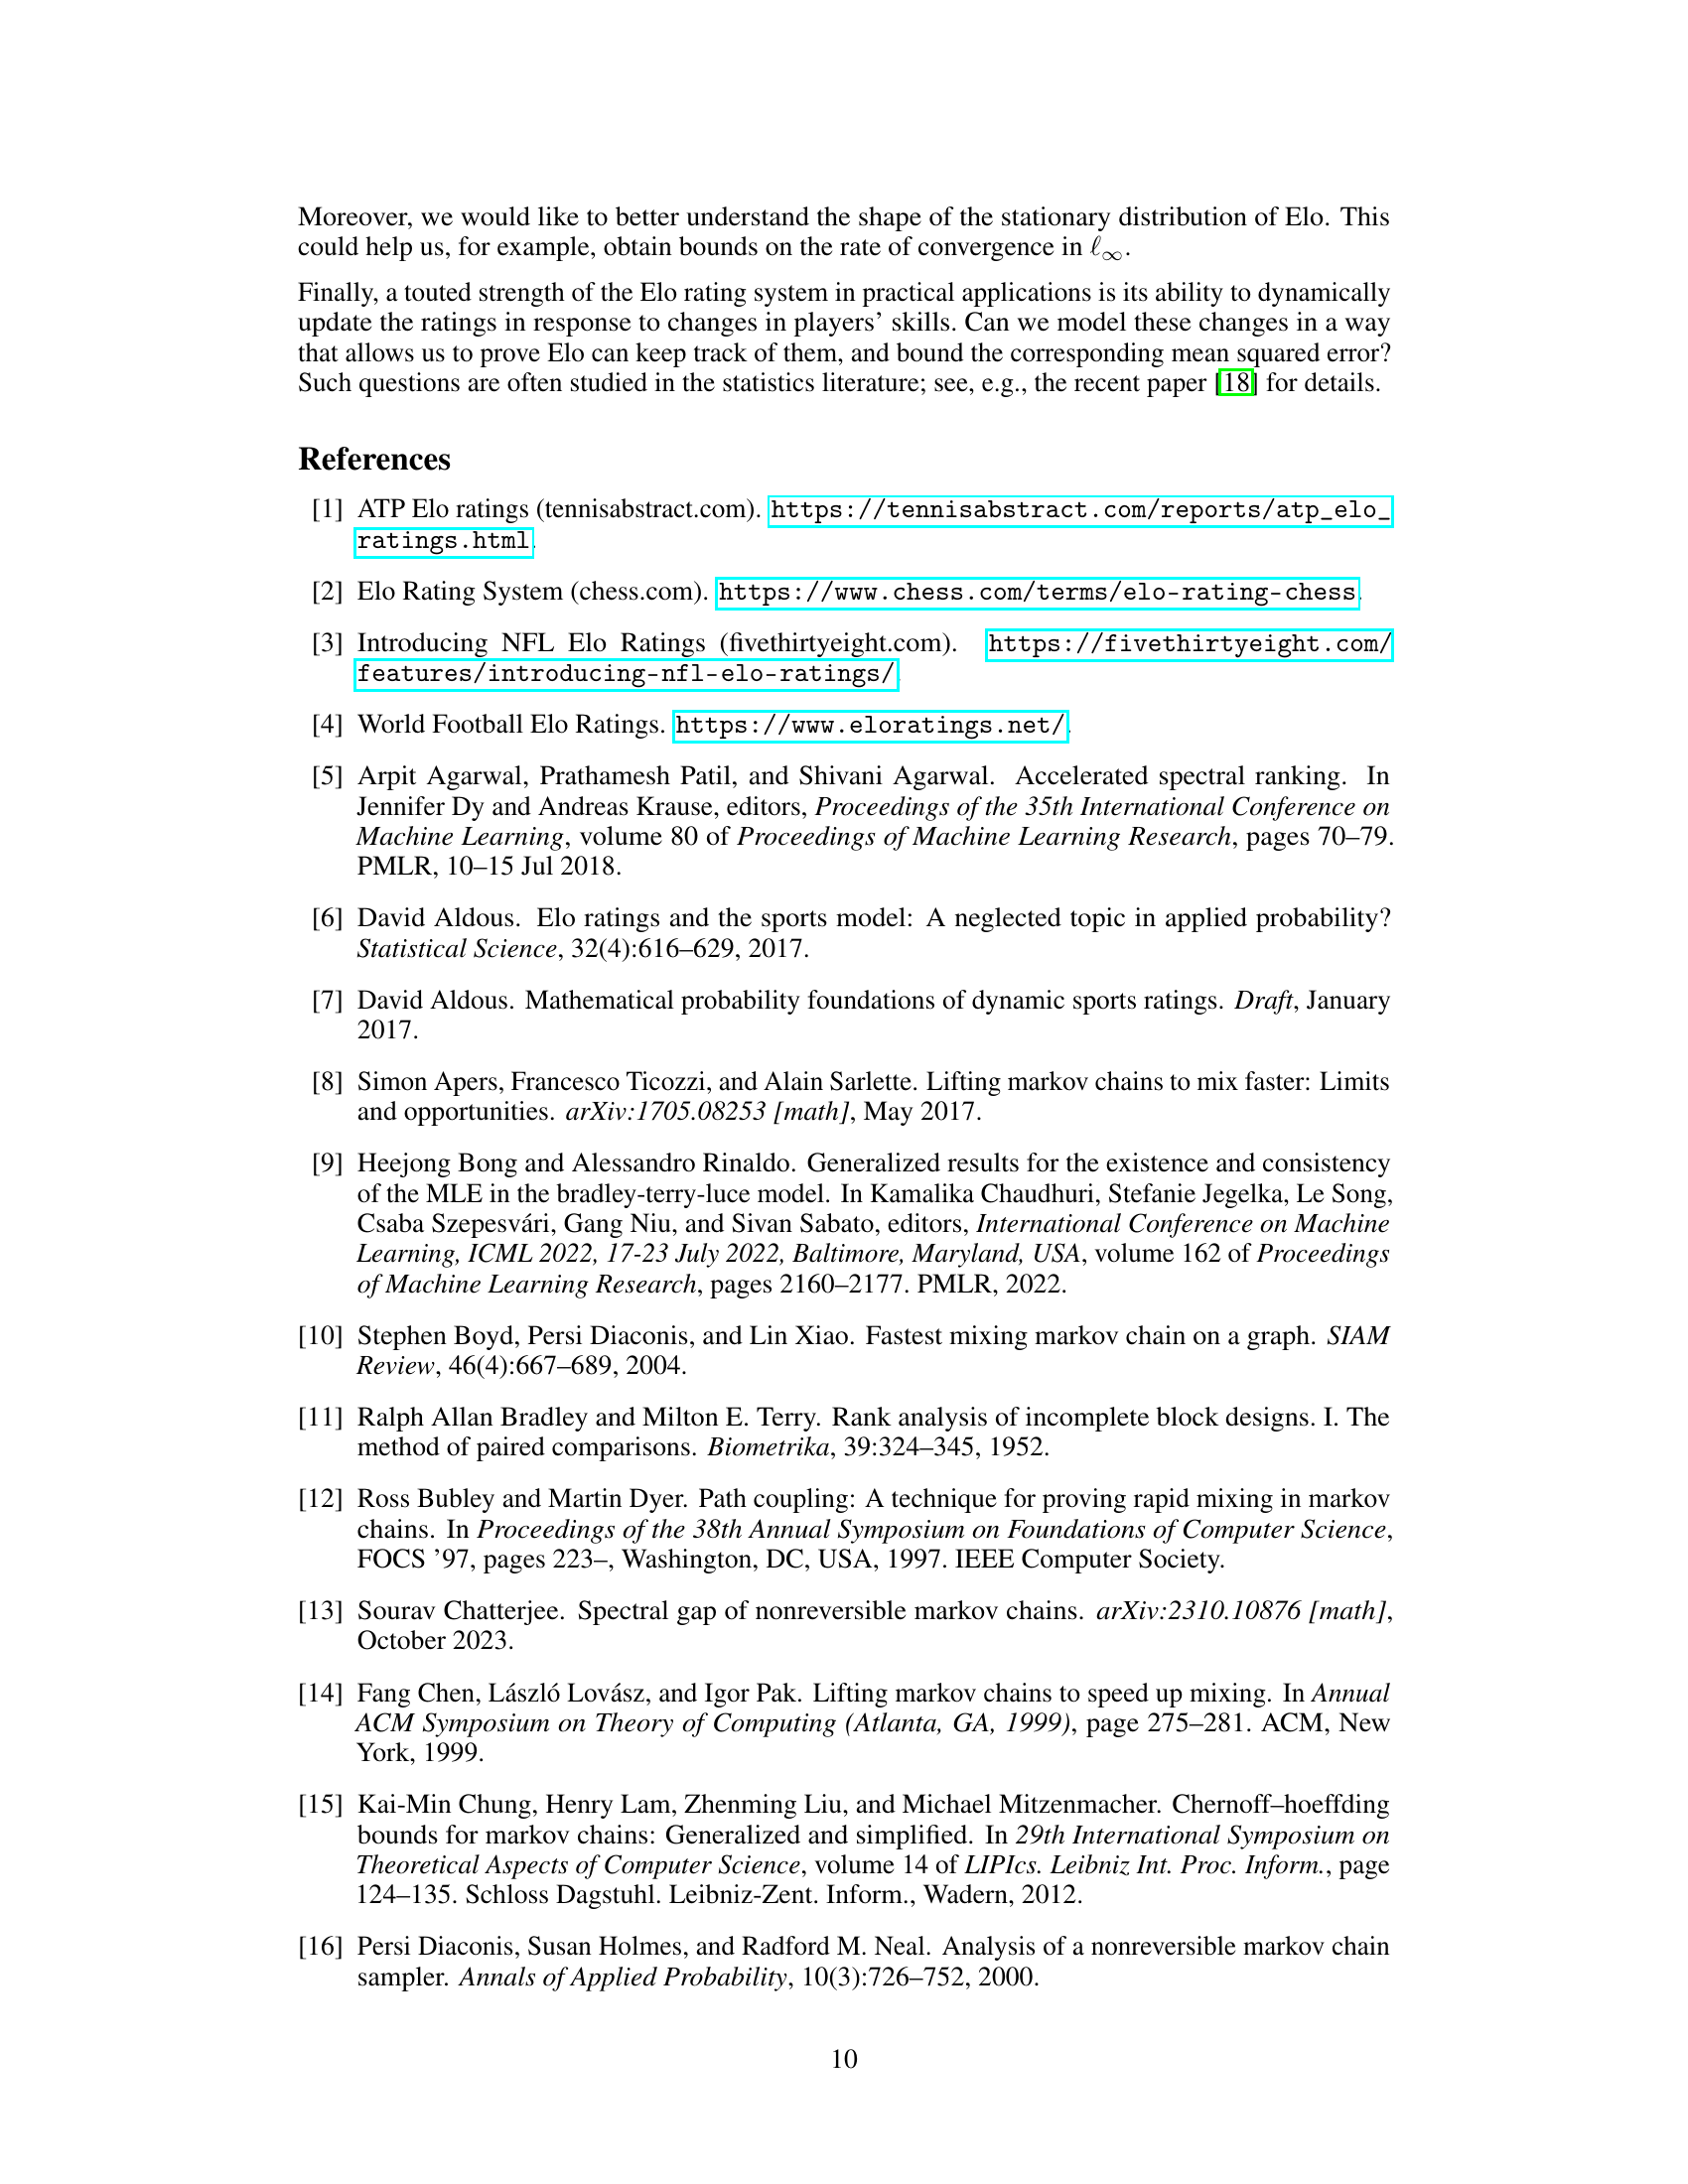
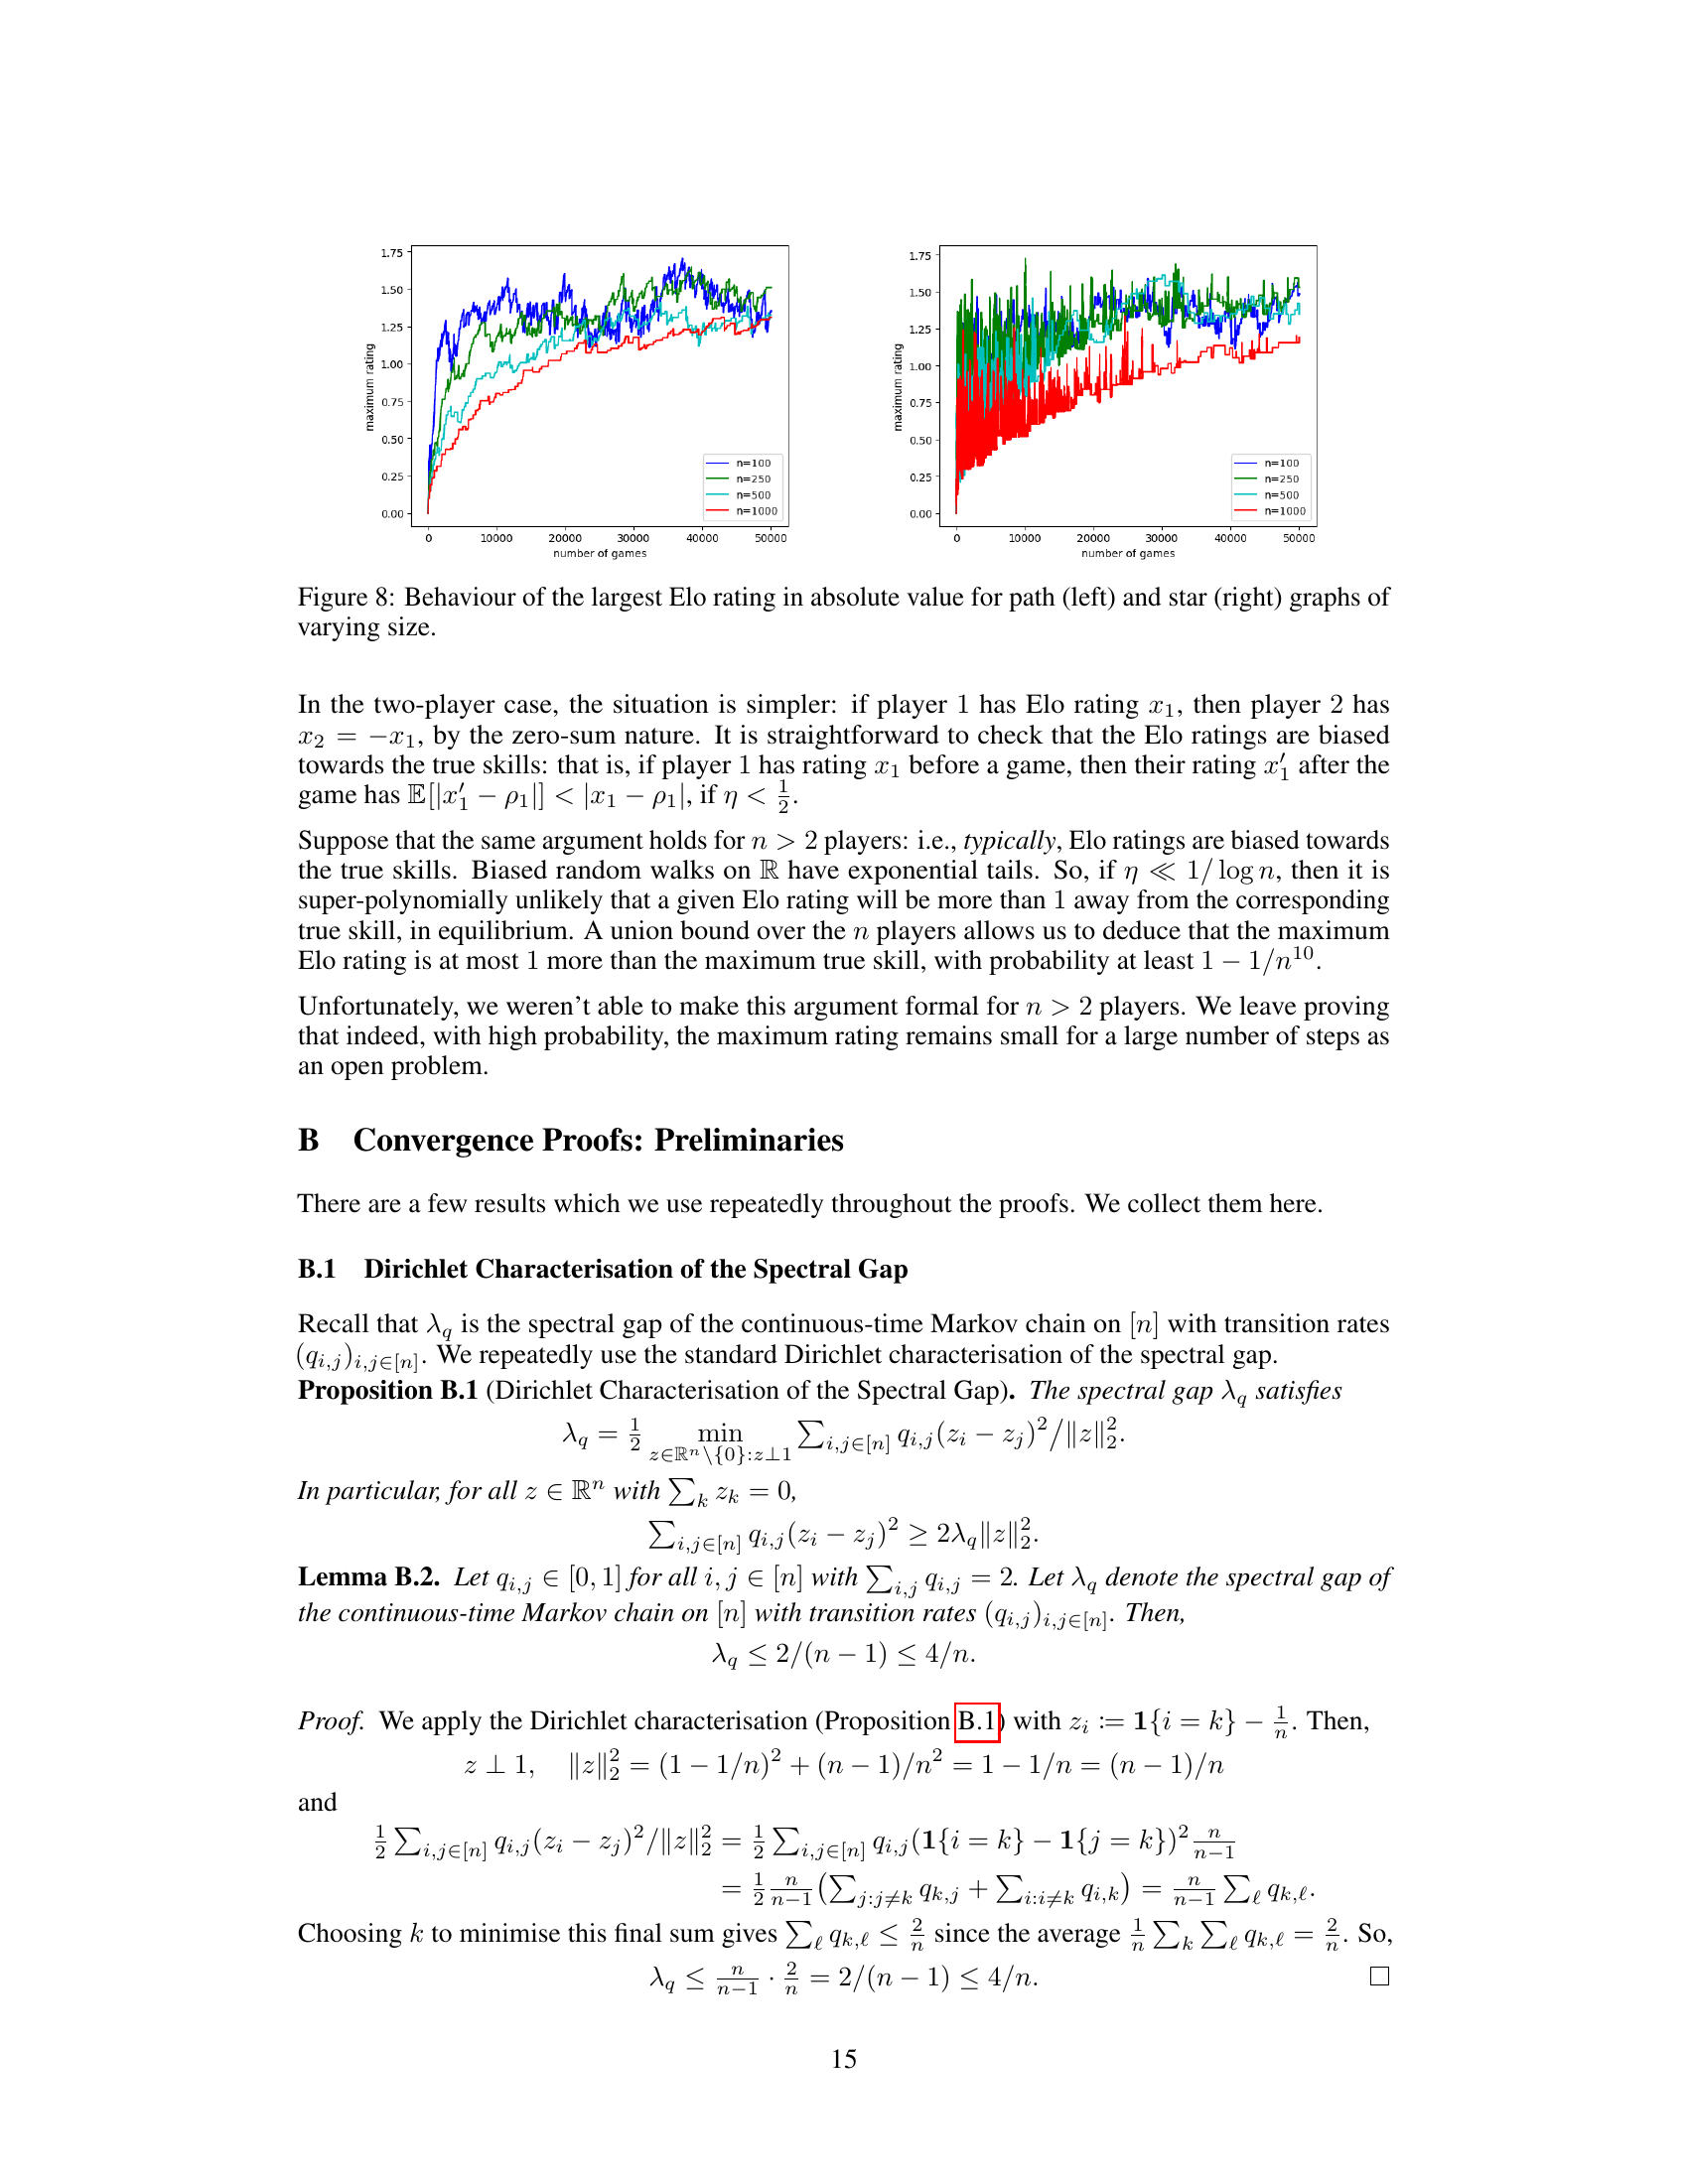
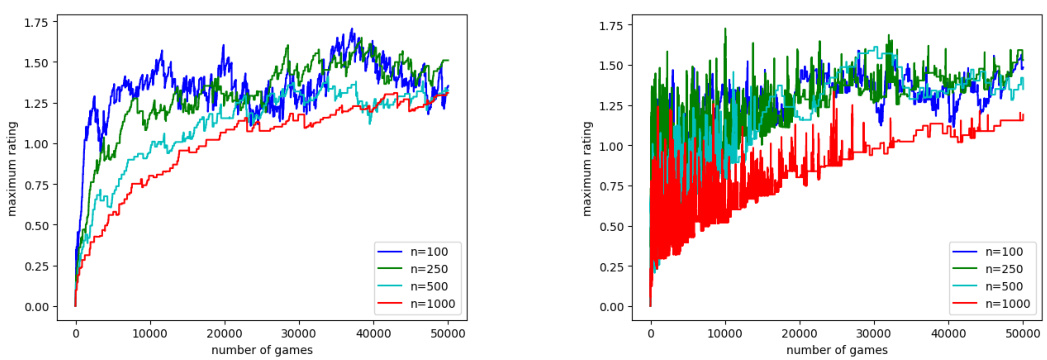
🔼 The figure displays the maximum absolute value of Elo ratings over time for complete graphs with varying numbers of players (n=100, 250, 500, 1000). The true player ratings are randomly sampled from a uniform distribution between -1 and 1. The plot shows that even with a large number of games, the maximum rating remains relatively bounded, suggesting that unbounded Elo ratings are unlikely in practice.
read the caption
Figure 3: Largest Elo rating in absolute value for a complete graph of varying size. True ratings are uniformly distributed in [-1,1].
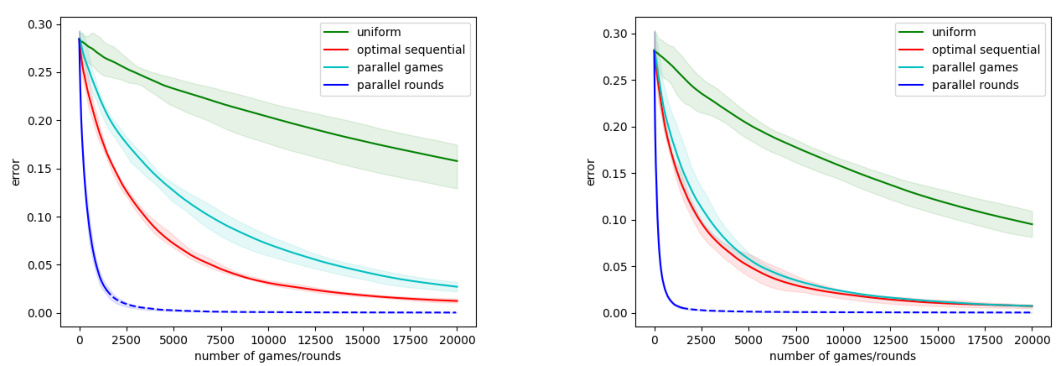
🔼 The figure shows the results of Elo simulations for dumbbell graphs with varying numbers of edges connecting two cliques of 20 vertices each. The simulations compare the convergence rate of Elo ratings using three different probability distributions for selecting matches: uniform, optimal sequential, and optimal parallel. The x-axis represents the number of games or rounds played, and the y-axis shows the average L2-distance between the time-averaged Elo ratings and the true ratings. The shaded regions represent the 25th-75th percentiles across ten repetitions of each simulation. The results demonstrate that increasing the number of edges connecting the cliques improves the performance of the optimal parallel distribution, while the optimal sequential distribution shows similar performance regardless of the number of edges. This highlights the trade-offs between sequential and parallel approaches.
read the caption
Figure 4: Elo simulation results for dumbbell graphs with k = 5 (left) and k = 10 (right) edges between two cliques of 20 vertices.
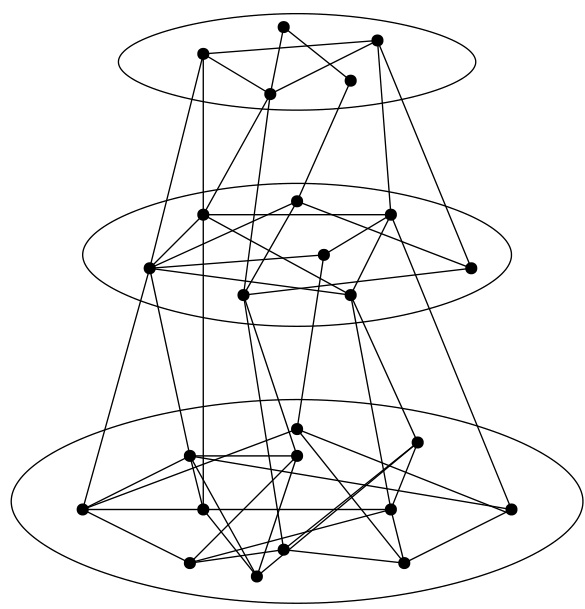
🔼 This figure shows a schematic representation of a pyramidal graph. The graph is composed of three layers, each containing an Erdős-Rényi random graph. The number of nodes in each layer decreases from the bottom to the top (64, 32, and 16 nodes respectively). Each layer is connected to the adjacent layers through sparse cuts. This structure is used to simulate the hierarchical structure of sports leagues.
read the caption
Figure 5: Schematic representation of the pyramidal graph.
🔼 This figure displays the results of Elo rating simulations performed on a dumbbell graph, which consists of two fully connected groups (cliques) of 20 vertices each, connected by a single edge. The simulations compare the convergence rate of the Elo ratings towards the true ratings under three different match-up probability distributions: uniform, optimally sequential, and optimally parallel. The x-axis represents the number of games played, and the y-axis shows the average error between the time-averaged Elo ratings and the true player ratings. The shaded area represents the interquartile range across multiple simulation runs, illustrating the variability in results. The purpose is to visualize how different match selection strategies affect the speed and accuracy of Elo rating convergence.
read the caption
Figure 1: Elo simulation results for a dumbbell graph with one edge between two cliques of 20 vertices. Match-ups are sampled from three different probability distributions.
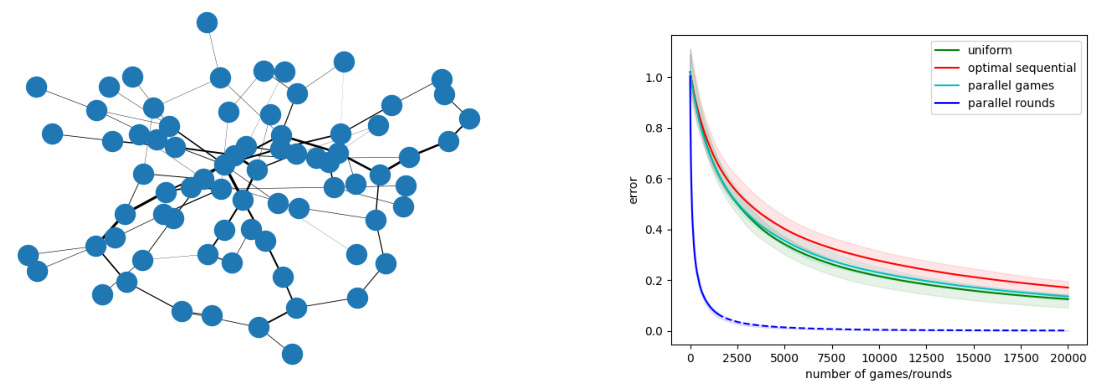
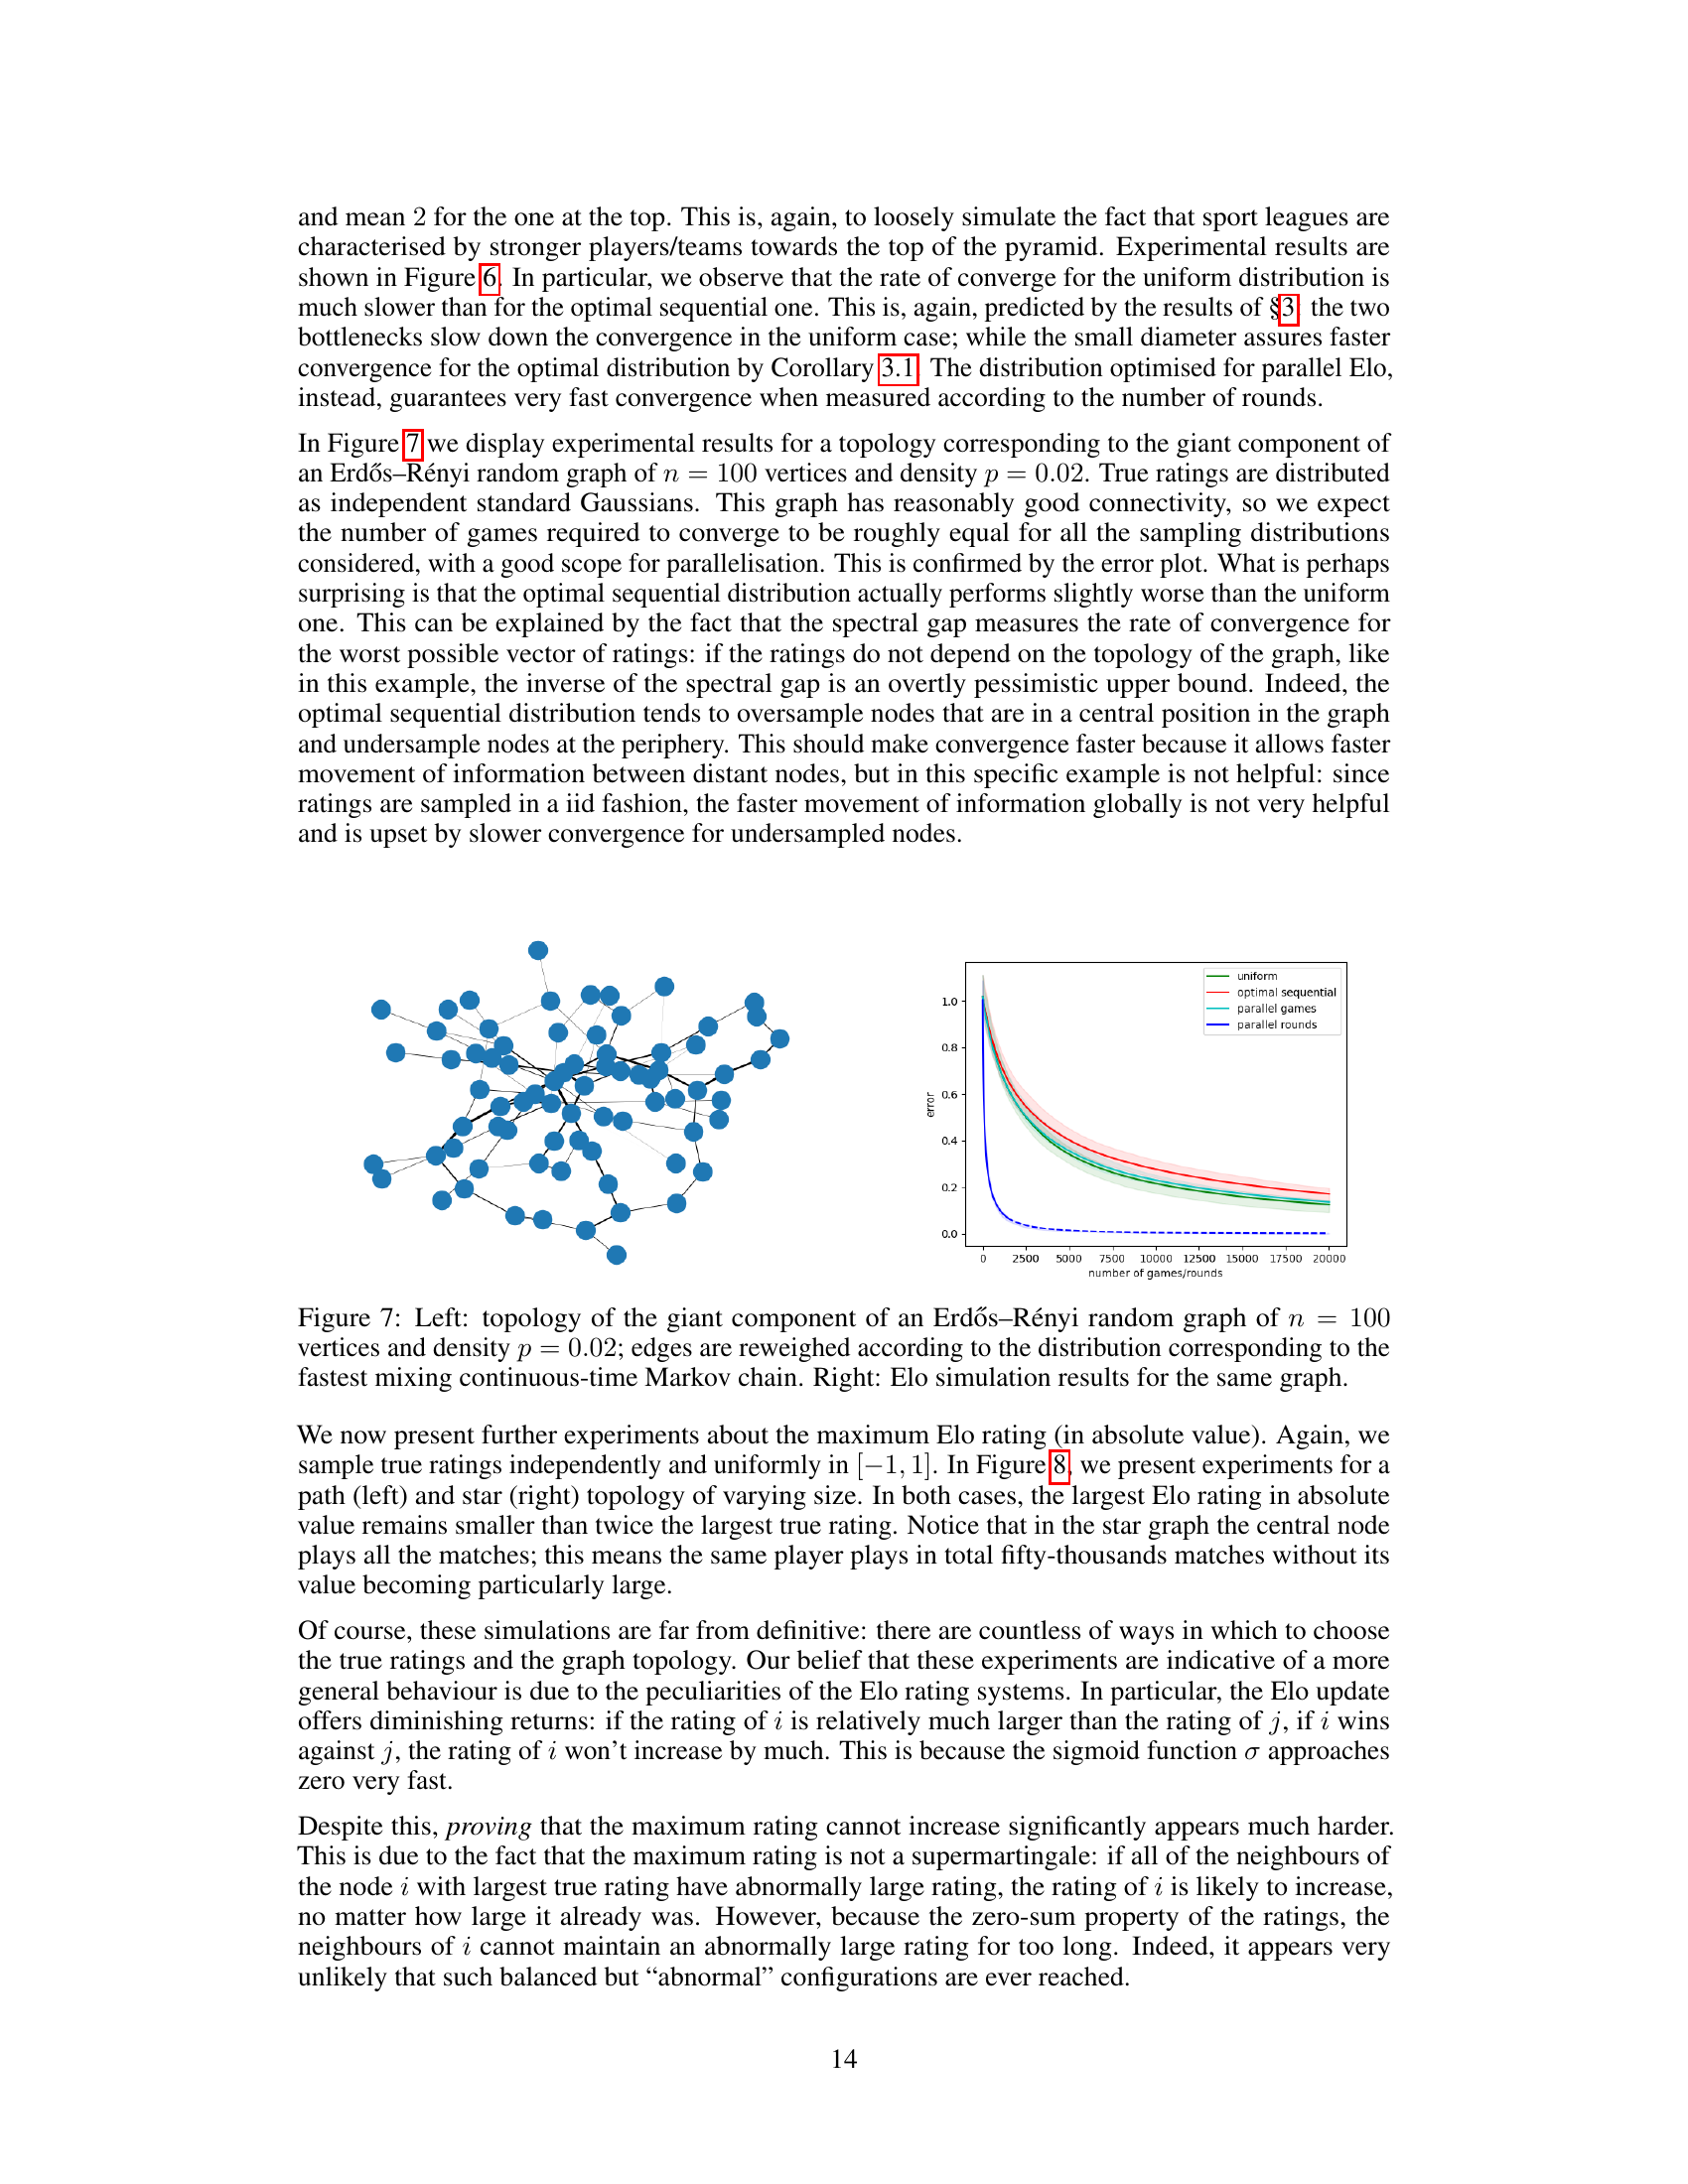
🔼 The figure displays the topology of a giant component of an Erdos-Renyi random graph with 100 vertices and density p=0.02 (left). The edges are reweighted according to the distribution that corresponds to the fastest mixing continuous-time Markov chain. The right panel shows the Elo simulation results for the same graph, illustrating the convergence rate of time-averaged Elo ratings to the true ratings under four different probability distributions (uniform, optimal sequential, parallel games, and parallel rounds). The results demonstrate how the choice of distribution significantly impacts the convergence rate.
read the caption
Figure 7: Left: topology of the giant component of an Erdős-Rényi random graph of n = 100 vertices and density p = 0.02; edges are reweighed according to the distribution corresponding to the fastest mixing continuous-time Markov chain. Right: Elo simulation results for the same graph.
🔼 The figure shows the maximum absolute value of the Elo ratings over time for complete graphs of varying sizes (n = 100, 250, 500, 1000). The true player ratings are sampled from a uniform distribution between -1 and 1. The plot displays the evolution of the maximum Elo rating as the number of games played increases, demonstrating that the maximum rating remains bounded in the simulations performed.
read the caption
Figure 3: Largest Elo rating in absolute value for a complete graph of varying size. True ratings are uniformly distributed in [-1,1].
Full paper#