↗ OpenReview ↗ NeurIPS Homepage ↗ Chat
TL;DR#
Many real-world systems involve multiple decision-makers interacting strategically within dynamic environments. These interactions cause changes in data distributions that learning models rely upon, a phenomenon called endogenous distribution shifts. This effect is particularly challenging to study in decentralized settings where each player only has a limited view of the overall system. This paper tackles the problem by introducing a novel framework which formulates this problem as a decentralized noncooperative game with coupled decision-dependent distributions.
The authors propose a novel decentralized algorithm to efficiently find the solution to the game, proving it converges to the solution at a sublinear rate. They also provide theoretical guarantees on the optimality of the proposed solution and upper bounds on the difference between two equilibrium concepts, providing useful insights on the game’s dynamics. The simulation results on networked Cournot and ride-share market scenarios confirm the theoretical findings.
Key Takeaways#
Why does it matter?#
This paper is crucial because it tackles the under-researched area of endogenous distribution shifts in decentralized games, a common scenario in many real-world applications. Its rigorous theoretical analysis and proposed algorithm provide a strong foundation for further research into resilient and efficient learning in dynamic environments.
Visual Insights#

This figure displays the convergence of two key metrics over the iterations of the algorithm. The left plot shows the time-average regrets for five different firms, illustrating how the suboptimality of their strategy sequences diminishes over time. The right plot shows the time-average constraint violations across three markets, demonstrating the algorithm’s ability to manage coupled inequality constraints effectively. The convergence of both metrics towards zero indicates that the algorithm is efficiently achieving its dual goals of minimizing individual costs and satisfying the constraints.
In-depth insights#
Decentralized PP Games#
Decentralized performative prediction (PP) games represent a significant advance in multi-agent systems, addressing the complex interplay between strategic decision-making and endogenous data distribution shifts. Decentralization introduces the challenge of limited information; each agent only observes its local environment and interacts with neighbors, impacting both equilibrium analysis and algorithm design. Unlike centralized PP settings, finding efficient algorithms for computing equilibria is a crucial problem. The coupled decision-dependent distributions introduce intricate dependencies that affect each agent’s cost function. This necessitates new equilibrium concepts like performative stable equilibrium (PSE), which address the dynamic nature of data distributions, moving beyond the standard Nash Equilibrium. A key aspect is quantifying the gap between PSE and NE. The paper’s contribution lies in developing a decentralized algorithm for computing PSE and providing theoretical guarantees on its convergence. This algorithm addresses the challenges of decentralized communication and endogenous shifts, making it valuable in real-world applications.
Performative Equilibria#
Performative equilibria represent a fascinating intersection of game theory and machine learning, particularly relevant in scenarios where agents’ actions influence the data distribution upon which future decisions are made. This creates a feedback loop: models predict, act, and shape the very data they rely on, leading to equilibria that are different from those in traditional settings where data is exogenous. Analyzing these equilibria requires understanding this dynamic interplay, examining how decision-making impacts data, and recognizing that stability might require different equilibrium concepts such as performative stable equilibrium (PSE), which focuses on the stability of actions given the resultant data distribution, rather than solely on Nash equilibria in a static setting. Developing algorithms that converge to these performative equilibria presents unique challenges, as the optimization process itself is constantly modifying the environment and the data used for future iterations.
Primal-Dual Algorithm#
The primal-dual algorithm presented likely addresses the challenge of decentralized optimization within a game-theoretic setting complicated by performative prediction. Decentralization requires each player to optimize locally, using only information from neighbors. The algorithm uses a stochastic approach reflecting uncertainty, and the primal-dual structure manages inequality constraints, crucial given the coupled decision-dependent distributions. The convergence analysis likely demonstrates that, despite the complexities of performative effects and decentralized communication, the algorithm reaches a performatively stable equilibrium within a reasonable time frame. Sublinear convergence rates suggest the algorithm’s efficiency despite the challenges posed by the model. The algorithm’s design cleverly balances the local optimization needs of the players with the global equilibrium goal and handles the performative feedback loop effectively.
Convergence Analysis#
The convergence analysis section of a research paper is crucial for evaluating the effectiveness and efficiency of proposed algorithms. A rigorous convergence analysis typically involves proving that an algorithm’s iterates converge to a solution under specified conditions. Key aspects include establishing convergence rates (e.g., linear, sublinear), identifying conditions for convergence (e.g., strong convexity, smoothness), and potentially analyzing the algorithm’s robustness to noise or perturbations. A well-structured analysis will clearly state the assumptions made, precisely define the notion of convergence used, and provide a detailed mathematical proof of convergence. Demonstrating sublinear convergence might be particularly important in scenarios where computational resources are limited. Furthermore, a comprehensive analysis will likely compare the proposed algorithm’s convergence behavior to existing state-of-the-art methods. Practical considerations, such as the impact of parameter settings on convergence speed, may also be included. Finally, the analysis should be accompanied by numerical experiments, which validate the theoretical results and provide insights into the algorithm’s performance in real-world settings.
Empirical Validation#
An ‘Empirical Validation’ section would ideally present robust evidence supporting the paper’s claims. This would involve a clear description of the experimental setup, including datasets used, metrics employed (and why they were chosen), and a detailed account of the methodology. Rigorous statistical analysis is crucial to establish the significance of any observed effects, avoiding spurious correlations. The results should be presented clearly, perhaps using tables and figures, allowing readers to readily assess the performance. Careful consideration of potential confounding factors and limitations is important, fostering transparency and credibility. Ideally, the empirical validation would go beyond simply demonstrating that the proposed methods work, and also provide comparisons against relevant baselines or existing approaches, demonstrating clear improvements. A discussion of the limitations and future directions of the research is highly valuable.
More visual insights#
More on figures

This figure visualizes the convergence speed of the decentralized stochastic primal-dual algorithm proposed in the paper. The left panel shows the time-average performative regret for five different firms in a networked Cournot game, illustrating how their suboptimality decreases over iterations. The right panel depicts the time-average constraint violation across three different markets, demonstrating that the algorithm effectively manages coupled inequality constraints. Different colors represent different levels of performative strength (ε).

This figure illustrates a networked Cournot game. Five firms (represented by icons of people) compete to sell a commodity in three markets. The lines connecting firms represent the interaction and competition between them. The arrows indicate that the firms distribute their product to each market. The markets are represented by clouds to emphasize their decentralized nature.

This figure shows the demand prices in three different markets (M1, M2, M3) under three different performative strengths (ε = 0.2, 0.4, 0.6). For each performative strength, the demand price for each market is shown for both the performative stable equilibrium (PSE) and Nash equilibrium (NE). The figure illustrates how the demand prices vary across different markets and performative strengths, reflecting the complex interplay between strategic decision-making and endogenous distribution shifts.

The figure shows the convergence of the time-average revenues of three ride-sharing platforms (Uber, Lyft, and Via) over iterations for three different performative strengths (ε = 0.1, 0.2, 0.3). Each line represents the average revenue for a platform, with shaded areas showing standard deviations. The plot illustrates how the average revenue of each platform changes as the algorithm iterates and how this evolution is influenced by the strength of performative effects. Higher ε values tend to produce lower revenues.

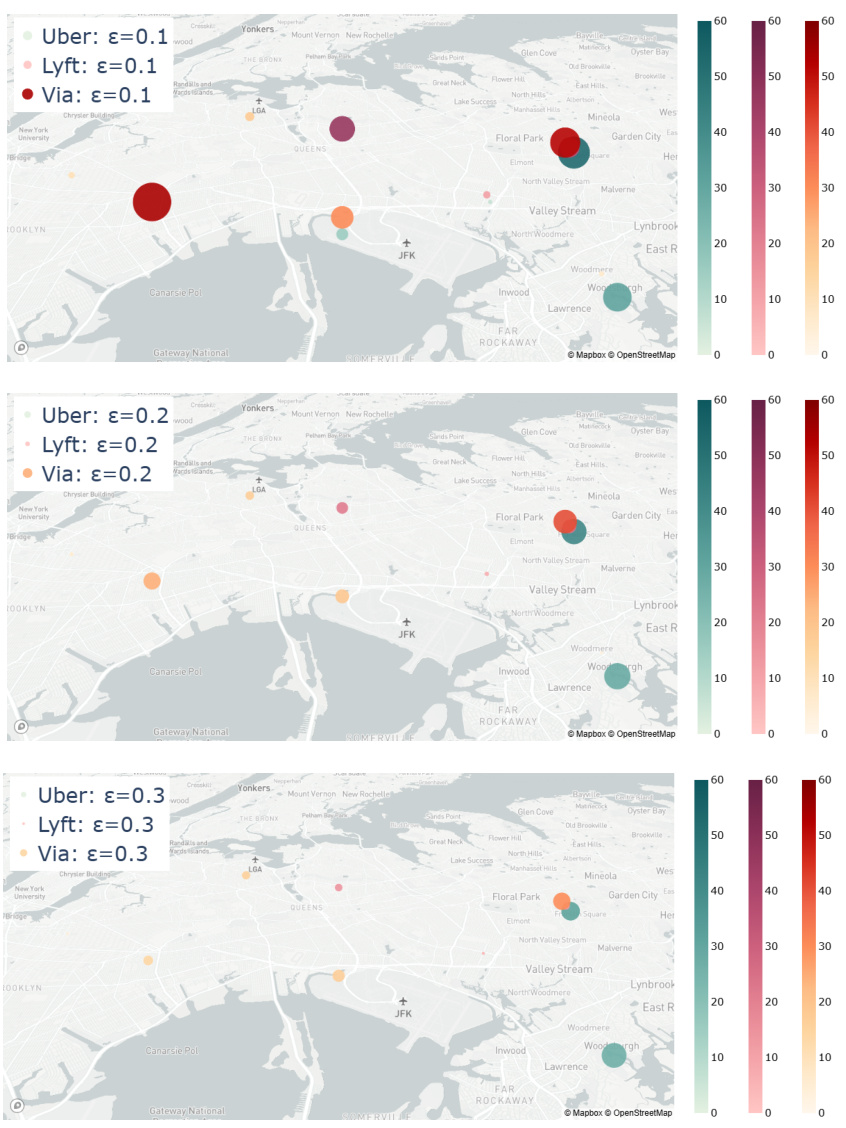
This figure displays the convergence of the time-average constraint violations at eight different areas for three different values of epsilon (0.1, 0.2, and 0.3). The y-axis represents the sum of constraint violations over all iterations, and the x-axis represents the iteration number. Each line represents a different area. The figure visually demonstrates how the constraint violations decrease over time for each area, and how the performative strength (epsilon) might affect the rate of convergence.

This figure displays the normalized distance between the estimated strategy (θ) and the Nash equilibrium strategy (θne) across different iterations. The plot shows how this distance changes over time, with different lines representing different levels of performative strength (ε). The y-axis is on a logarithmic scale, indicating the magnitude of the distance. The x-axis represents the number of iterations of the algorithm. This figure visually demonstrates the convergence of the algorithm to the Nash equilibrium, with the distance between θ and θne decreasing with more iterations, and highlights how the performative strength affects the convergence speed. A larger epsilon value results in a larger distance between the estimated strategy and the Nash equilibrium.

This figure compares the demand prices and ride quantities offered by three ride-sharing platforms (Uber, Lyft, and Via) across eight different areas. It shows the results for two different performative strengths (ε = 0.1 and ε = 0.3), comparing the values obtained at the performative stable equilibrium (PSE) and Nash equilibrium (NE). The goal is to illustrate how the performative strength affects both the pricing and the allocation of rides by the platforms.

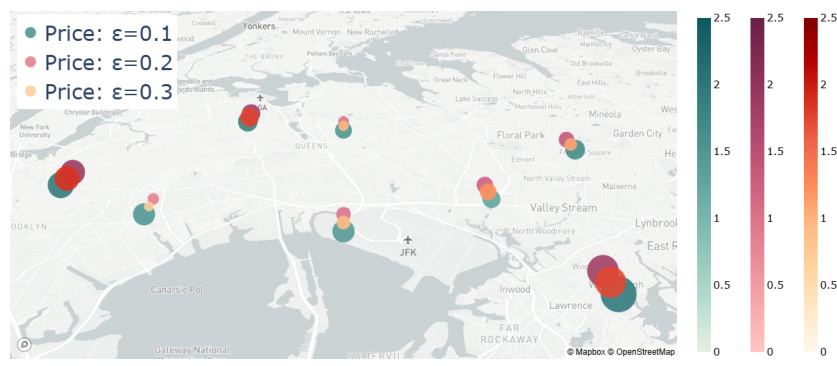
This figure visualizes the demand prices in different areas of New York City for various performative strengths (ε = 0.1, 0.2, and 0.3). The map shows that prices vary across locations, with generally higher prices observed in areas with lower values of ε. The color scale represents the price range, providing a visual representation of price variation across the city and for different performative strengths.

This figure shows the convergence curves of both time-average regrets and time-average constraint violations. The time-average regret represents the suboptimality of the strategy sequence generated by the proposed algorithm, while the time-average constraint violation measures how far the algorithm is from satisfying the constraints. The results demonstrate the sublinear convergence of both metrics, indicating that both the suboptimality and constraint violation decrease over time.

This figure visualizes the demand prices across eight different areas in New York. The prices are shown using a color scale for three different levels of performative strength (ε = 0.1, 0.2, 0.3). The map shows how the demand price varies geographically and how it is affected by the strength of performativity. Higher performative strength appears to lead to slightly lower prices.

The figure displays the convergence curves of time-average regrets for five firms and time-average constraint violations across three markets. The x-axis represents the number of iterations, and the y-axis represents the values of the time-average regrets and the time-average constraint violations. Each line corresponds to a specific firm or market, showcasing how the algorithm’s performance improves over time. This visualization demonstrates the algorithm’s ability to reduce both sub-optimality of decisions (performative regret) and violations of coupled inequality constraints, central to the decentralized noncooperative game framework studied in the paper.
Full paper#


