TL;DR#
Attributing the influence of specific training images on a given output image from a complex text-to-image model is computationally expensive. Existing methods either rely on approximations that lack accuracy or involve extensive retraining. This problem limits our understanding of how these models function and hinders efforts to address issues such as bias and overfitting.
This paper tackles this challenge by proposing a novel data attribution method that leverages machine unlearning. Instead of retraining the model repeatedly to assess the importance of individual training images, the researchers cleverly simulate the effect of removing an output image from the model’s training data. This is done by increasing the training loss for that specific output image while preserving the model’s ability to generate other, unrelated images. The method then identifies influential training images by examining which show significant loss deviations after this simulated unlearning process. Through rigorous experiments and comparison to existing methods, the researchers demonstrate the effectiveness of this innovative approach. The work pushes the boundaries of data attribution methods, providing a more efficient and accurate solution with considerable implications for the field of generative modeling.
Key Takeaways#
Why does it matter?#
This paper is crucial for researchers working on data attribution for text-to-image models. It introduces a novel and efficient method that significantly improves the accuracy and practicality of identifying influential training images. This is a key challenge in understanding and improving these models, with implications for model transparency, bias detection, and ethical considerations.
Visual Insights#
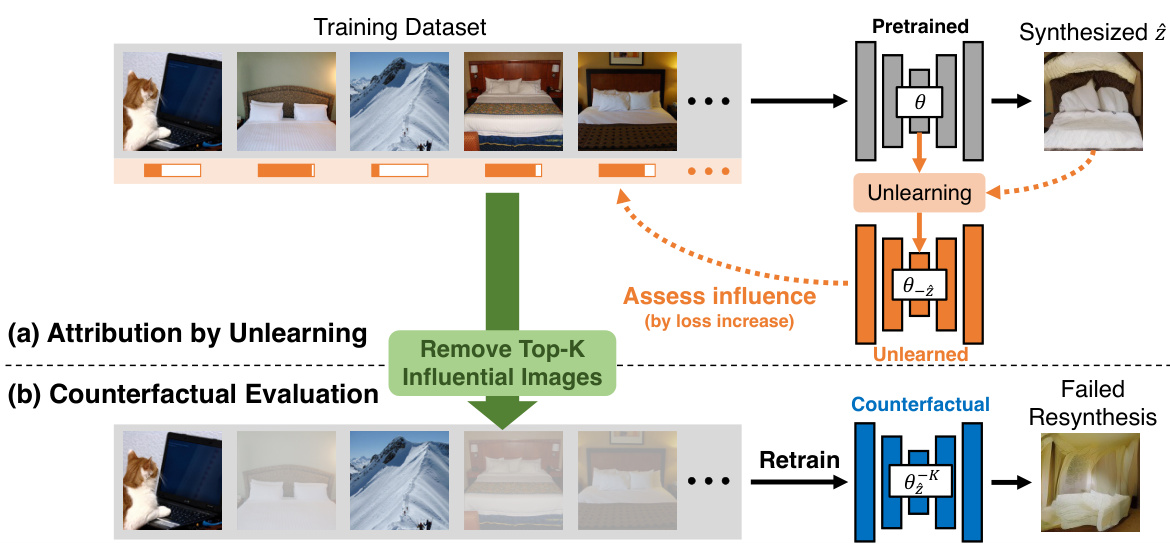
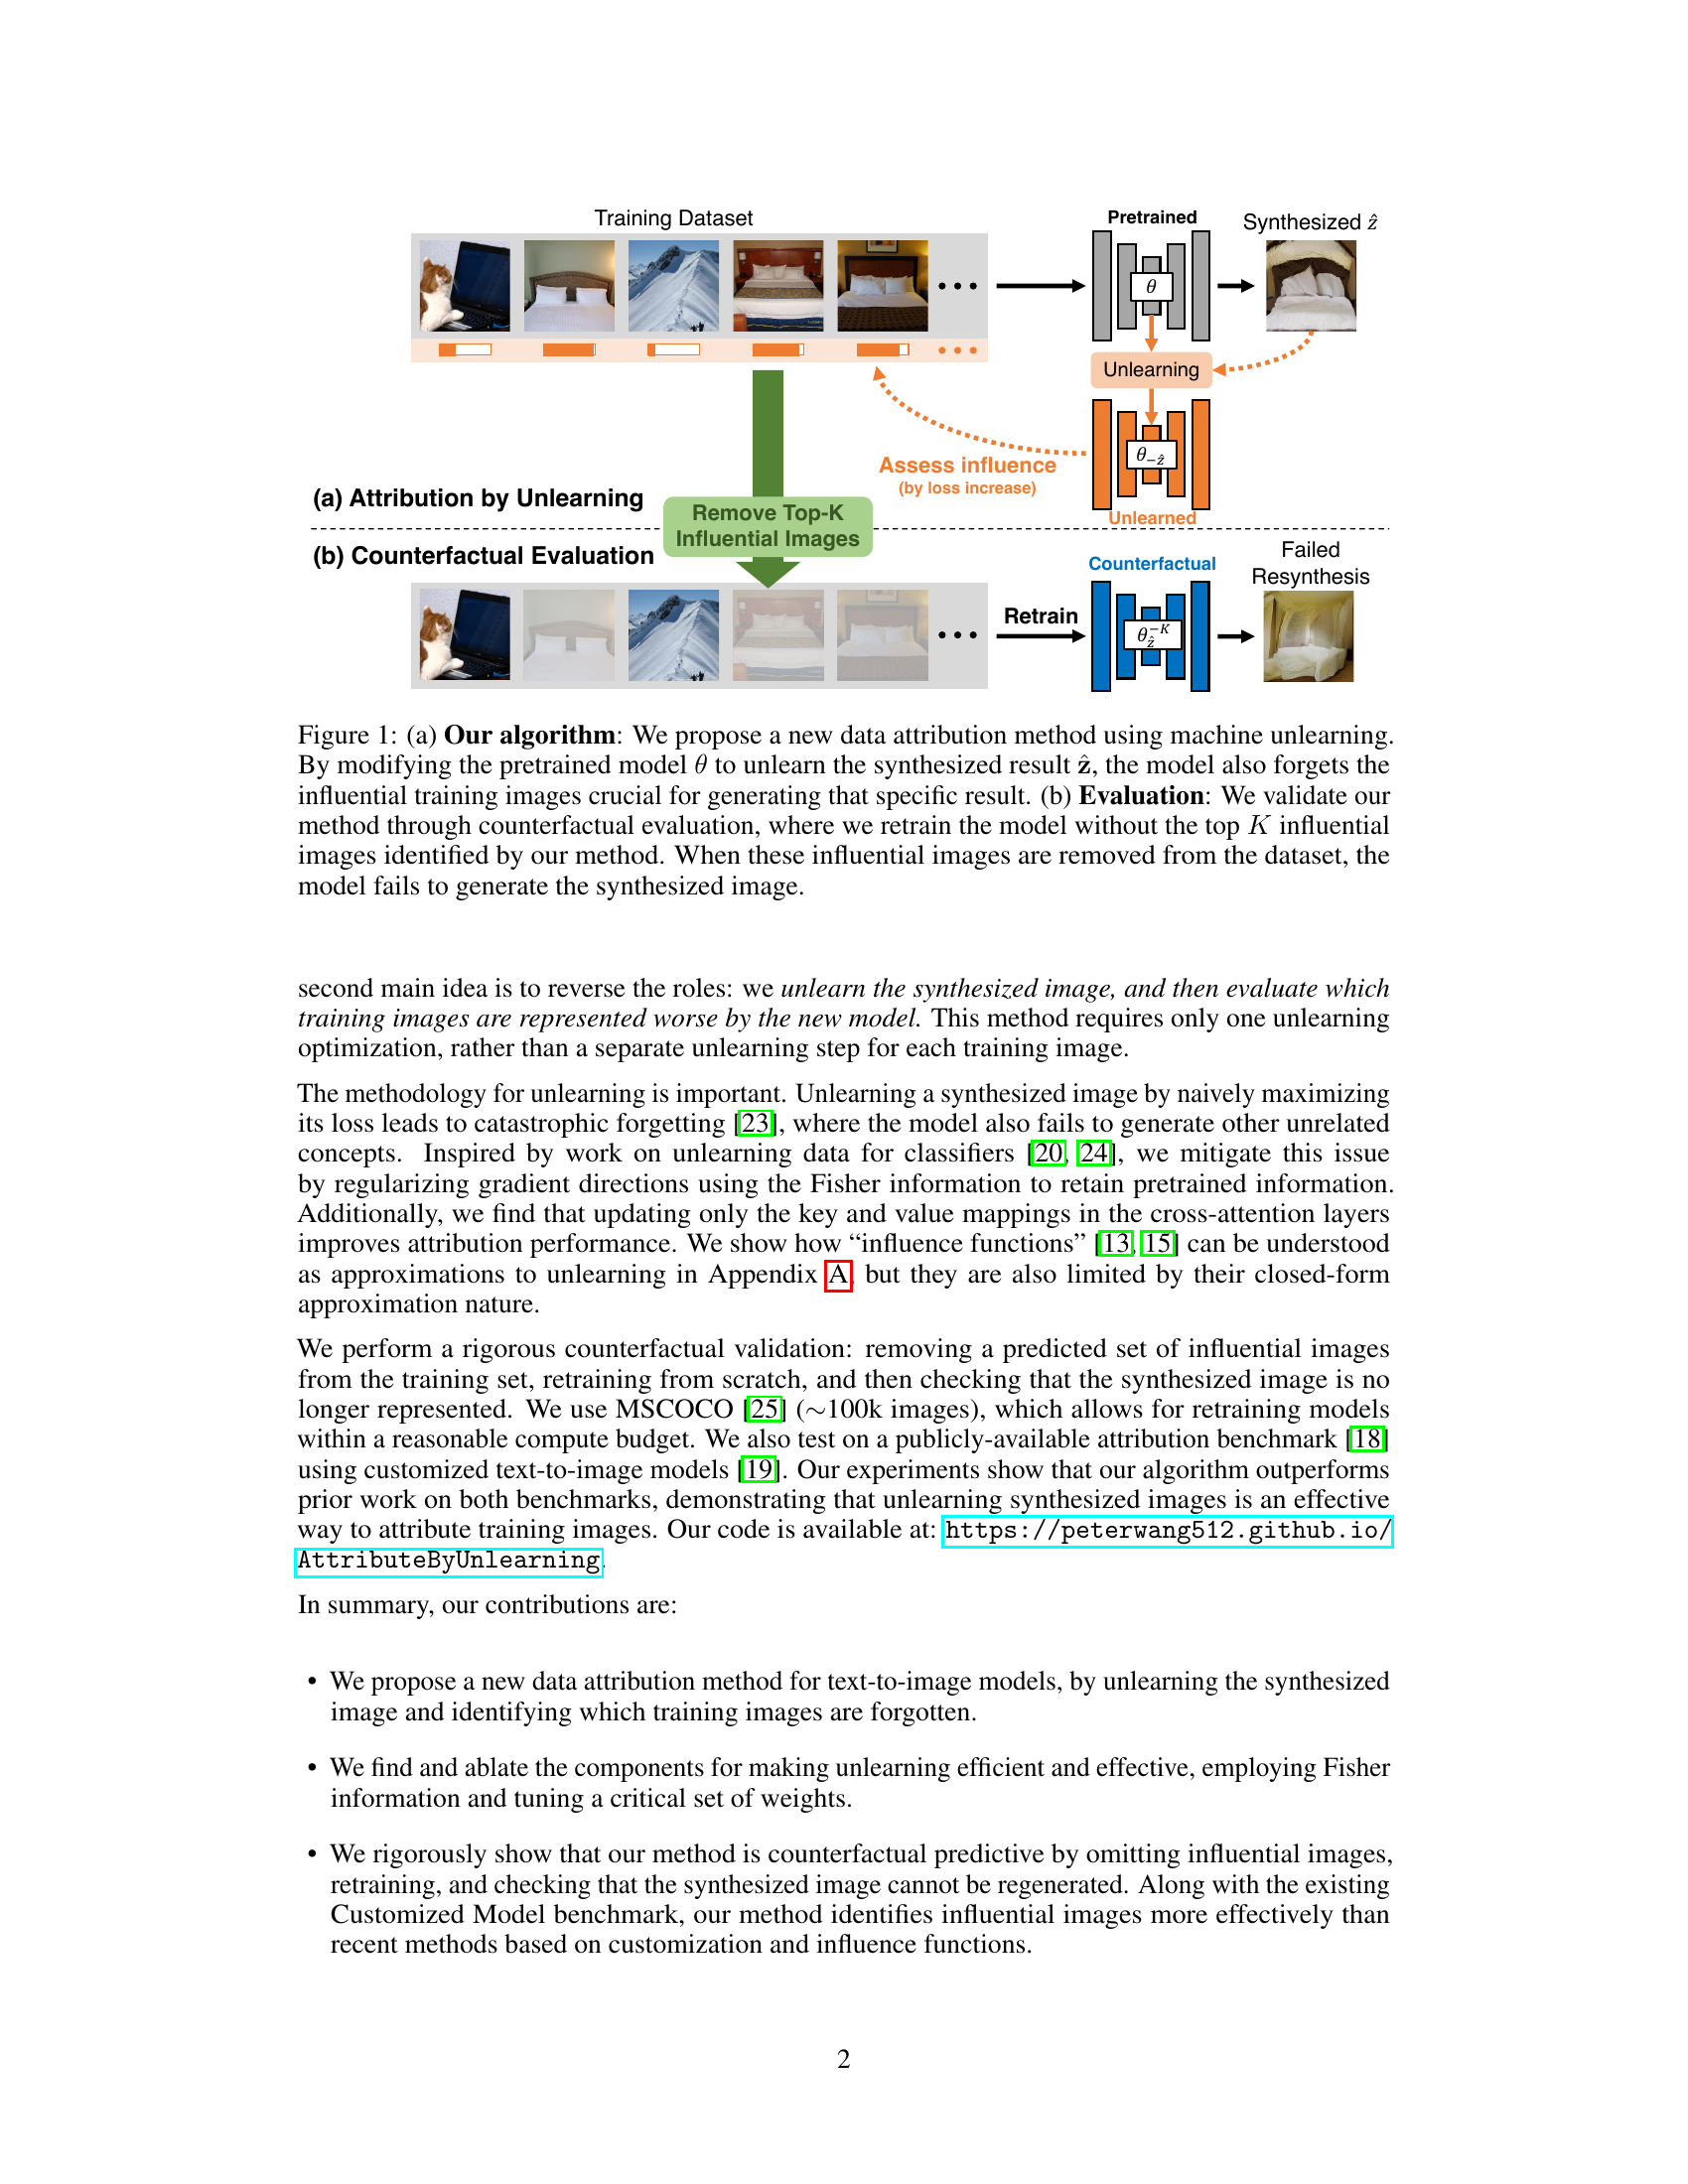
🔼 This figure illustrates the proposed data attribution method and its evaluation. Panel (a) shows the core of the algorithm: a pre-trained model is used to generate a synthesized image. Then, an ‘unlearning’ process modifies the model to increase the loss on this generated image. The images from the training set that caused significant changes in loss after this unlearning process are identified as influential for generating that specific synthesized image. Panel (b) demonstrates how the method is evaluated. The top K most influential images are removed from the training dataset and the model is retrained from scratch. If the model can no longer generate the initial synthesized image, then the attribution method is considered successful.
read the caption
Figure 1: (a) Our algorithm: We propose a new data attribution method using machine unlearning. By modifying the pretrained model θ to unlearn the synthesized result z, the model also forgets the influential training images crucial for generating that specific result. (b) Evaluation: We validate our method through counterfactual evaluation, where we retrain the model without the top K influential images identified by our method. When these influential images are removed from the dataset, the model fails to generate the synthesized image.
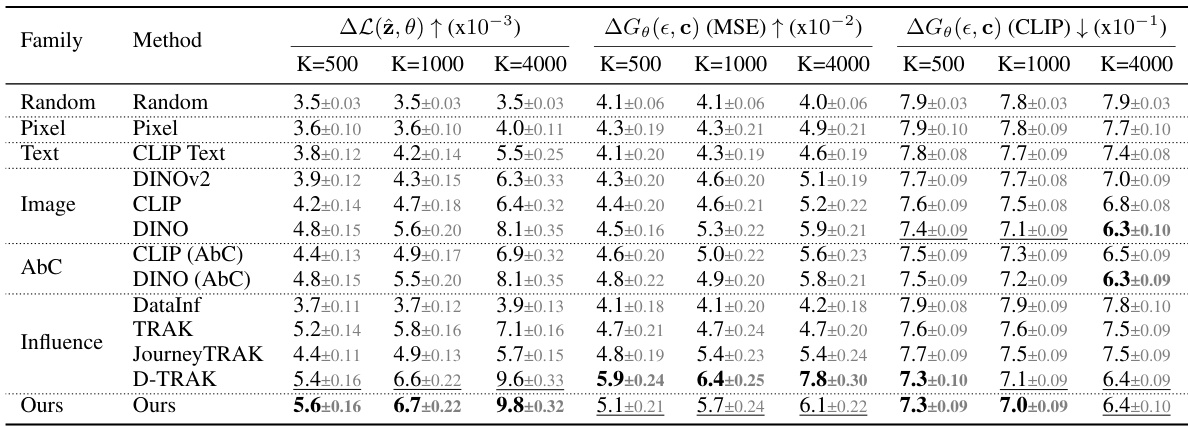
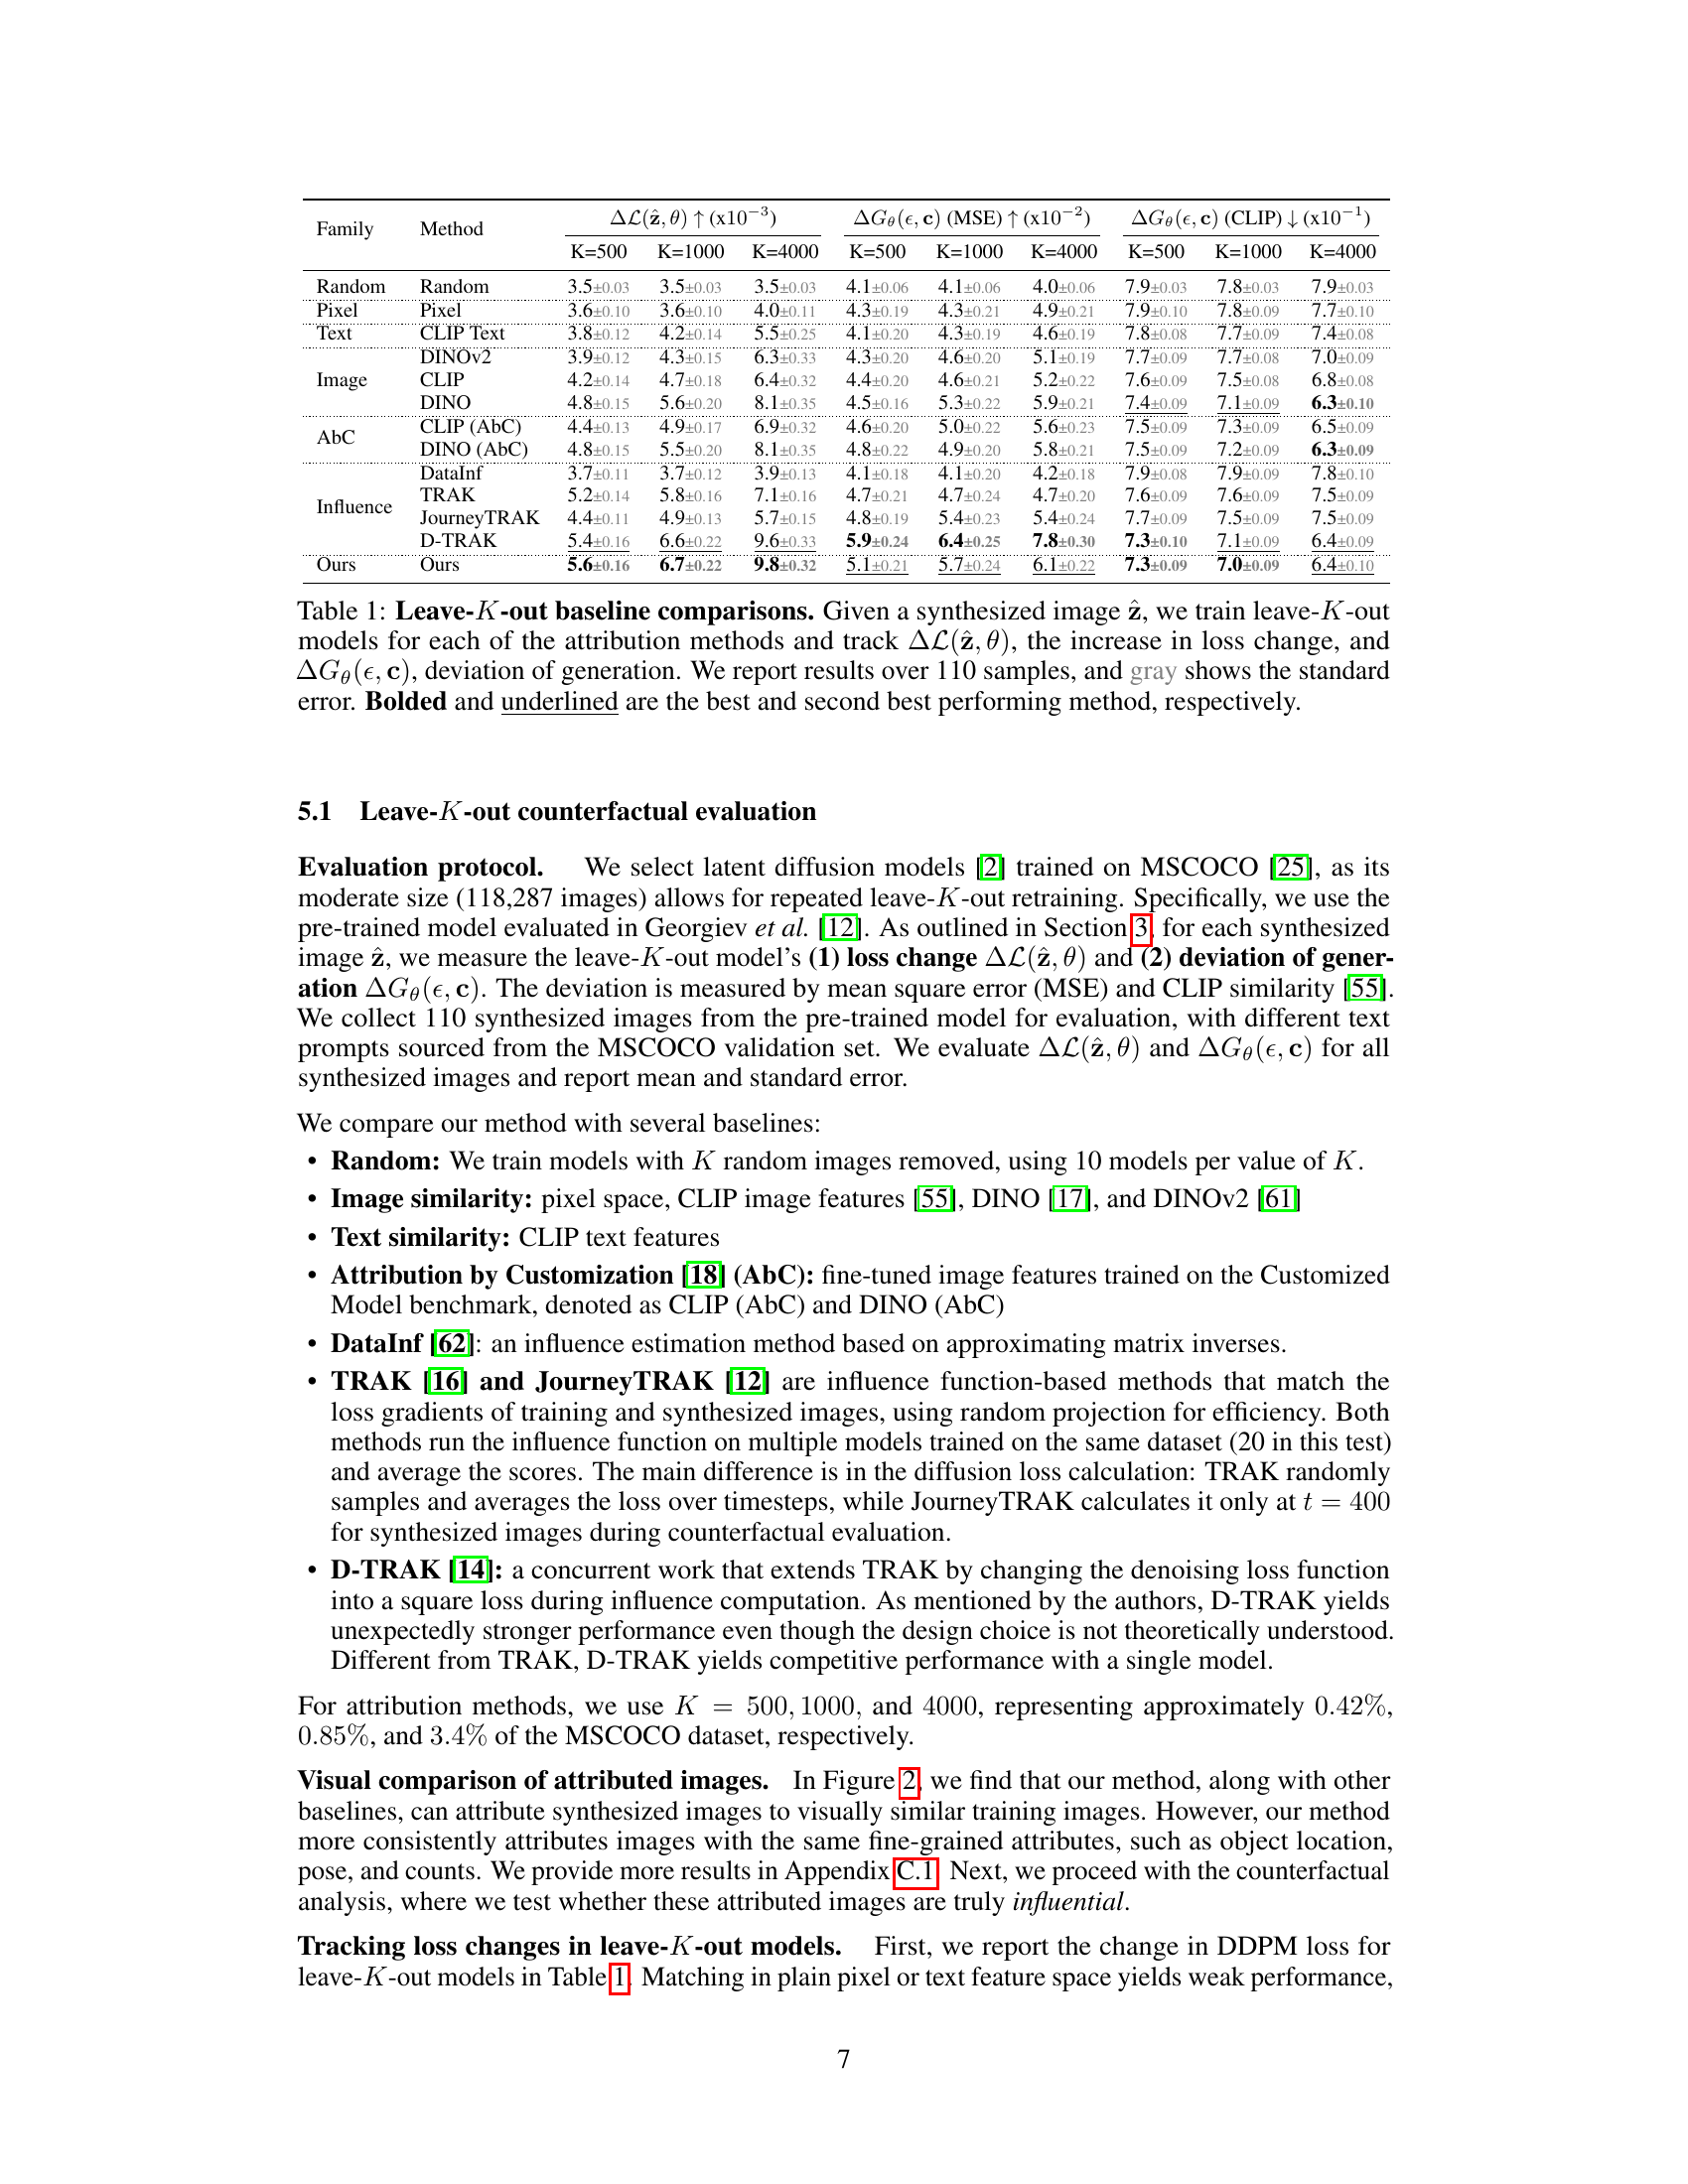
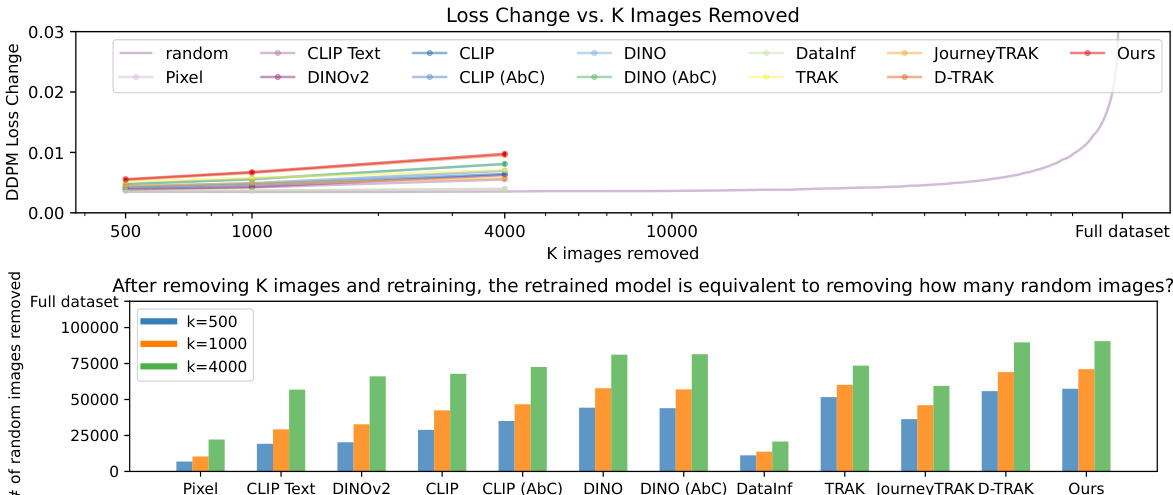
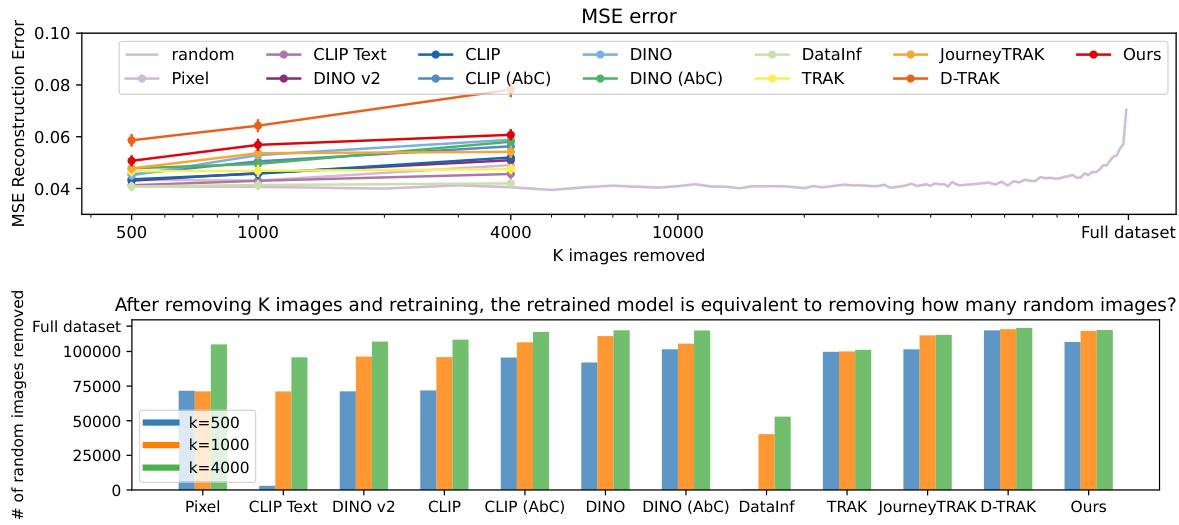
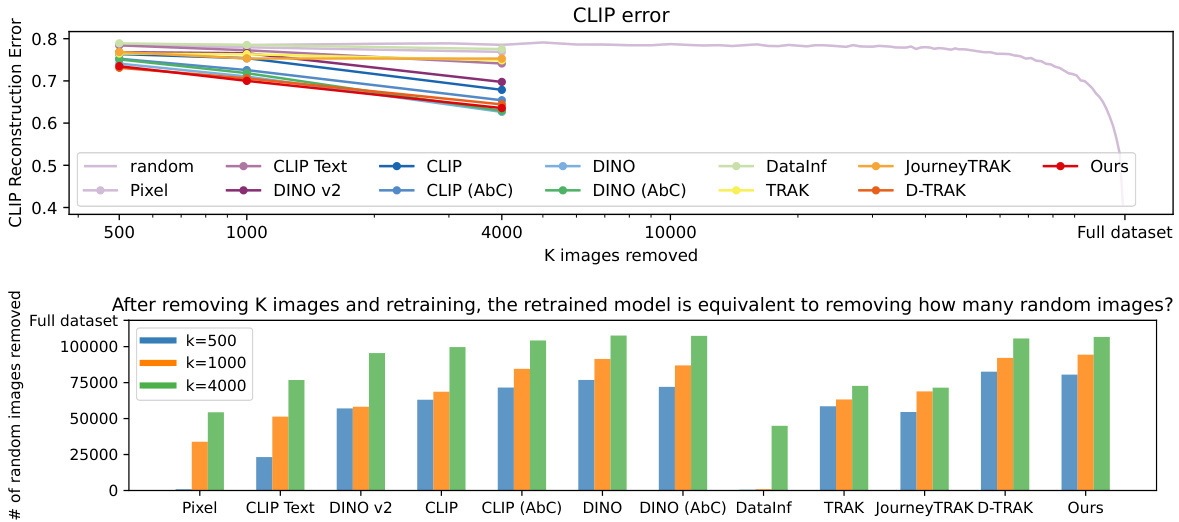
🔼 This table presents a comparison of different data attribution methods using a leave-K-out evaluation strategy. The methods are compared based on two metrics: the change in loss ((\Delta L(\hat{z}, \theta))) after removing K influential images and the deviation in generated images ((\Delta G_\theta(\epsilon, c))). Higher (\Delta L(\hat{z}, \theta)) indicates better identification of influential images, while higher deviation in generated images (measured using MSE and CLIP similarity) suggests less accurate predictions. The table shows results for different values of K, allowing analysis of method performance across varying levels of image removal.
read the caption
Table 1: Leave-K-out baseline comparisons. Given a synthesized image \(\hat{z}\), we train leave-K-out models for each of the attribution methods and track \(\Delta L(\hat{z}, \theta)\), the increase in loss change, and \(\Delta G_\theta(\epsilon, c)\), deviation of generation. We report results over 110 samples, and gray shows the standard error. Bolded and underlined are the best and second best performing method, respectively.
In-depth insights#
Unlearning Approach#
The core of this research lies in its novel “unlearning” approach for data attribution in text-to-image models. Instead of retraining from scratch (a computationally expensive method), the authors cleverly simulate unlearning the synthesized output image by directly manipulating the model’s parameters. This involves carefully increasing the training loss associated with that specific output, thereby causing the model to “forget” it during subsequent generations. Crucially, the method incorporates techniques to prevent catastrophic forgetting – maintaining the model’s ability to generate images for other concepts. The influence of training images is then assessed based on how significantly their associated losses deviate after this targeted unlearning process. This method is a significant advancement over existing closed-form approximation techniques and offers a more intuitive counterfactual evaluation approach. The use of Fisher information for regularization further enhances the stability and efficiency of the unlearning process, demonstrating a practically feasible and effective alternative to computationally intensive re-training approaches. The approach’s effectiveness is rigorously validated by comparing it with a computationally intensive gold standard, and its superior performance in different scenarios clearly highlights its contributions to data attribution. The thoughtful combination of unlearning and regularization results in a robust and efficient method for investigating the influence of training data on text-to-image models.
Attribution Metrics#
The concept of “Attribution Metrics” in a research paper analyzing text-to-image models would likely involve evaluating how effectively a model assigns credit to individual training images for generating a specific output image. This involves exploring various quantitative metrics such as those based on loss functions, image similarity, or feature matching. A robust evaluation might compare different methods, considering aspects like computational cost and the accuracy of attribution as revealed through counterfactual analysis (retraining the model without attributed images). A thoughtful analysis would also explore qualitative aspects, examining the visual characteristics and semantic relationships between attributed images and the generated image. Ultimately, a comprehensive assessment would involve discussions of the metrics’ strengths and weaknesses, their potential biases, and the extent to which they reflect an intuitive sense of influence, aligning with a counterfactual definition of data impact.
Counterfactual Tests#
Counterfactual tests are crucial for validating data attribution methods in text-to-image models. They assess whether removing the images deemed most influential by an attribution algorithm truly impacts the model’s ability to generate a specific image. A true counterfactual test involves retraining the model from scratch, excluding these identified images. Success is determined by the model’s inability to regenerate the same output after retraining, confirming the identified images’ true influence. The computational cost of such retraining is a major hurdle; approximations like influence functions are often used instead, but may not be fully reliable. Therefore, rigorous counterfactual evaluation, though expensive, is a gold standard for evaluating the efficacy of data attribution, particularly as it directly addresses the counterfactual nature of influence. This approach provides more confidence in the accuracy and reliability of the attribution method compared to simpler correlation-based approaches.
Influence Function Link#
An ‘Influence Function Link’ in a research paper would likely explore the connection between influence functions and another method or concept. Influence functions, which quantify the effect of individual training data points on a model’s prediction, could be linked to techniques like unlearning, where data points are effectively removed from the model. The link might demonstrate how the influence function can approximate the effect of unlearning, or it could show how influence functions can be used to interpret the results of an unlearning procedure, providing a better understanding of which data points were most influential. It might also compare the computational cost of directly applying influence functions versus using an unlearning approach, potentially showing that unlearning offers a more practical solution for large datasets. Such a connection would highlight both the theoretical and practical implications of influence functions and how they relate to the broader field of data attribution and model interpretability. The efficiency and accuracy of each method, particularly when dealing with large-scale models, could be a central focus.
Future Directions#
Future research could explore more sophisticated unlearning techniques that mitigate catastrophic forgetting more effectively, enabling the removal of larger sets of influential images without impacting the model’s performance on other concepts. A deeper investigation into the relationship between unlearning, influence functions, and other attribution methods would provide valuable insights into the strengths and weaknesses of each approach. The development of efficient algorithms that can perform counterfactual analysis at scale is crucial to enable more widespread adoption of influence estimation methods for large models. Furthermore, researching techniques that allow for localized attribution—attributing specific features or aspects of the generated image to particular training images—would enhance the utility of attribution for understanding and improving generative models. Finally, investigating the impact of dataset biases on the attribution process, as well as developing techniques for identifying and mitigating these biases, are essential for creating more robust and fair models.
More visual insights#
More on figures

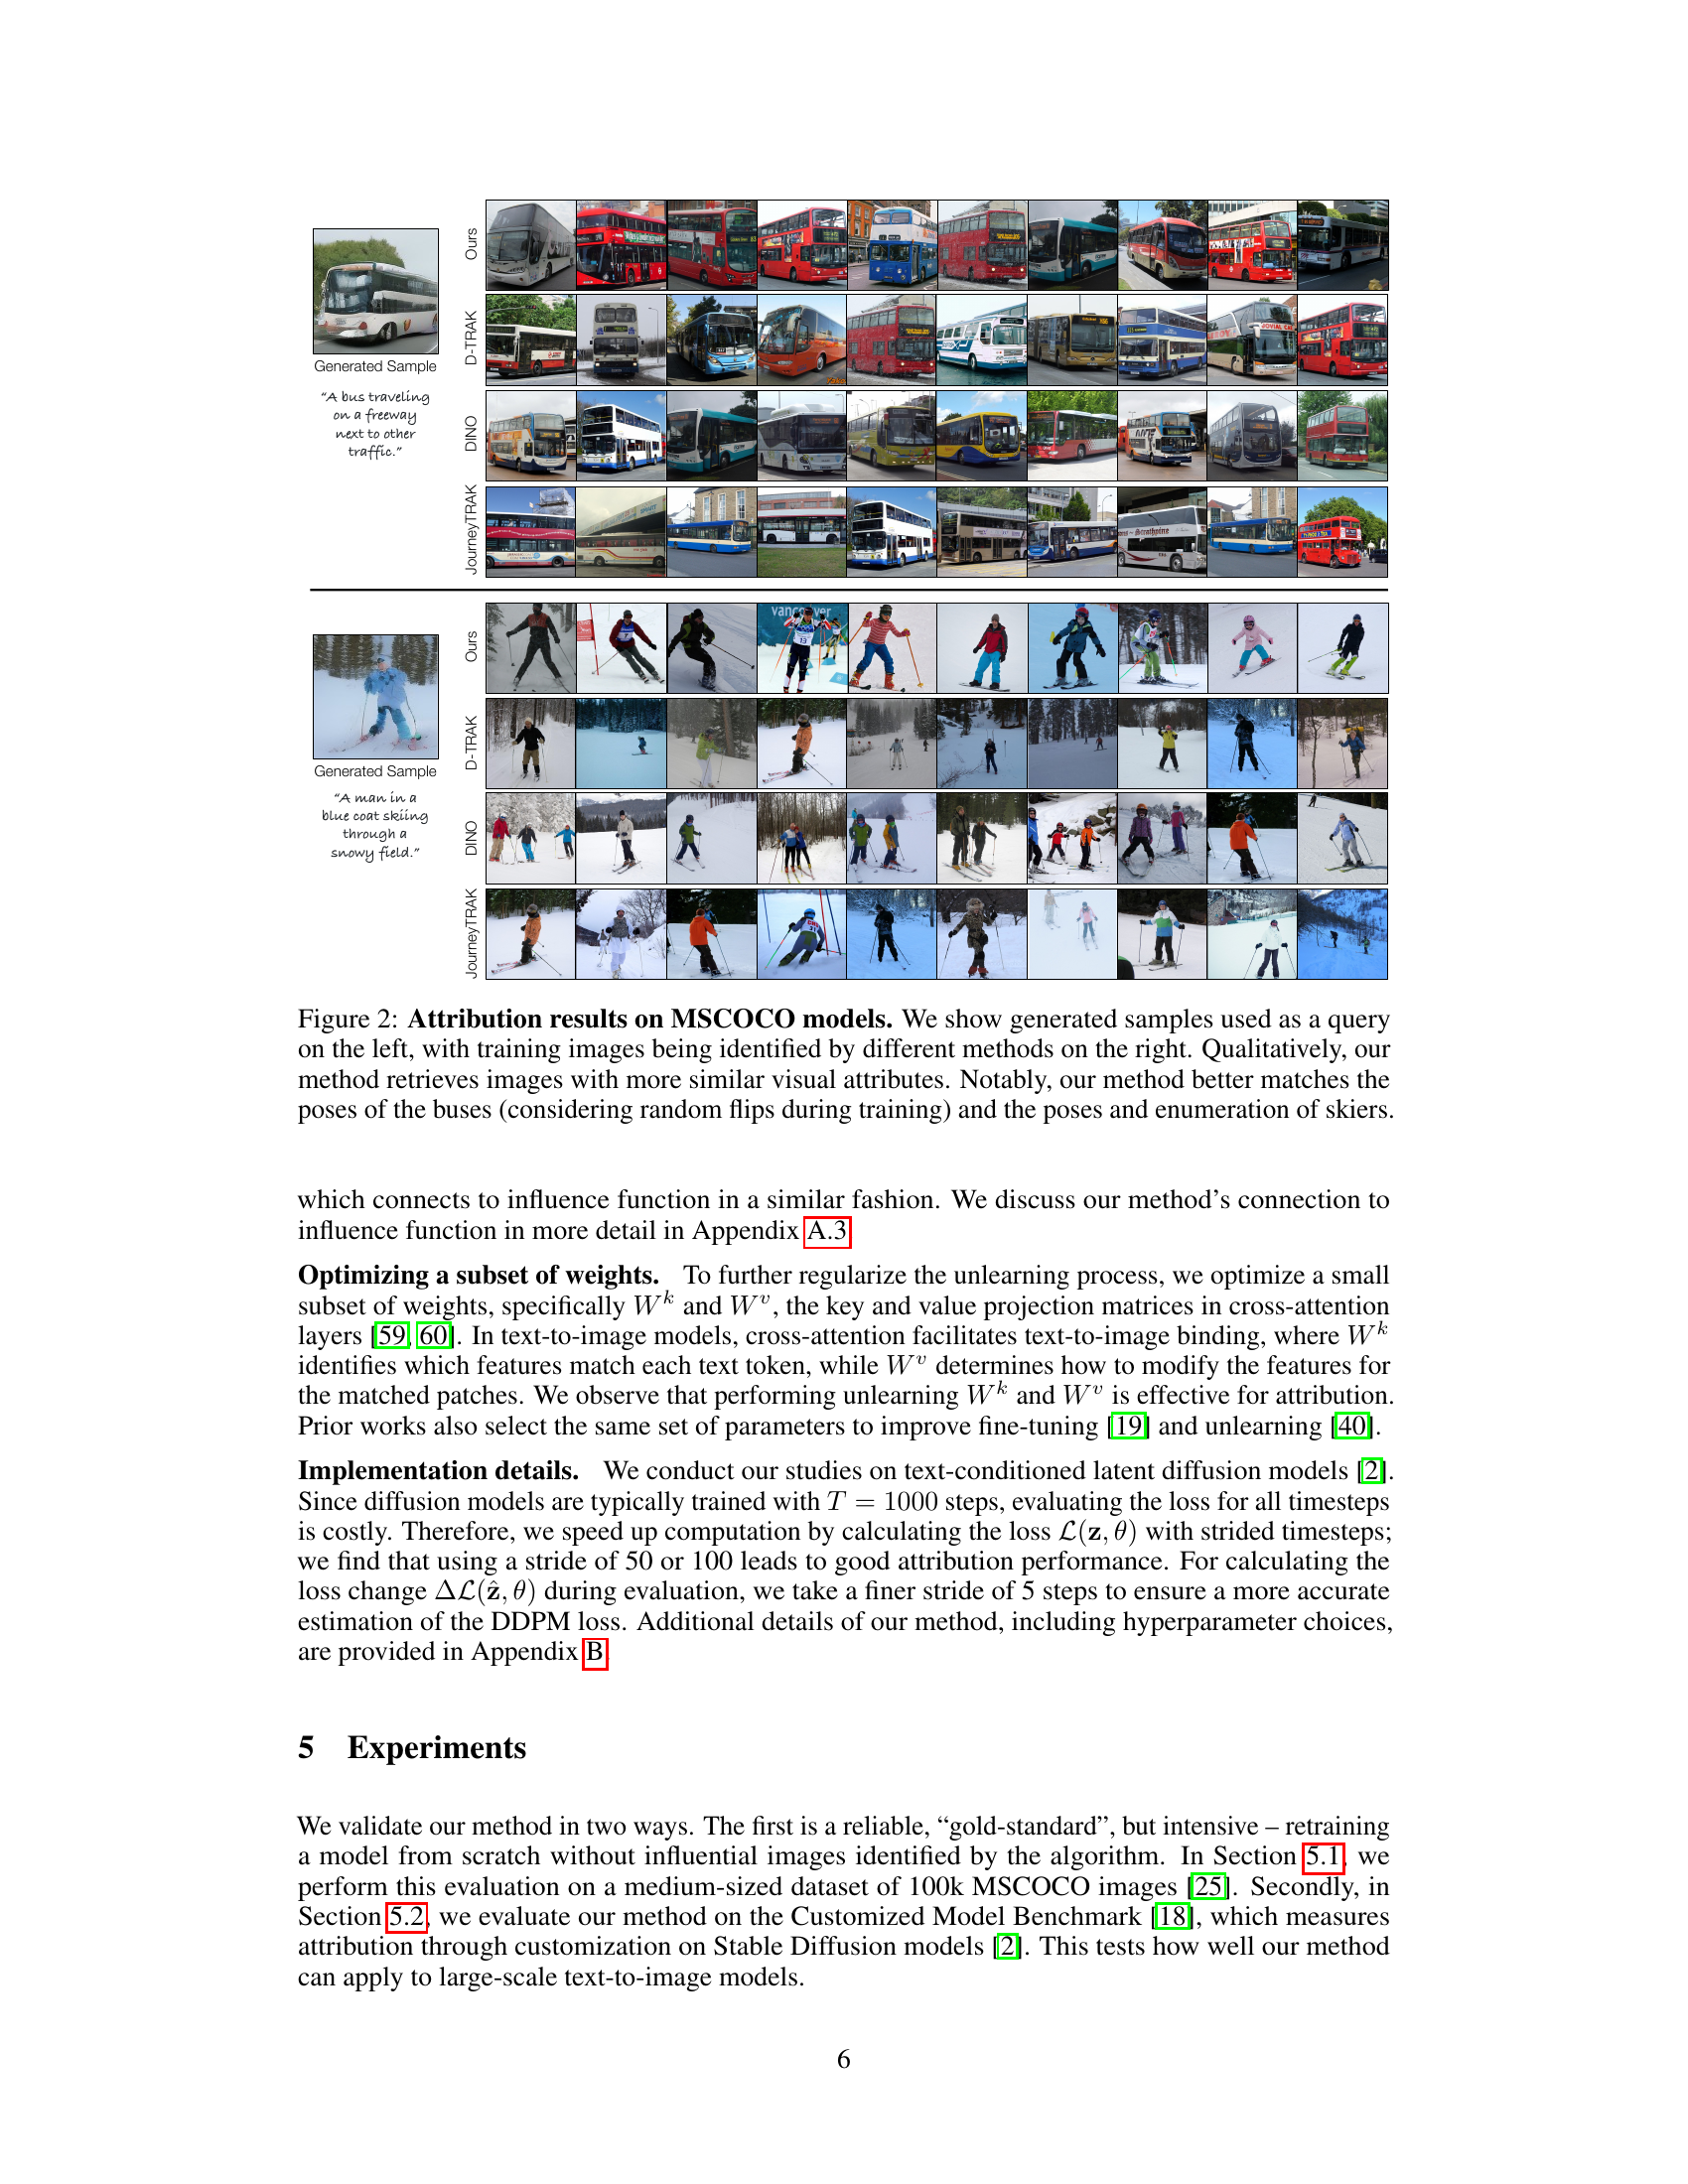
🔼 This figure displays a qualitative comparison of data attribution results from different methods on MSCOCO models. For two generated images (a bus and skiers), the figure shows the training images identified as influential by four attribution methods: Ours, D-TRAK, DINO, and JourneyTRAK. The comparison highlights that the proposed method (‘Ours’) tends to identify training images with more visually similar attributes compared to other methods, particularly regarding poses and object counts.
read the caption
Figure 2: Attribution results on MSCOCO models. We show generated samples used as a query on the left, with training images being identified by different methods on the right. Qualitatively, our method retrieves images with more similar visual attributes. Notably, our method better matches the poses of the buses (considering random flips during training) and the poses and enumeration of skiers.
🔼 This figure shows a qualitative comparison of the data attribution results from different methods (Ours, D-TRAK, DINO, JourneyTRAK) on two examples of text-to-image generation using MSCOCO models. For each example, a generated image is shown on the left. On the right, the training images identified as most influential by each method are displayed. The results visually demonstrate that the proposed method (‘Ours’) tends to select training images that are more visually similar to the generated image than the other compared methods, especially regarding object poses.
read the caption
Figure 2: Attribution results on MSCOCO models. We show generated samples used as a query on the left, with training images being identified by different methods on the right. Qualitatively, our method retrieves images with more similar visual attributes. Notably, our method better matches the poses of the buses (considering random flips during training) and the poses and enumeration of skiers.
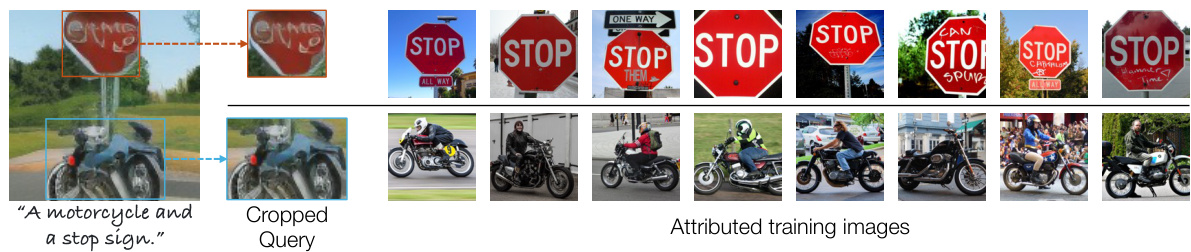
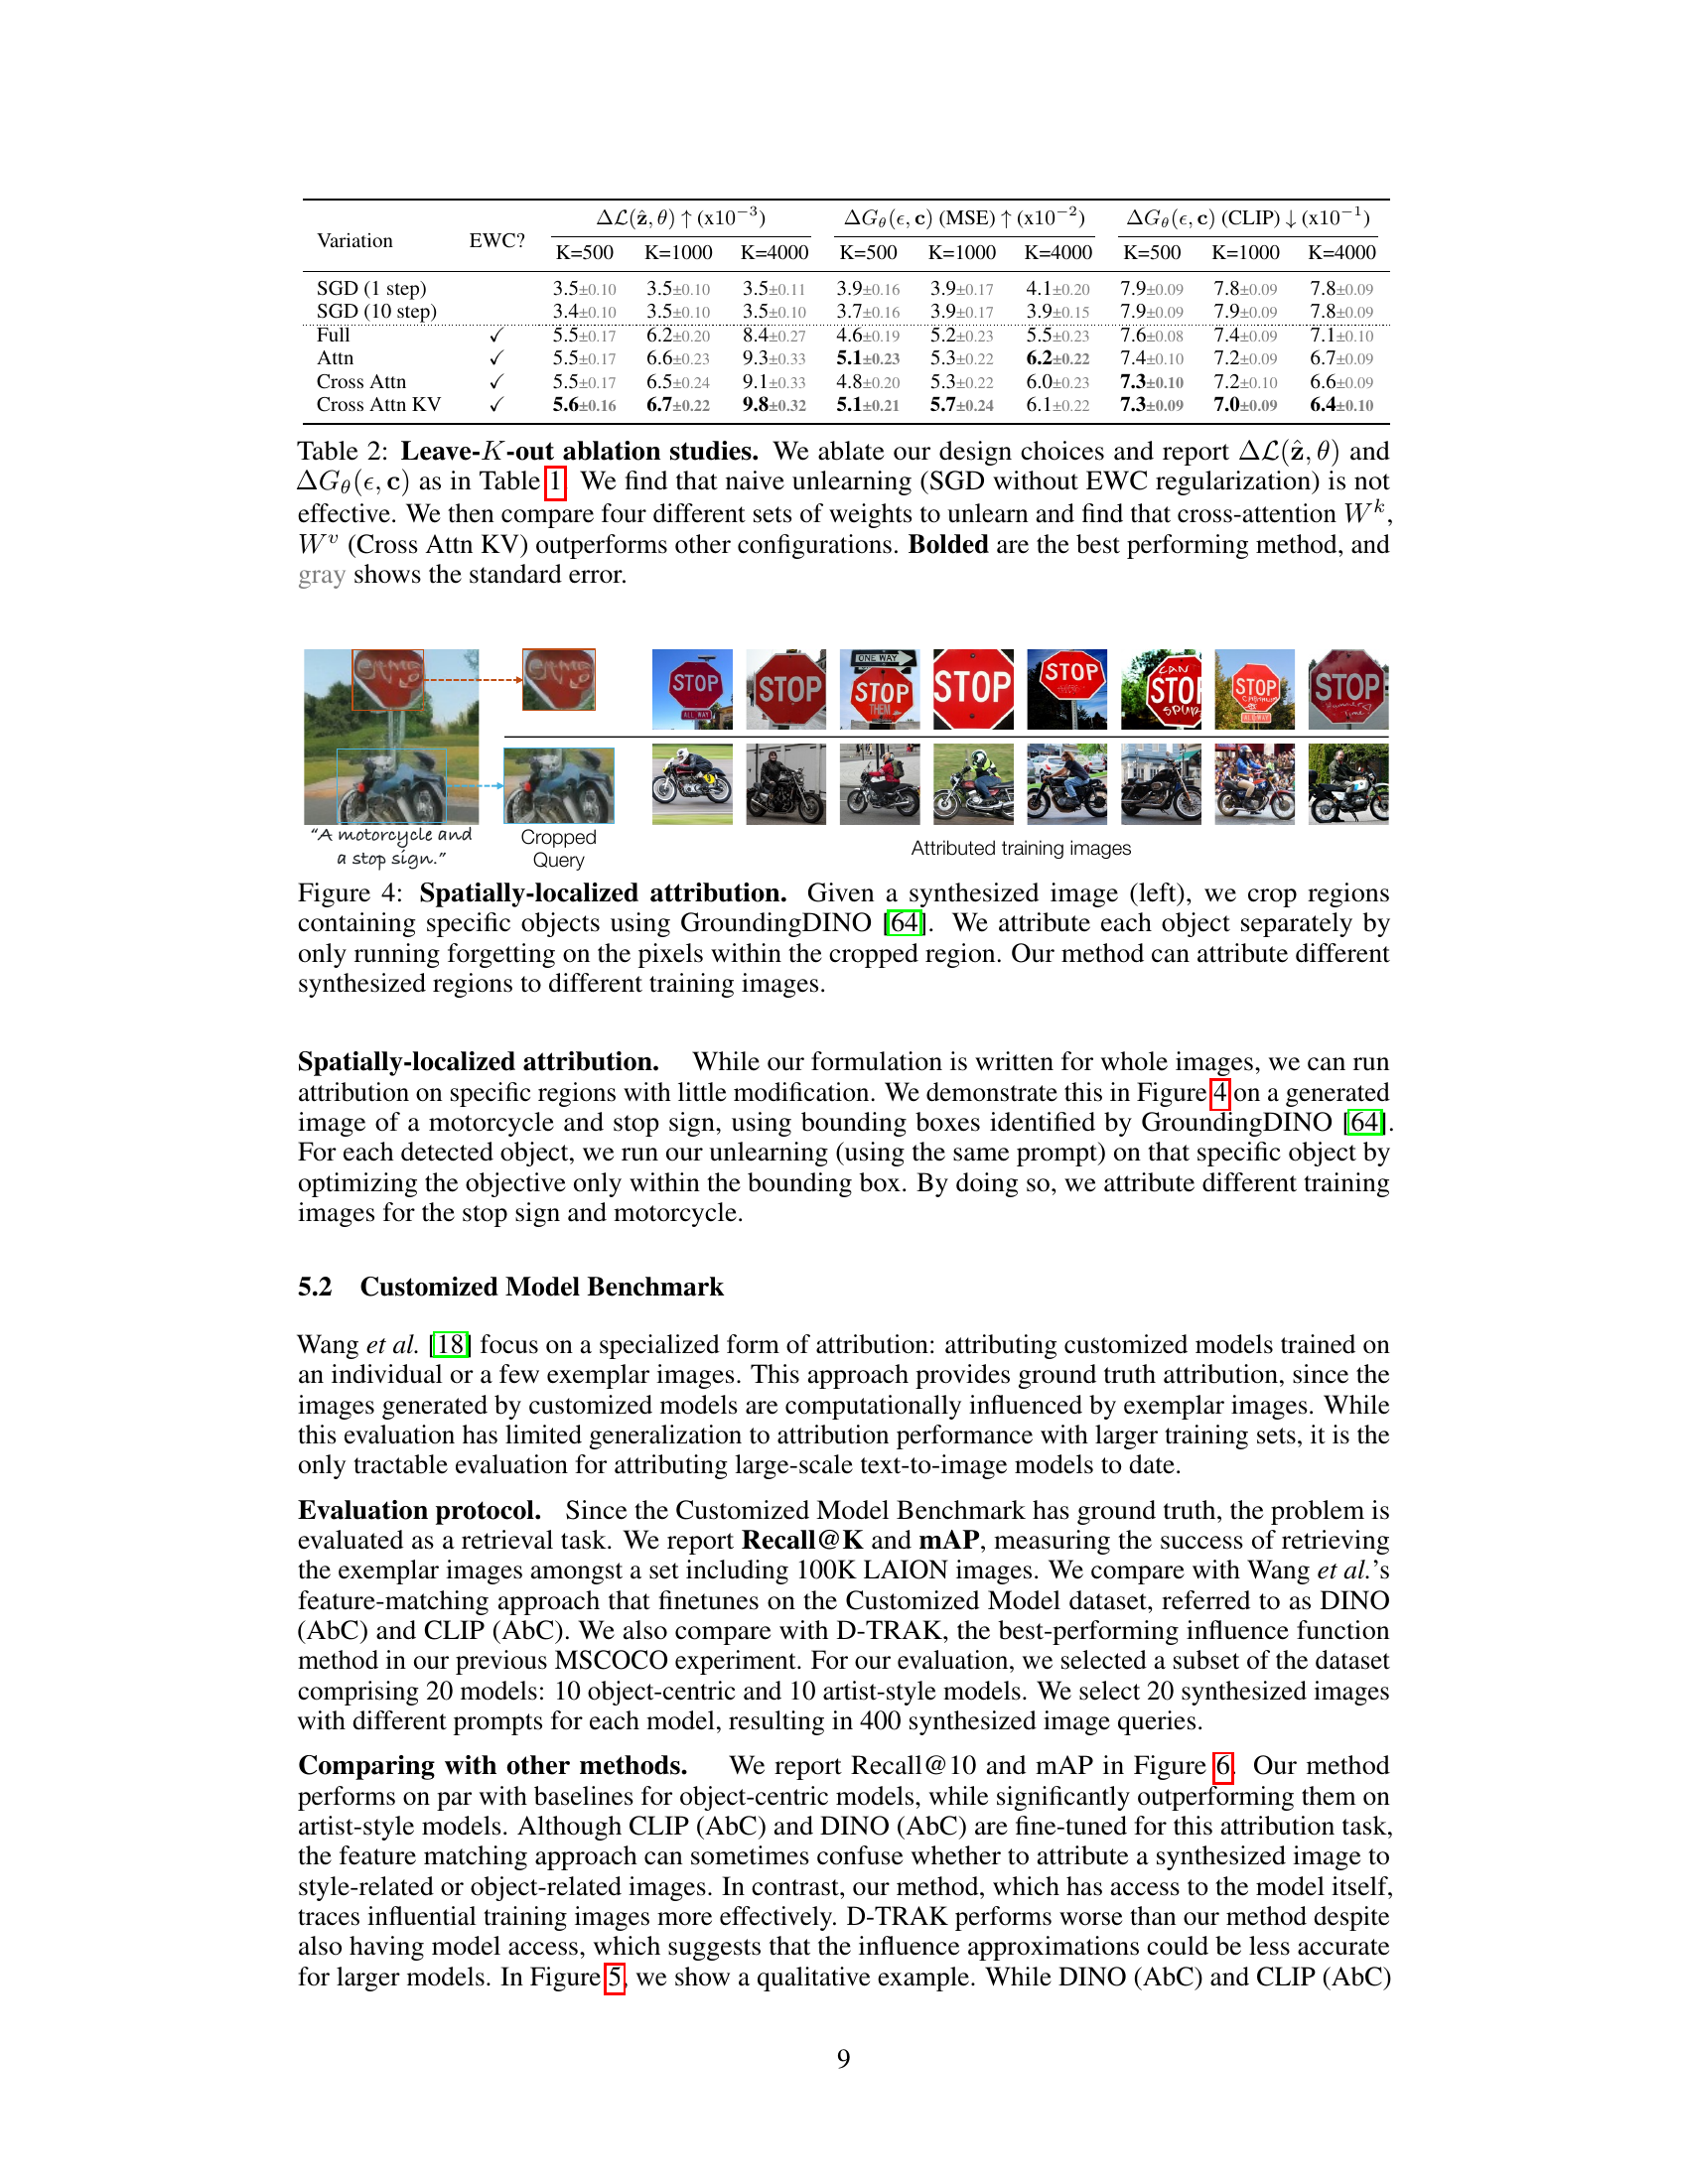
🔼 This figure demonstrates the spatially-localized attribution capability of the proposed method. It shows a synthesized image containing a motorcycle and a stop sign. Using bounding boxes from GroundingDINO, the model separately attributes regions of the image to different training images. The stop sign is matched with training images of similar stop signs, and the motorcycle is matched with images of motorcycles. This highlights the method’s ability to identify fine-grained influences from specific image regions rather than just assigning influence to the whole image.
read the caption
Figure 4: Spatially-localized attribution. Given a synthesized image (left), we crop regions containing specific objects using GroundingDINO [64]. We attribute each object separately by only running forgetting on the pixels within the cropped region. Our method can attribute different synthesized regions to different training images.
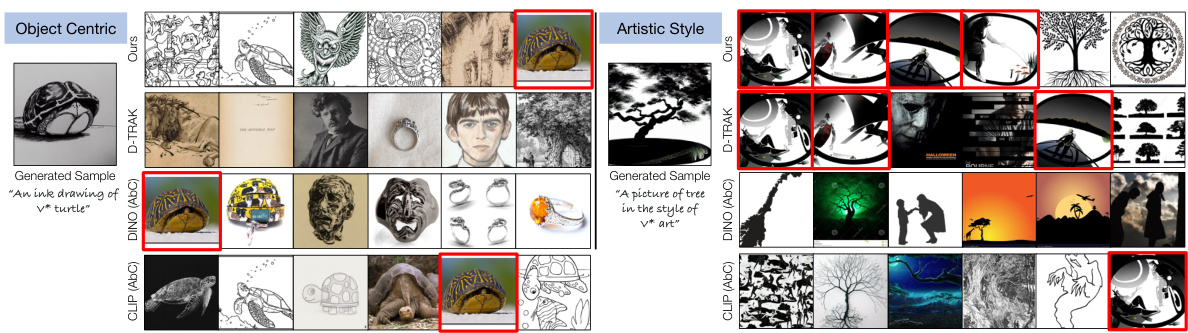
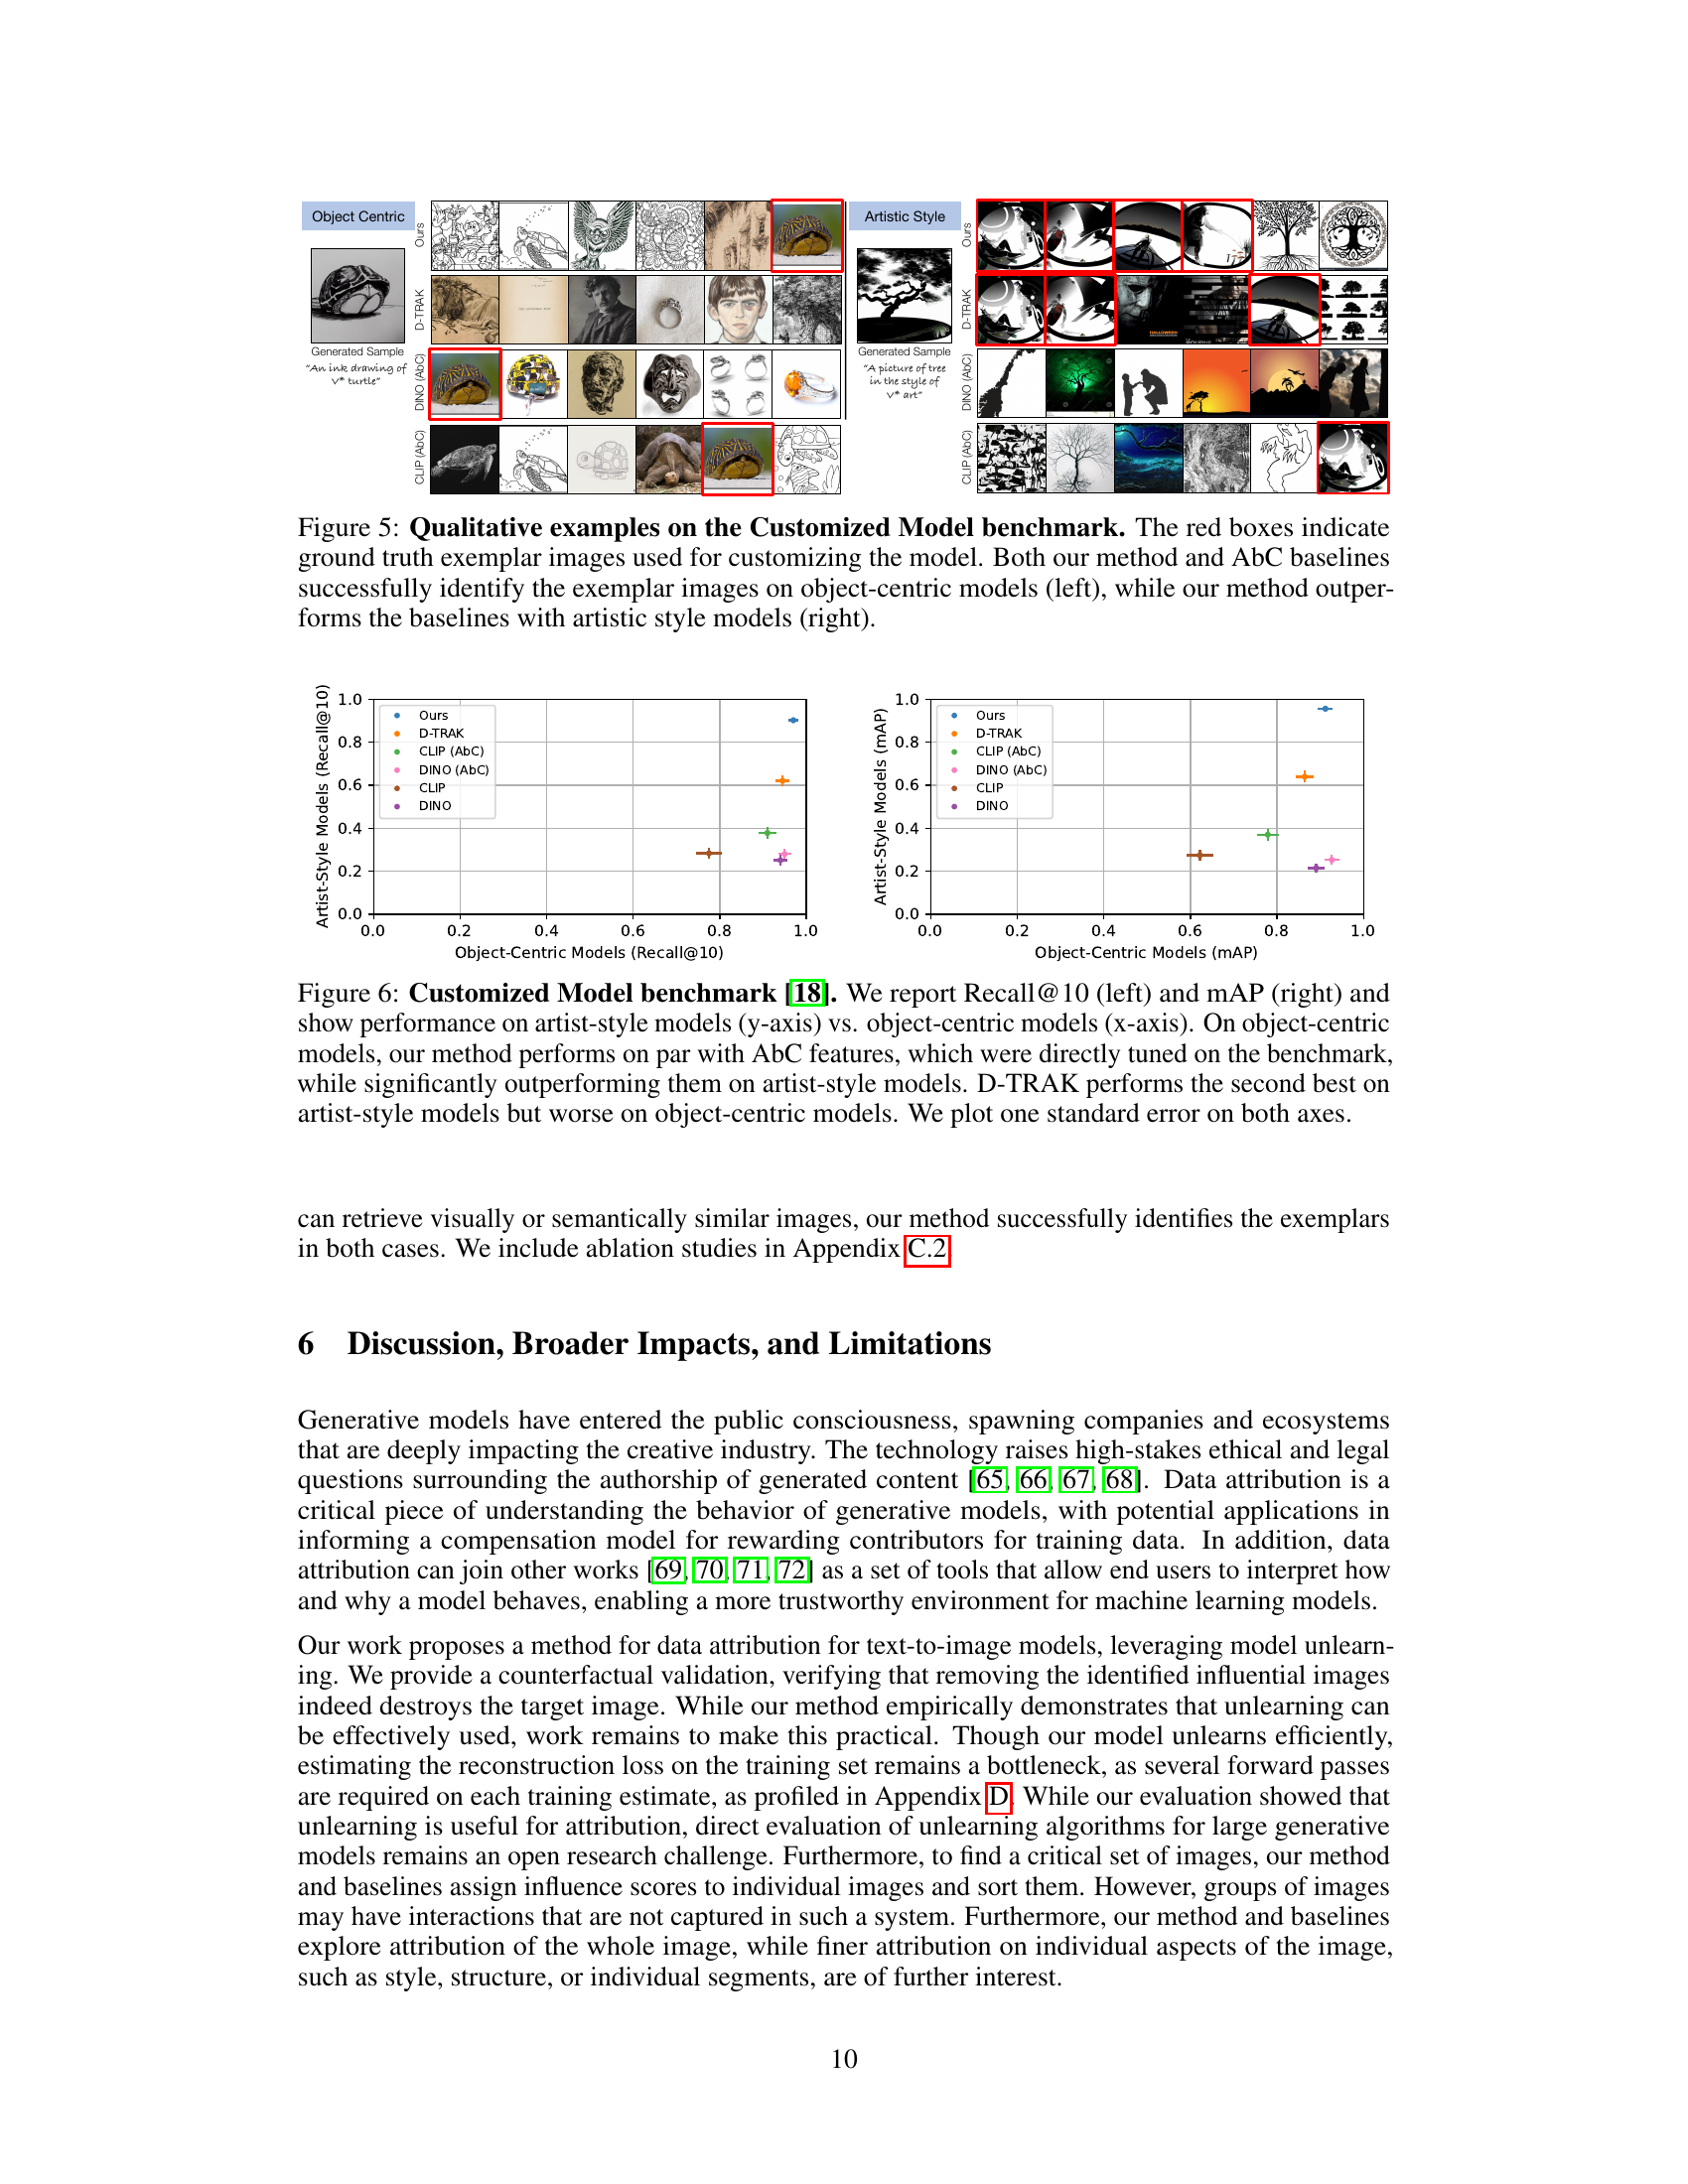
🔼 This figure shows qualitative results on the Customized Model benchmark dataset. The benchmark tests the ability of different attribution methods to identify the training images that most influenced the generation of images by customized models. Each column shows results for a single customized model and synthesized image (at the top). The red boxes highlight the ground truth exemplar images used to customize that model. The rows show the top images retrieved by different methods (ours, D-TRAK, DINO (AbC), CLIP (AbC)). Object-centric models are shown on the left, and artistic-style models are on the right. The figure visually demonstrates that the proposed method outperforms baselines, particularly in artistic-style model attribution, by more reliably identifying the ground truth exemplar images.
read the caption
Figure 5: Qualitative examples on the Customized Model benchmark. The red boxes indicate ground truth exemplar images used for customizing the model. Both our method and AbC baselines successfully identify the exemplar images on object-centric models (left), while our method outperforms the baselines with artistic style models (right).
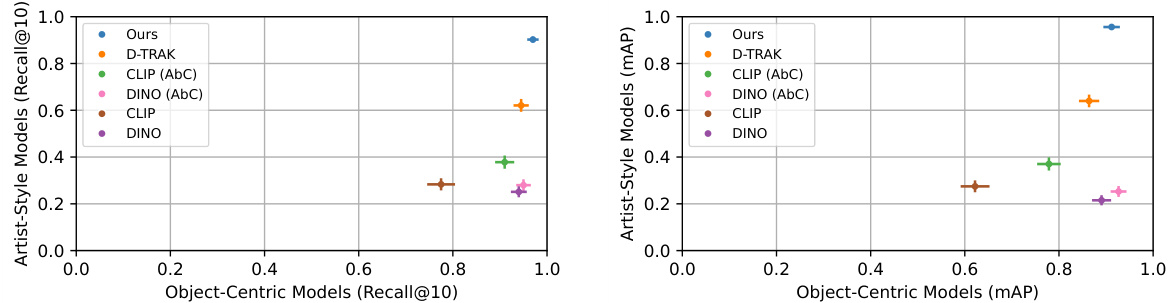
🔼 This figure presents the results of the proposed data attribution method on the Customized Model benchmark dataset [18]. The benchmark evaluates the ability of different methods to identify influential images in customized text-to-image models. The plots show Recall@10 and mean Average Precision (mAP) for both object-centric and artist-style models. The results demonstrate that the proposed method performs comparably to existing state-of-the-art methods on object-centric models but significantly outperforms them on artist-style models. D-TRAK shows strong performance on artist-style models but weaker results on object-centric models.
read the caption
Figure 6: Customized Model benchmark [18]. We report Recall@10 (left) and mAP (right) and show performance on artist-style models (y-axis) vs. object-centric models (x-axis). On object-centric models, our method performs on par with AbC features, which were directly tuned on the benchmark, while significantly outperforming them on artist-style models. D-TRAK performs the second best on artist-style models but worse on object-centric models. We plot one standard error on both axes.
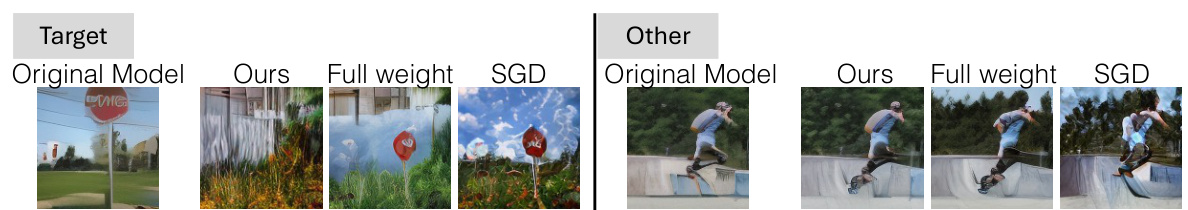
🔼 This figure shows an ablation study comparing three different unlearning methods. The goal is to effectively remove a specific image (the ’target’) from the model’s knowledge while preserving the ability to generate other images (‘other’). The results show that the proposed method (‘Ours’) is significantly better at forgetting the target image while maintaining the ability to generate other images, as compared to two baseline methods (‘Full weight’ and ‘SGD’). The images in the figure demonstrate the visual impact of each method.
read the caption
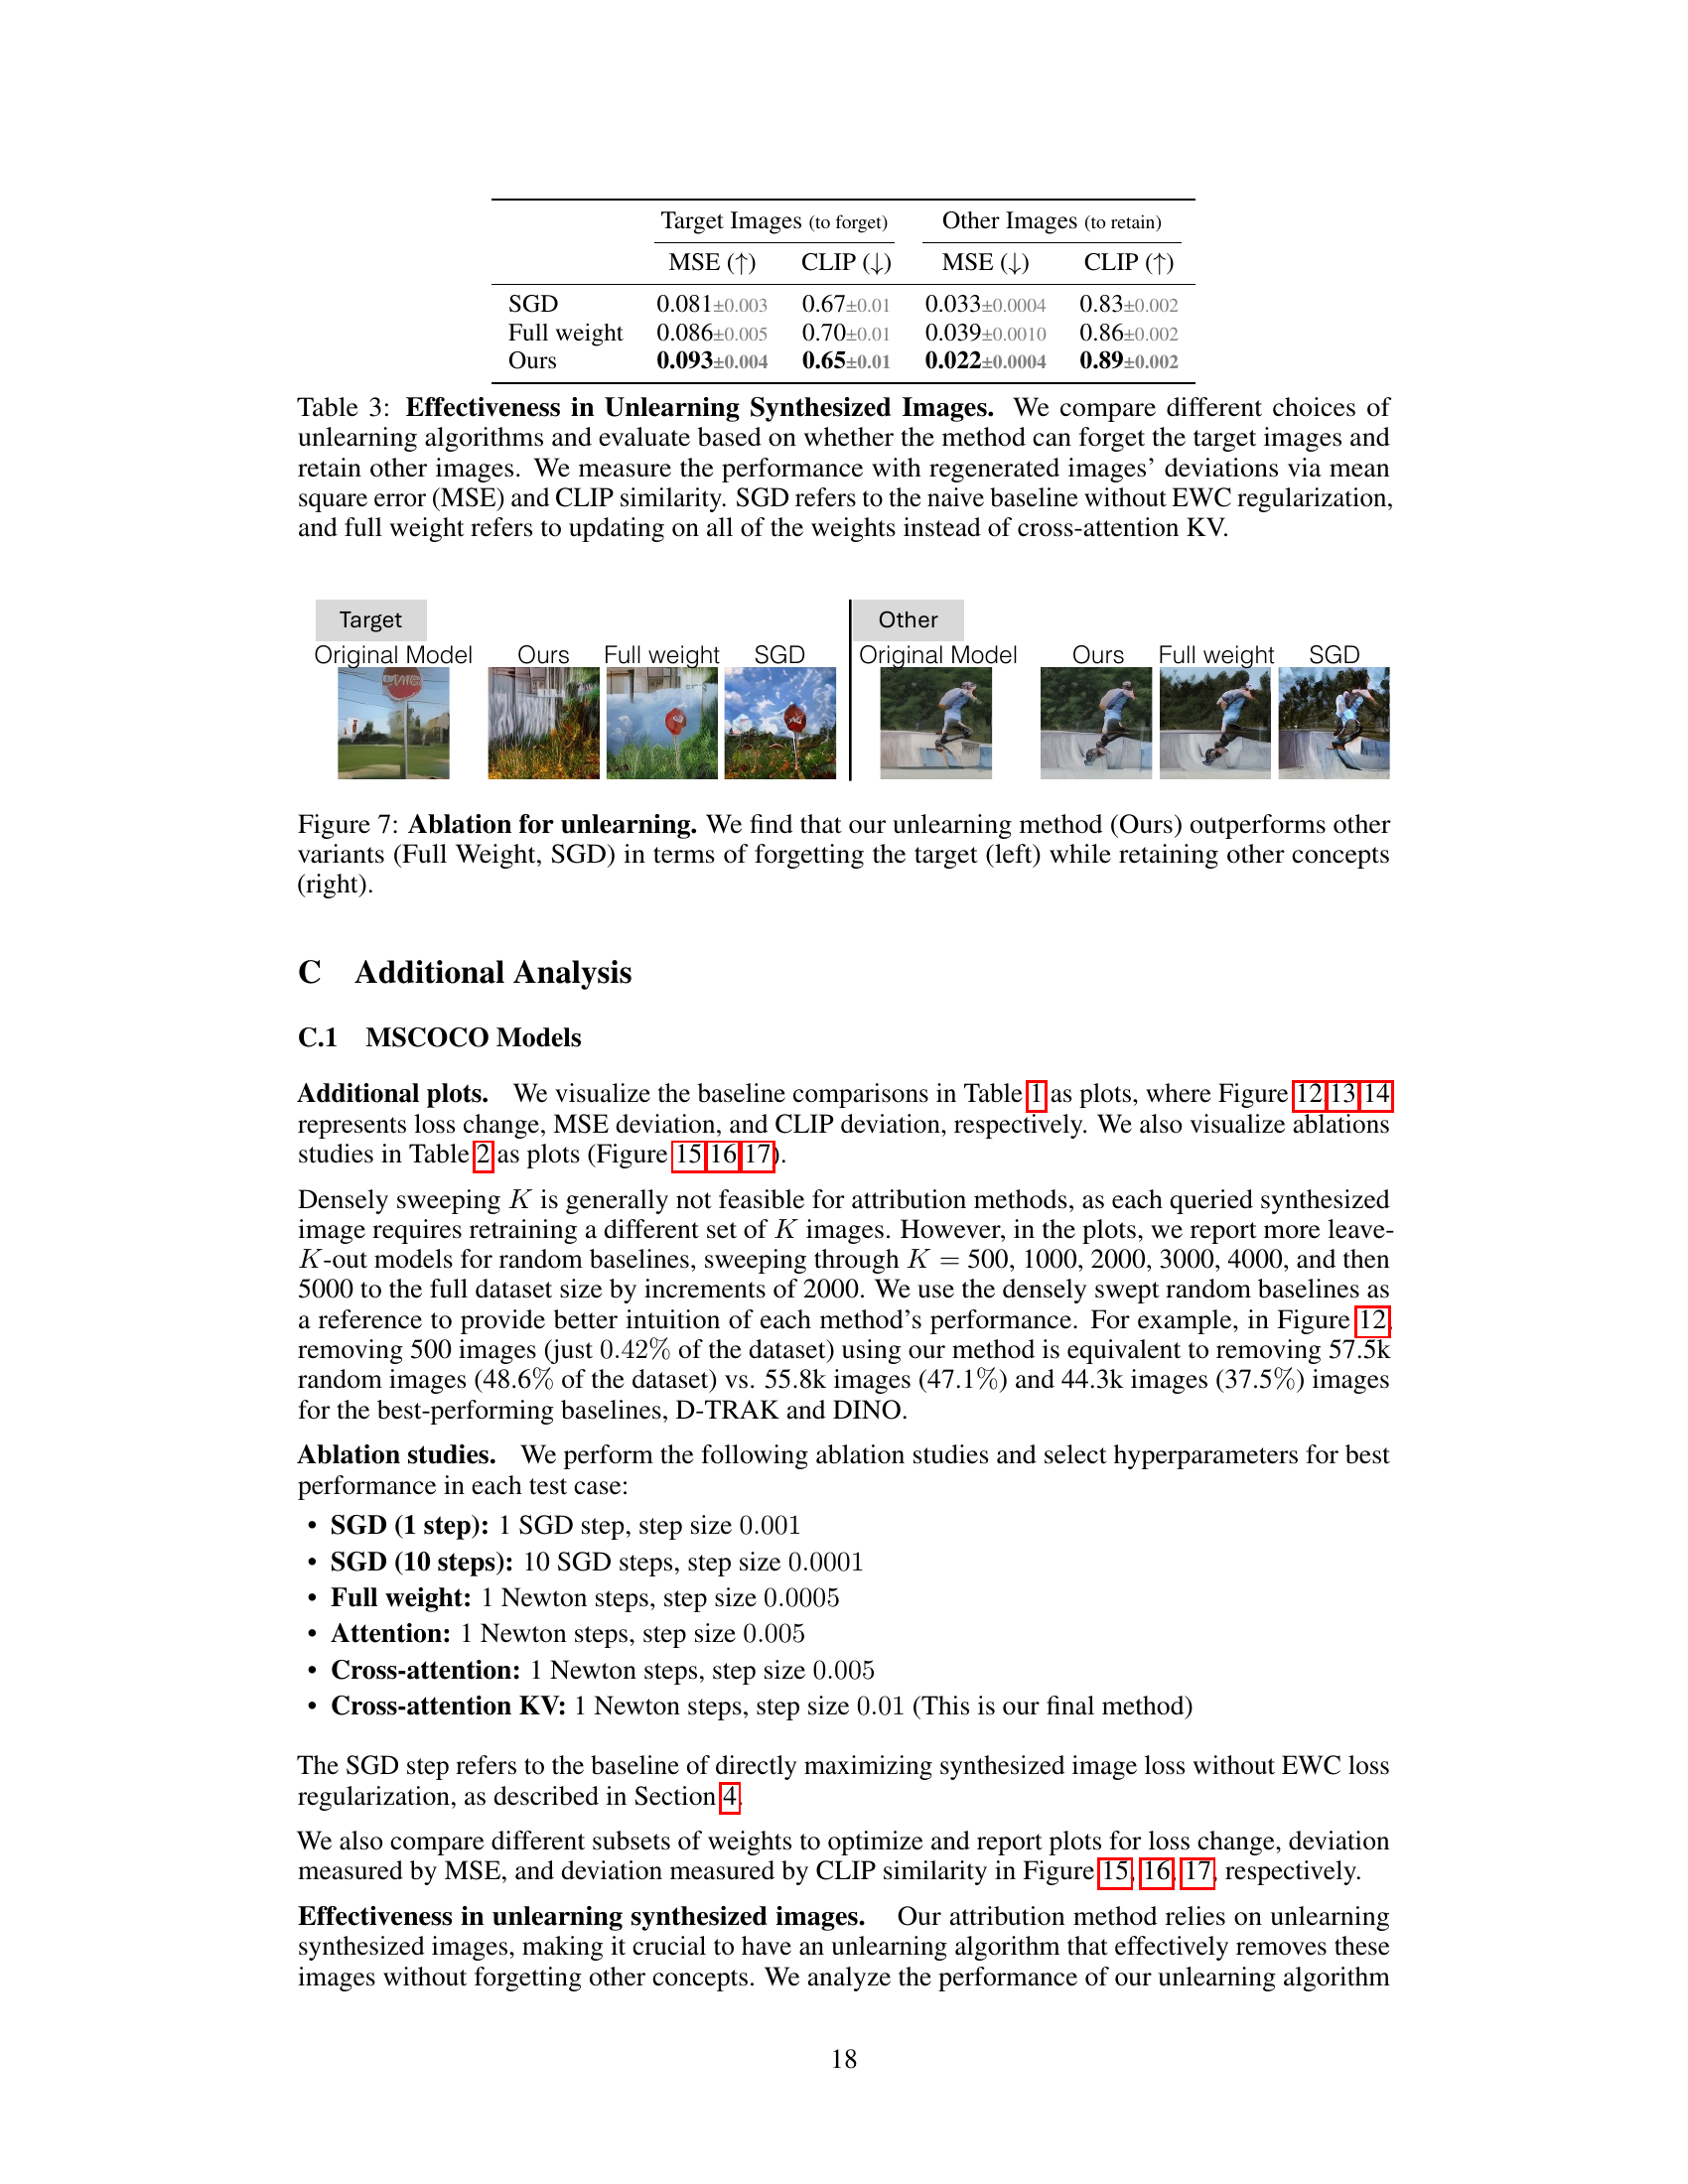
Figure 7: Ablation for unlearning. We find that our unlearning method (Ours) outperforms other variants (Full Weight, SGD) in terms of forgetting the target (left) while retaining other concepts (right).
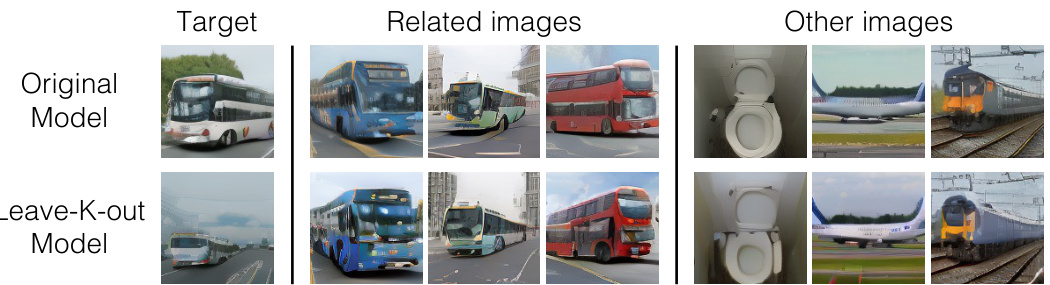
🔼 This figure demonstrates the results of retraining a model after removing a set of influential images (leave-K-out). The left column shows the target image that the model should ideally forget. The middle column displays images related to the target, and the right column shows images of unrelated concepts. The figure aims to show that the leave-K-out model successfully forgets the target image while retaining the ability to generate images similar to those in the related images and unrelated concepts.
read the caption
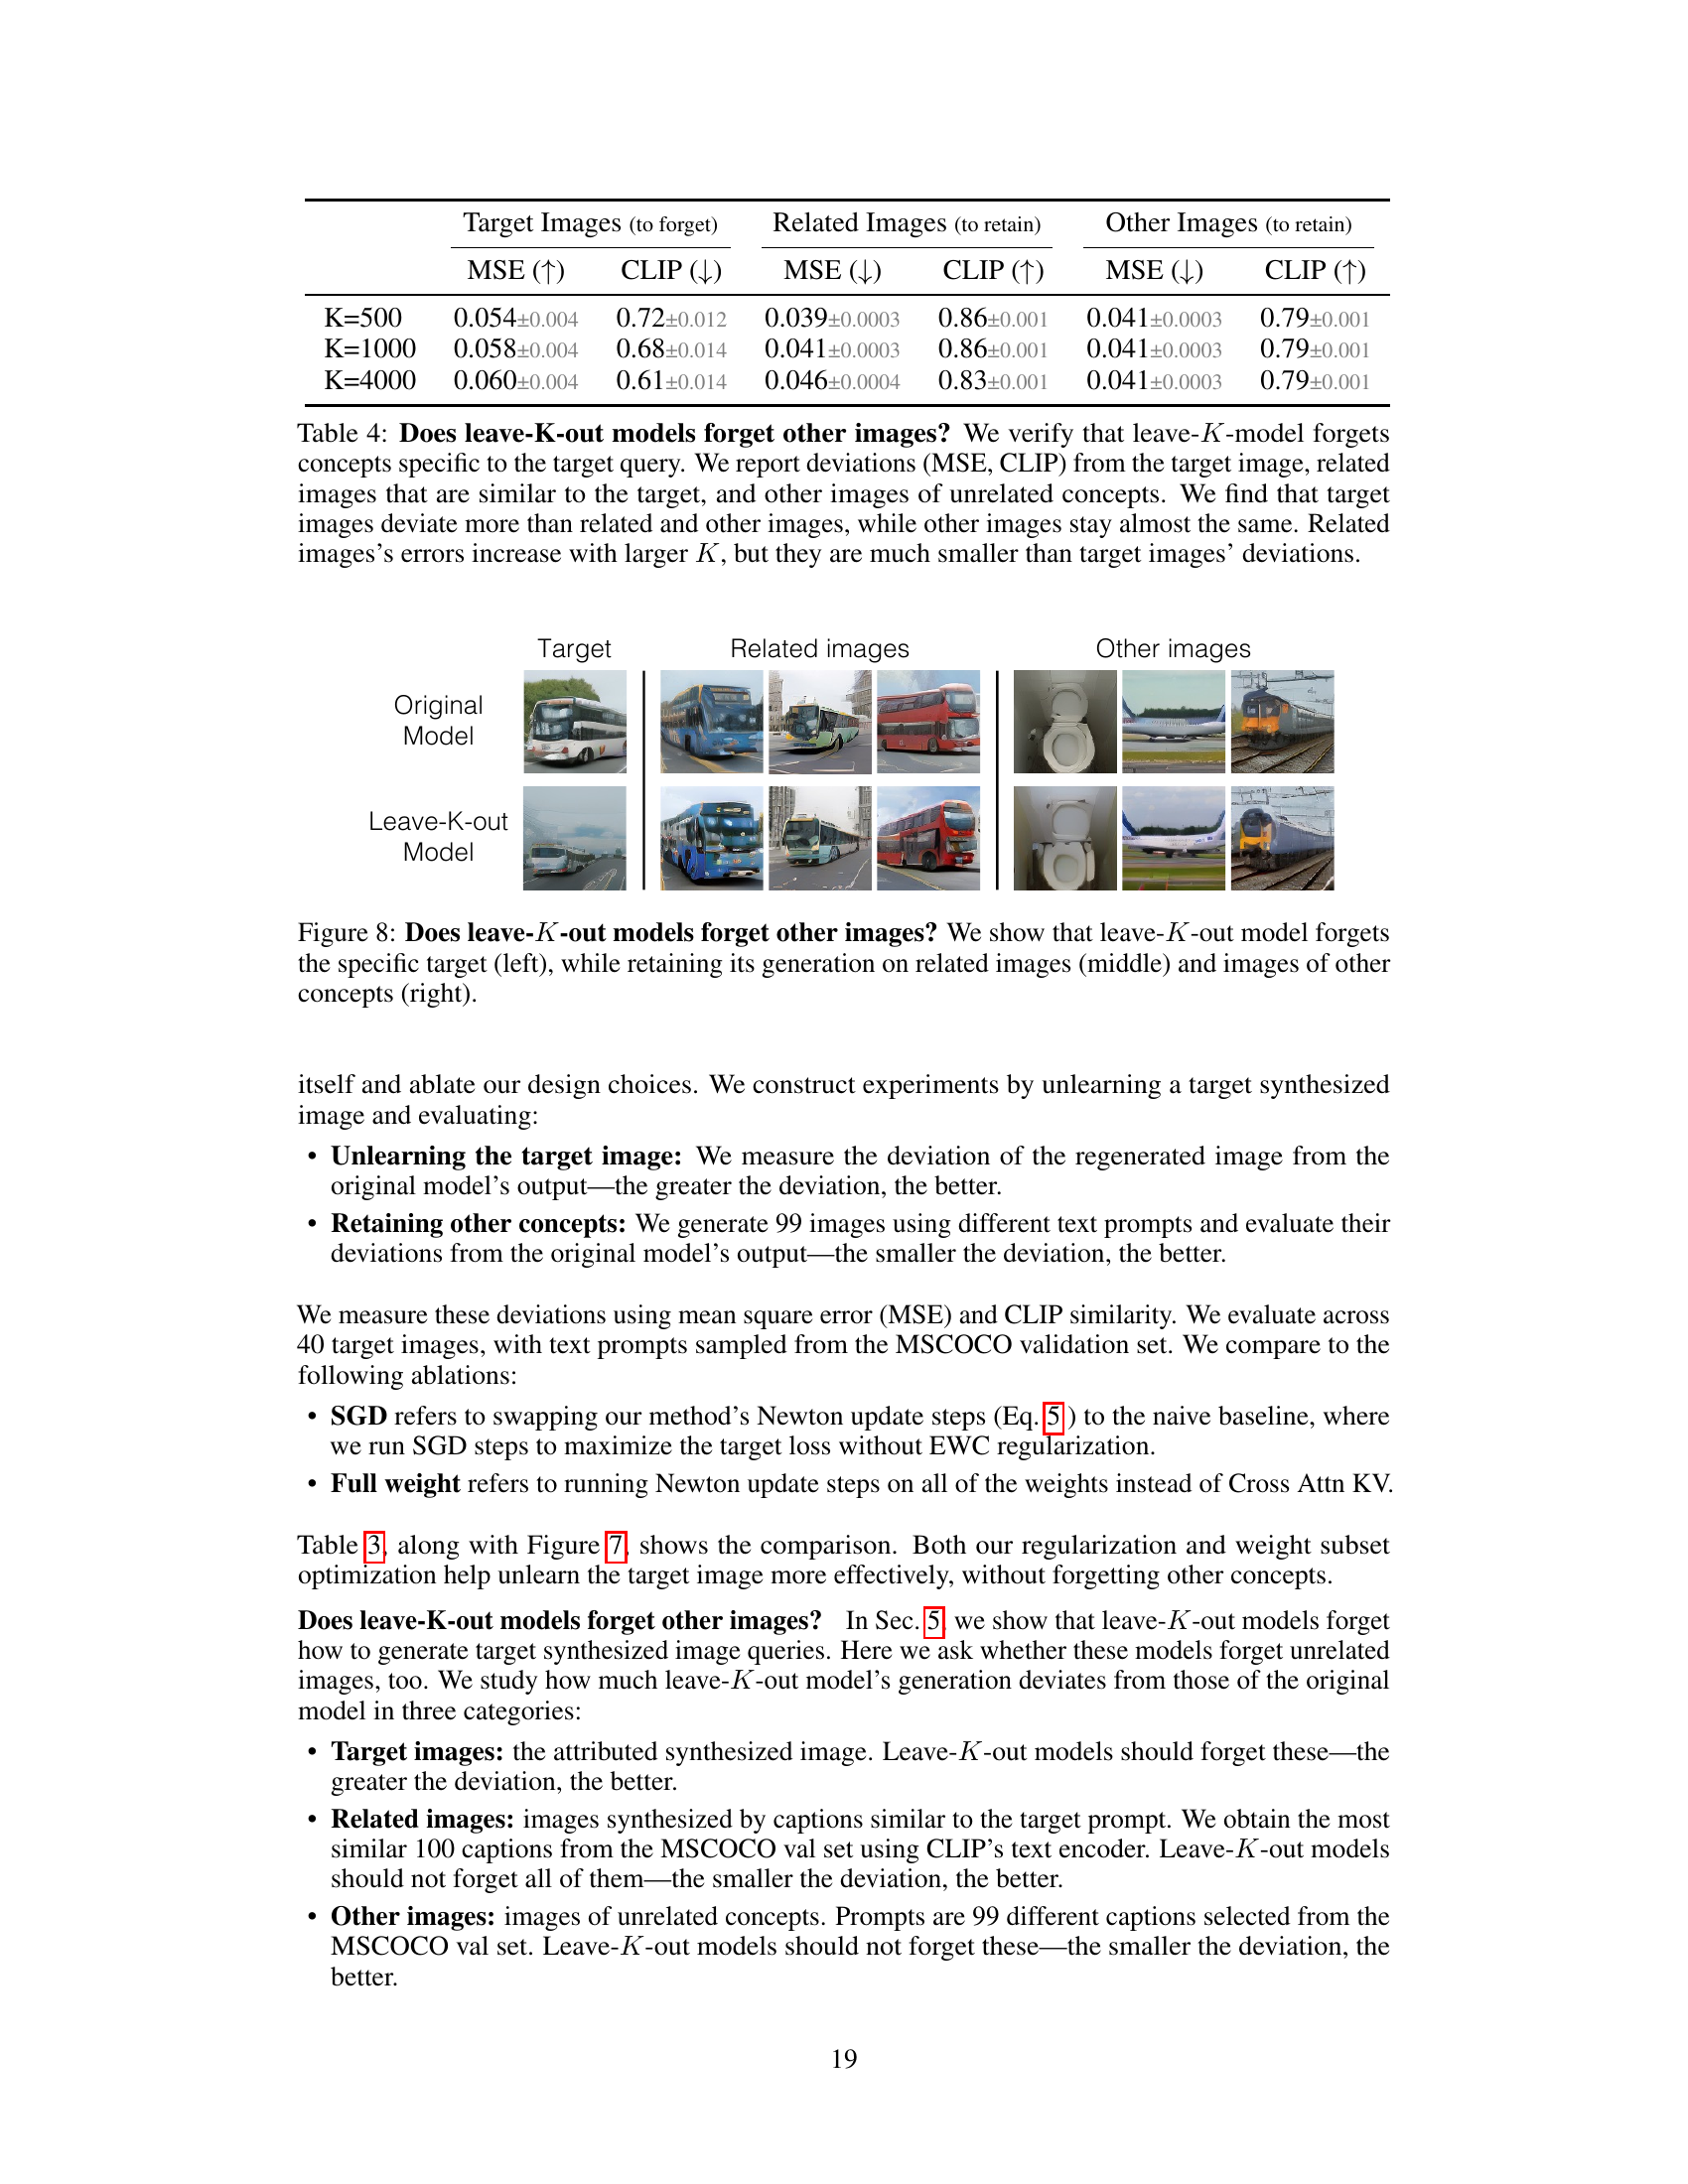
Figure 8: Does leave-K-out models forget other images? We show that leave-K-out model forgets the specific target (left), while retaining its generation on related images (middle) and images of other concepts (right).
🔼 This figure presents the results of the proposed data attribution method on the Customized Model Benchmark dataset. The benchmark evaluates the ability of attribution methods to identify the influential training images that were used to create customized text-to-image models. The results are shown for both artist-style models and object-centric models, demonstrating the superiority of the proposed method, especially for artist-style models, and highlighting its competitiveness with existing state-of-the-art techniques.
read the caption
Figure 6: Customized Model Benchmark [18]. We report Recall@10 (left) and mAP (right) and show performance on artist-style models (y-axis) vs. object-centric models (x-axis). On object-centric models, our method performs on par with AbC features, which were directly tuned on the benchmark, while significantly outperforming them on artist-style models. D-TRAK performs the second best on artist-style models but worse on object-centric models. We plot one standard error on both axes.
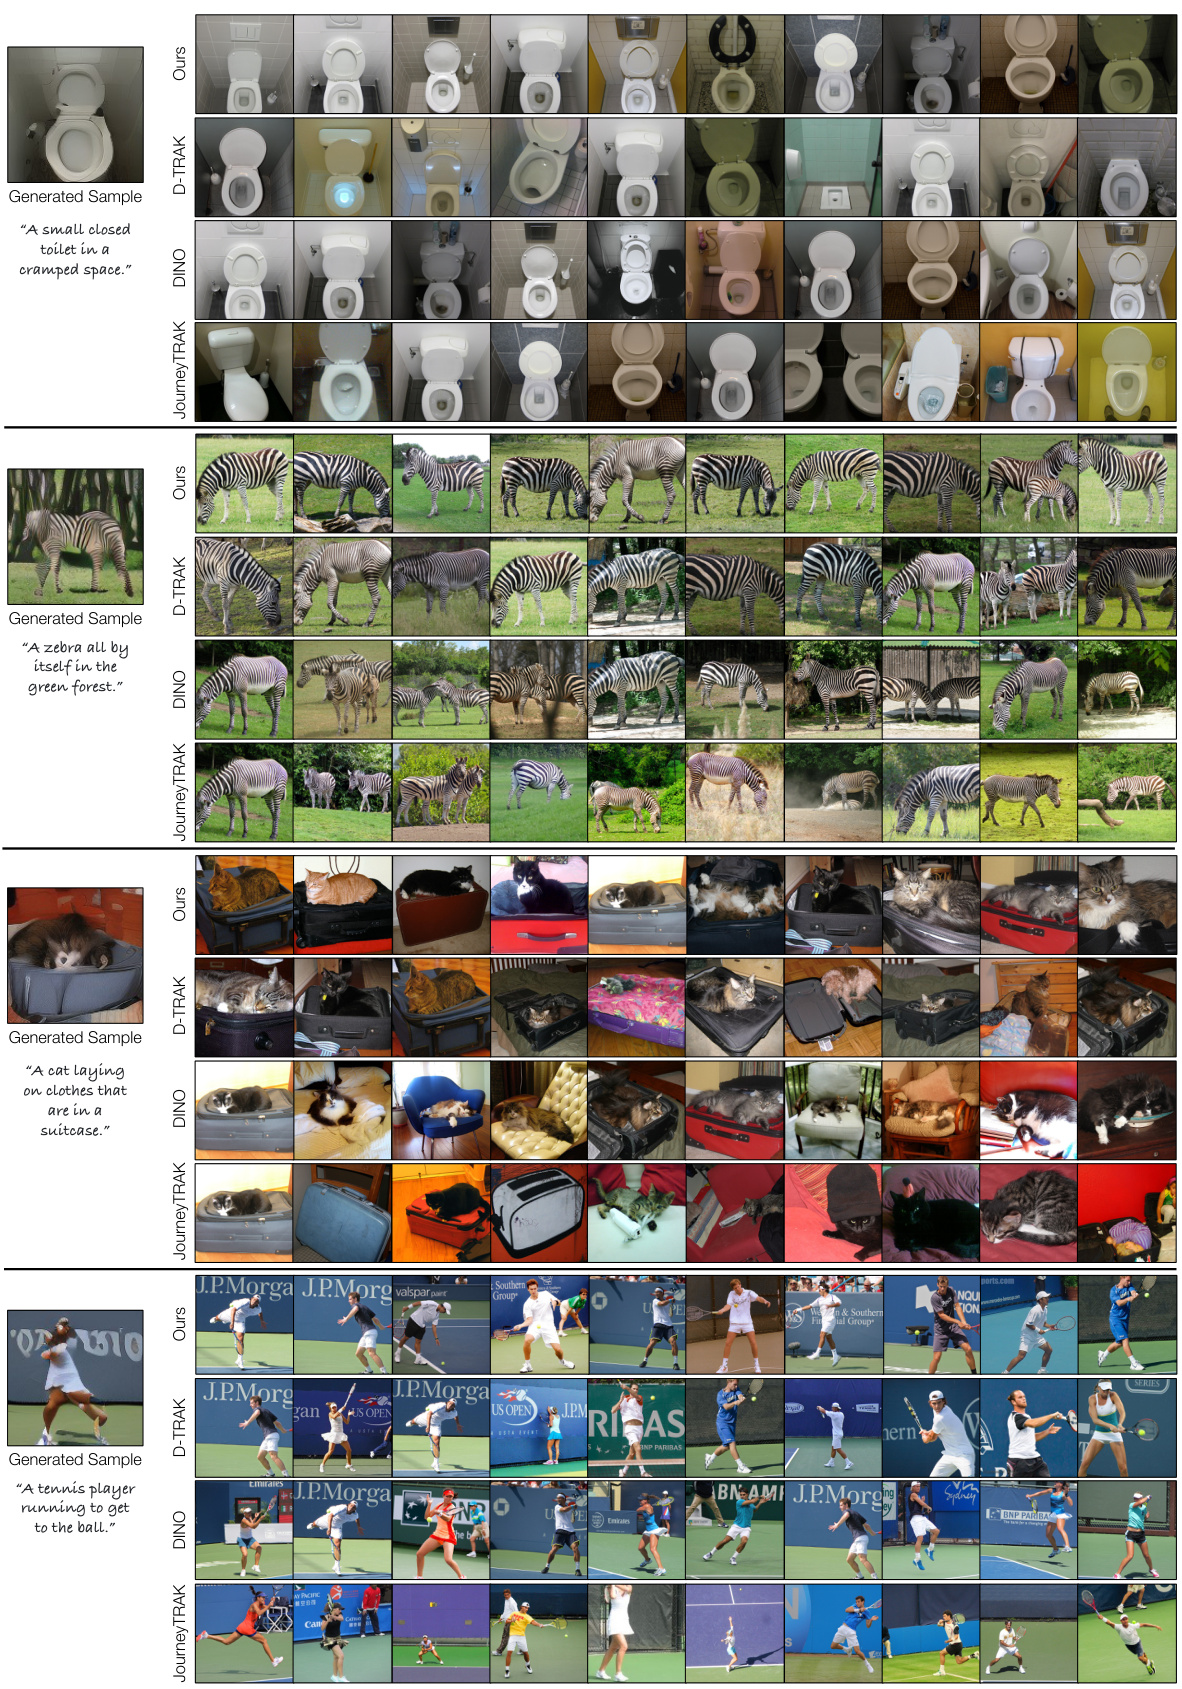
🔼 This figure shows a qualitative comparison of the attribution results of four different methods on MSCOCO models. For four different generated images, the figure displays the top training images identified as influential by each method. The goal is to demonstrate that the proposed ‘Ours’ method outperforms the other three methods by better identifying training images that share similar visual attributes with the generated image, particularly considering subtle details like poses and object counts. The images illustrate that the ‘Ours’ method is able to capture more fine-grained details in the visual similarity, accurately identifying similar poses despite random flips in the training data.
read the caption
Figure 2: Attribution results on MSCOCO models. We show generated samples used as a query on the left, with training images being identified by different methods on the right. Qualitatively, our method retrieves images with more similar visual attributes. Notably, our method better matches the poses of the buses (considering random flips during training) and the poses and enumeration of skiers.
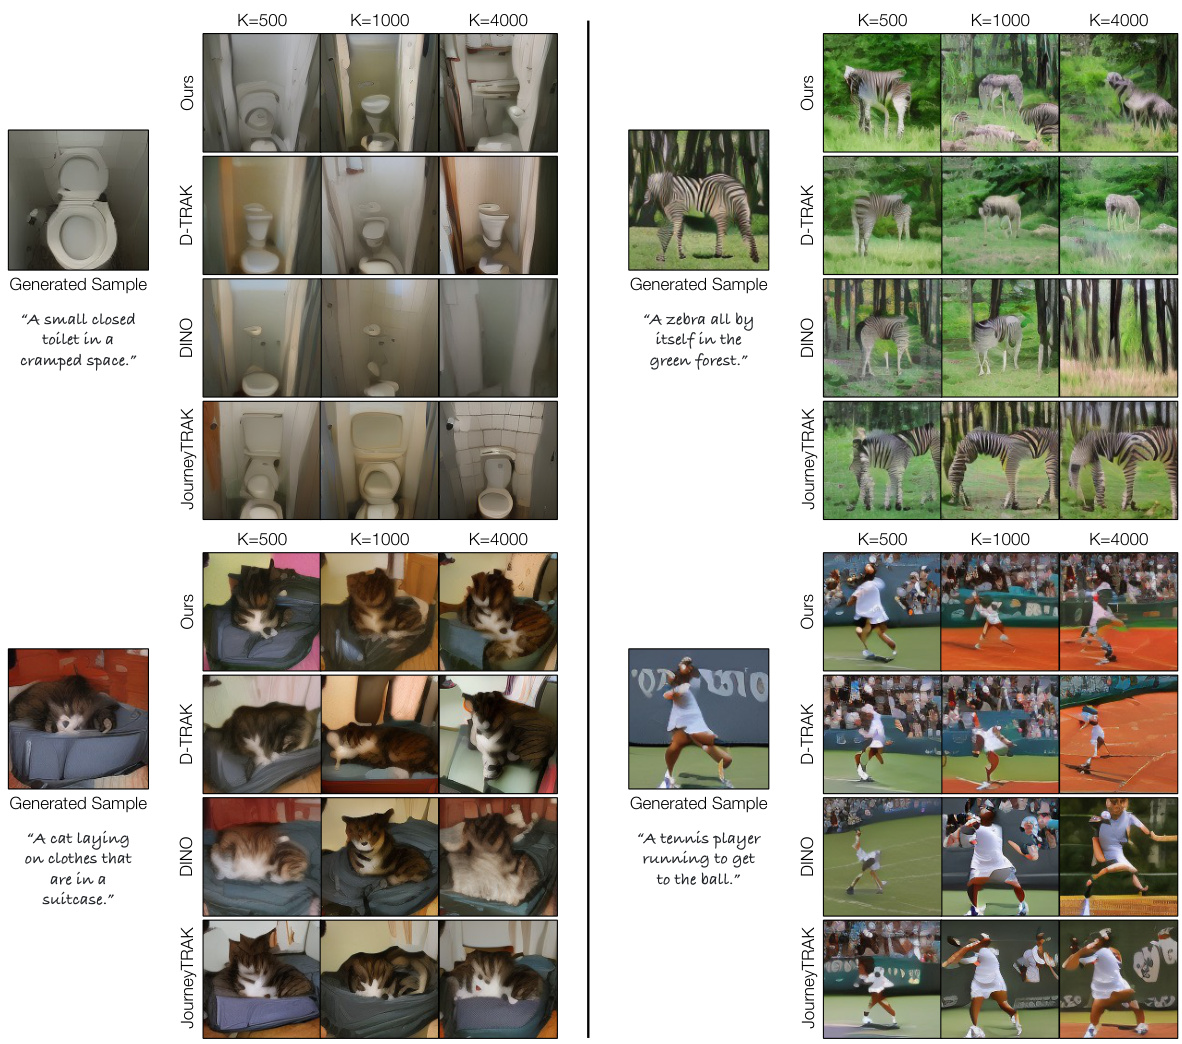
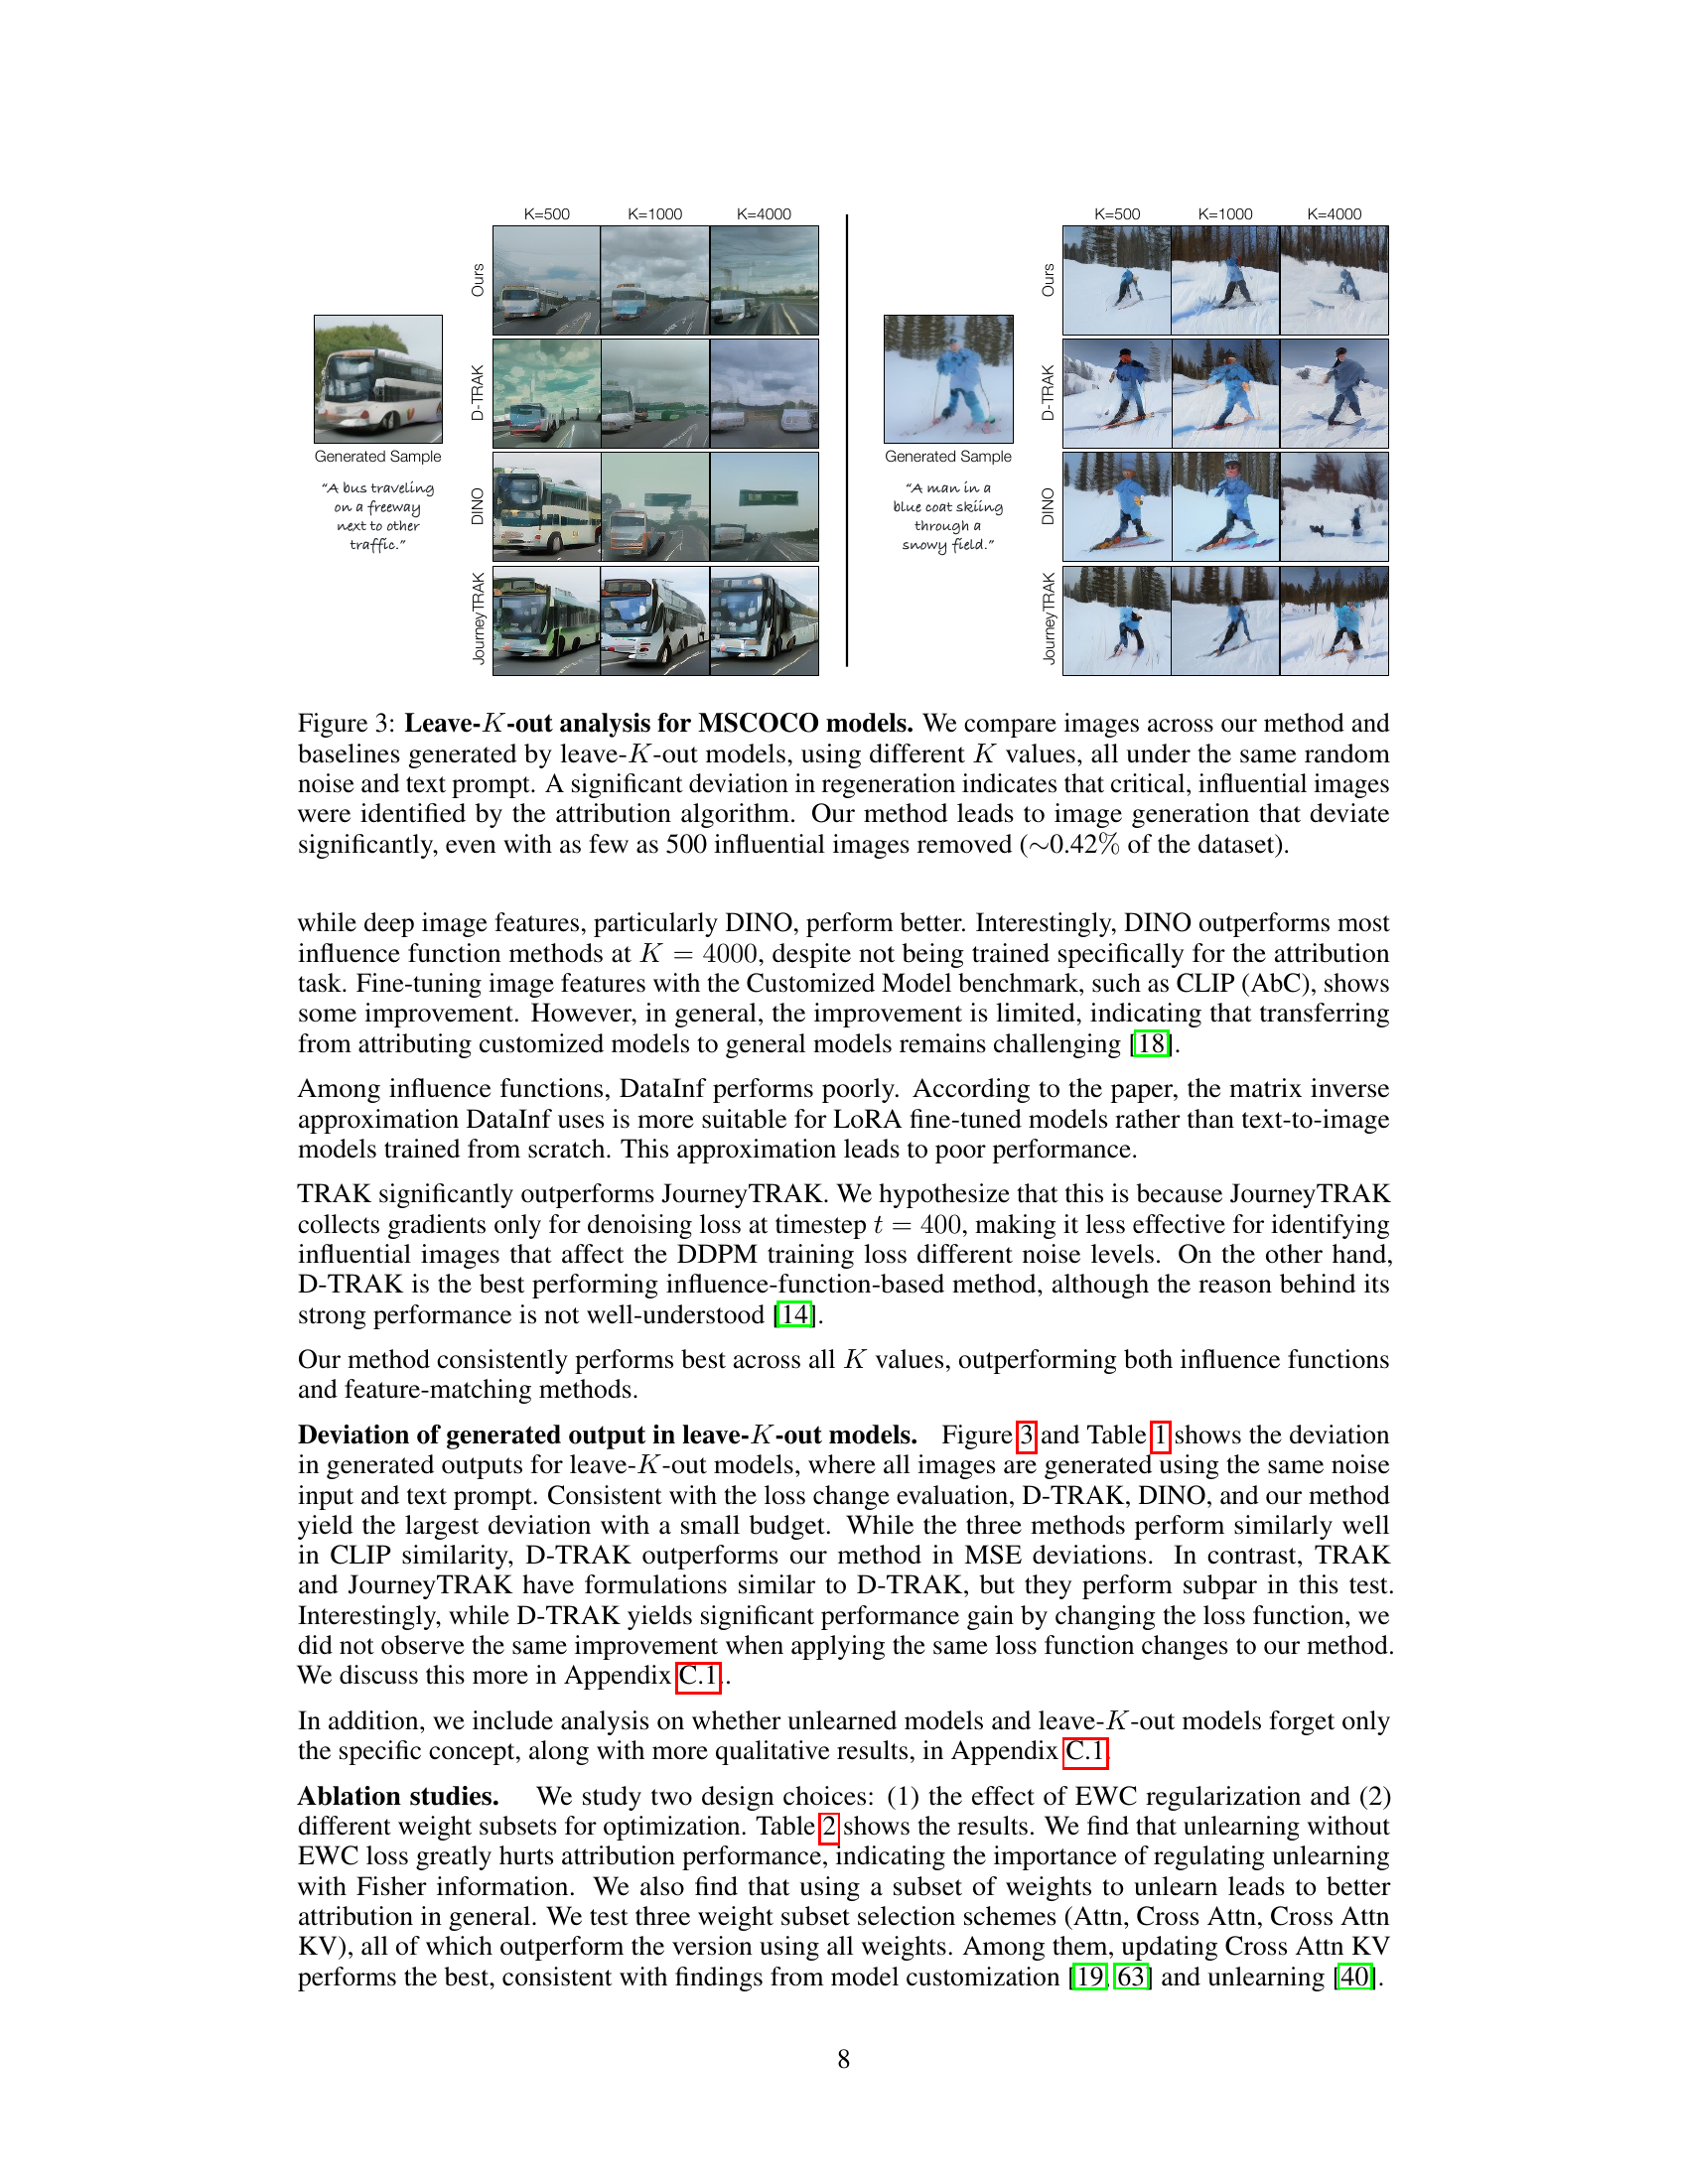
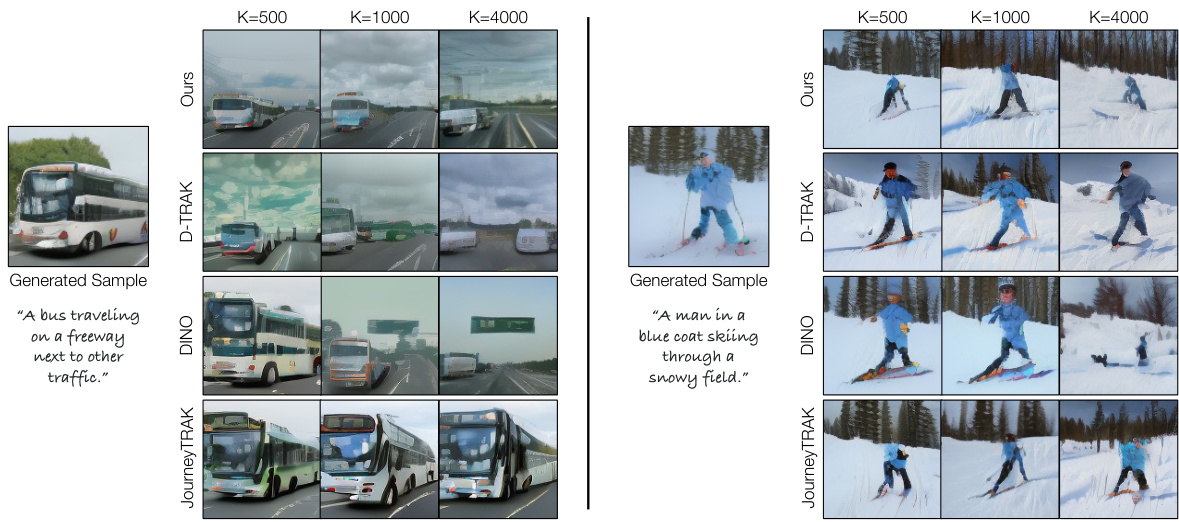
🔼 This figure shows additional results from leave-K-out experiments on MSCOCO models. Four different attribution methods (Ours, D-TRAK, DINO, JourneyTRAK) are compared, showing the generated images after removing the top K influential images identified by each method. The goal is to verify that removing the influential images identified by the algorithm prevents the model from regenerating the original synthesized image. The results demonstrate that the proposed method (‘Ours’) consistently performs better than other methods in destroying the synthesized images when removing the top K influential images.
read the caption
Figure 11: Additional leave-K-out model results for MSCOCO models. This is an extension of Figure 3 in the main paper, showing the results from removing top-K influential images from different algorithms, retraining, and attempting to regenerate a synthesized sample. The influential images for these examples are shown in Figure 10. Our method consistently destroys the synthesized examples, verifying that our method is identifying the critical influential images.
🔼 This figure shows a qualitative comparison of data attribution methods on MSCOCO datasets. The left column displays generated images (queries). The remaining columns present the top training images identified as influential by four different methods: JourneyTRAK, DINO, D-TRAK, and the proposed ‘Ours’ method. The authors highlight that their method better identifies images with similar visual attributes and poses compared to other methods, particularly noticeable in examples involving buses (where random flips during training are considered) and skiers.
read the caption
Figure 2: Attribution results on MSCOCO models. We show generated samples used as a query on the left, with training images being identified by different methods on the right. Qualitatively, our method retrieves images with more similar visual attributes. Notably, our method better matches the poses of the buses (considering random flips during training) and the poses and enumeration of skiers.
🔼 This figure shows a qualitative comparison of data attribution results on MSCOCO models for four different methods: JourneyTRAK, DINO, D-TRAK, and the authors’ proposed method. For each of two example generated images, the figure displays the top training images identified as influential by each method. The goal is to show that the authors’ method better identifies training images with similar visual attributes to the generated image, handling aspects like pose and object counts more effectively.
read the caption
Figure 2: Attribution results on MSCOCO models. We show generated samples used as a query on the left, with training images being identified by different methods on the right. Qualitatively, our method retrieves images with more similar visual attributes. Notably, our method better matches the poses of the buses (considering random flips during training) and the poses and enumeration of skiers.
🔼 This figure illustrates the proposed data attribution method and its evaluation process. (a) shows the unlearning approach: A pretrained model is fine-tuned to ‘forget’ a synthesized image (z). This process also causes the model to forget training images that were highly influential in generating that image. (b) demonstrates the counterfactual evaluation: By retraining a model without the most influential images identified in step (a), they show that the model can no longer generate the original synthesized image, proving the effectiveness of their method.
read the caption
Figure 1: (a) Our algorithm: We propose a new data attribution method using machine unlearning. By modifying the pretrained model θ to unlearn the synthesized result z, the model also forgets the influential training images crucial for generating that specific result. (b) Evaluation: We validate our method through counterfactual evaluation, where we retrain the model without the top K influential images identified by our method. When these influential images are removed from the dataset, the model fails to generate the synthesized image.
🔼 This figure illustrates the proposed data attribution method and its evaluation. Part (a) shows the core algorithm which uses machine unlearning to identify influential training images by ‘forgetting’ a synthesized image (z). By increasing the training loss on the output image (z) without catastrophic forgetting of other concepts, the method identifies training images causing significant loss deviations. Part (b) depicts the counterfactual evaluation: retraining the model without the top-K influential images and observing the model’s inability to reproduce the synthesized image. This confirms that the identified images are indeed influential for generating the specific output.
read the caption
Figure 1: (a) Our algorithm: We propose a new data attribution method using machine unlearning. By modifying the pretrained model θ to unlearn the synthesized result z, the model also forgets the influential training images crucial for generating that specific result. (b) Evaluation: We validate our method through counterfactual evaluation, where we retrain the model without the top K influential images identified by our method. When these influential images are removed from the dataset, the model fails to generate the synthesized image.

🔼 This figure displays a qualitative comparison of data attribution methods on MSCOCO models. Generated images are shown alongside their attributed training images, as determined by different methods. The authors highlight that their method is superior in identifying training images with more similar visual attributes, particularly with respect to object poses and counts.
read the caption
Figure 2: Attribution results on MSCOCO models. We show generated samples used as a query on the left, with training images being identified by different methods on the right. Qualitatively, our method retrieves images with more similar visual attributes. Notably, our method better matches the poses of the buses (considering random flips during training) and the poses and enumeration of skiers.
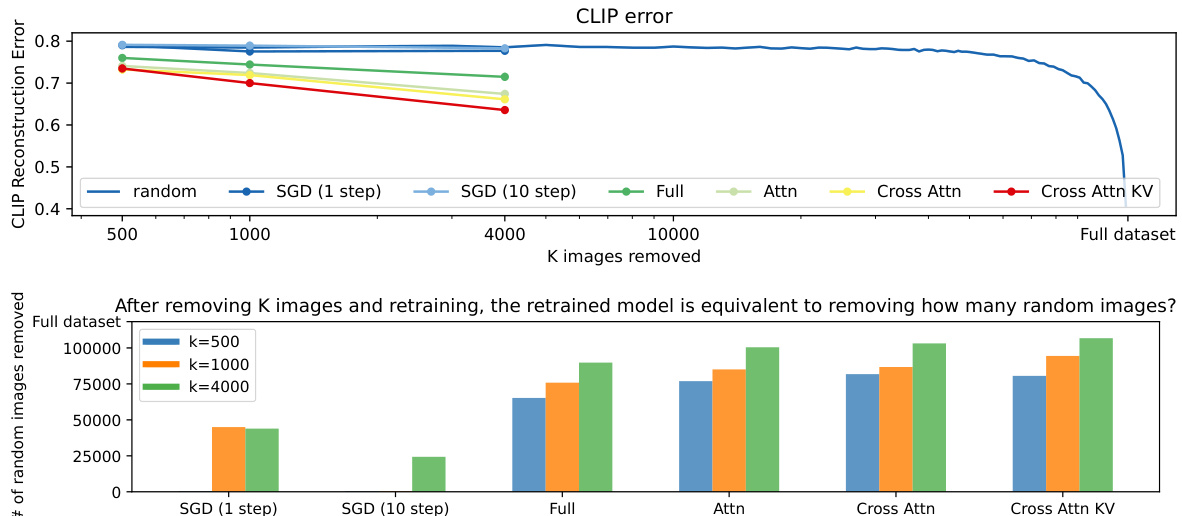
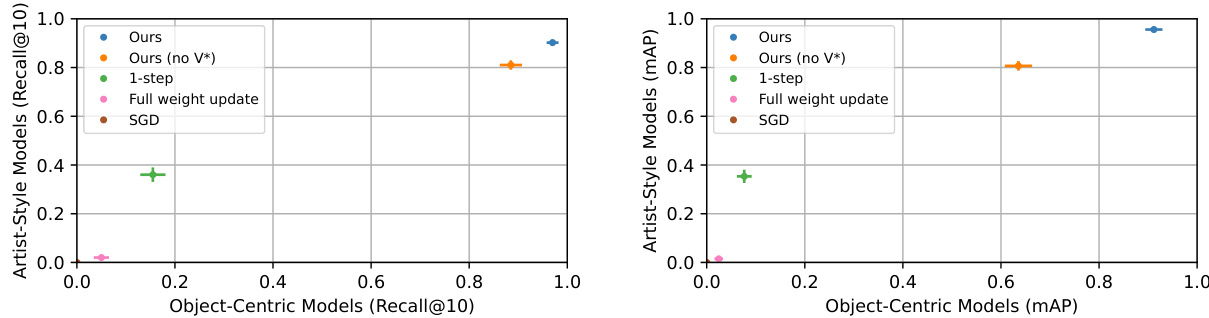
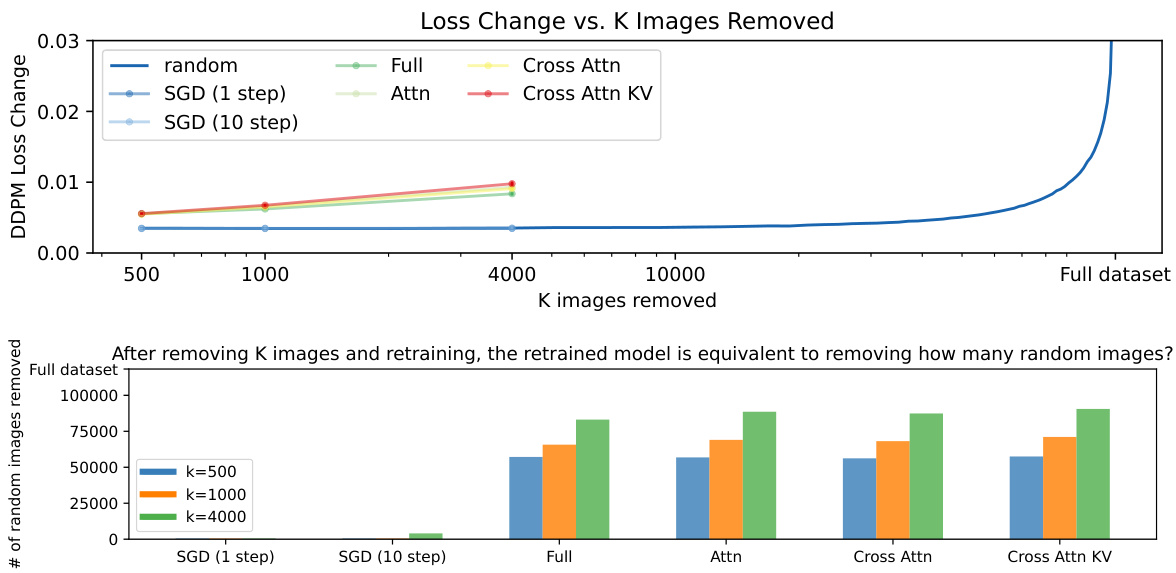
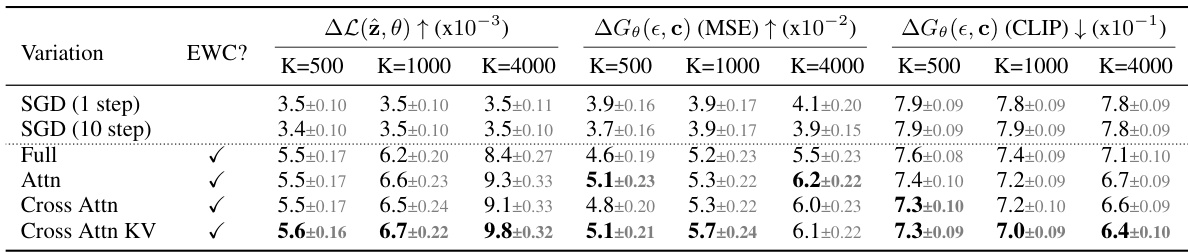
🔼 This figure shows the ablation study results on the customized model benchmark. The authors evaluated different unlearning configurations such as the number of steps, the choice of weight subset (full weights, attention layers, cross attention layers, cross attention key and value matrices), and the inclusion of Fisher information in the objective function. They observed that employing multiple steps, optimizing a subset of weights (specifically cross-attention KV), and regularizing with Fisher information yielded the best performance. A comparison with an experiment conducted without the special token v* is also included. The results obtained demonstrate the importance of these design choices for effective attribution in customized models.
read the caption
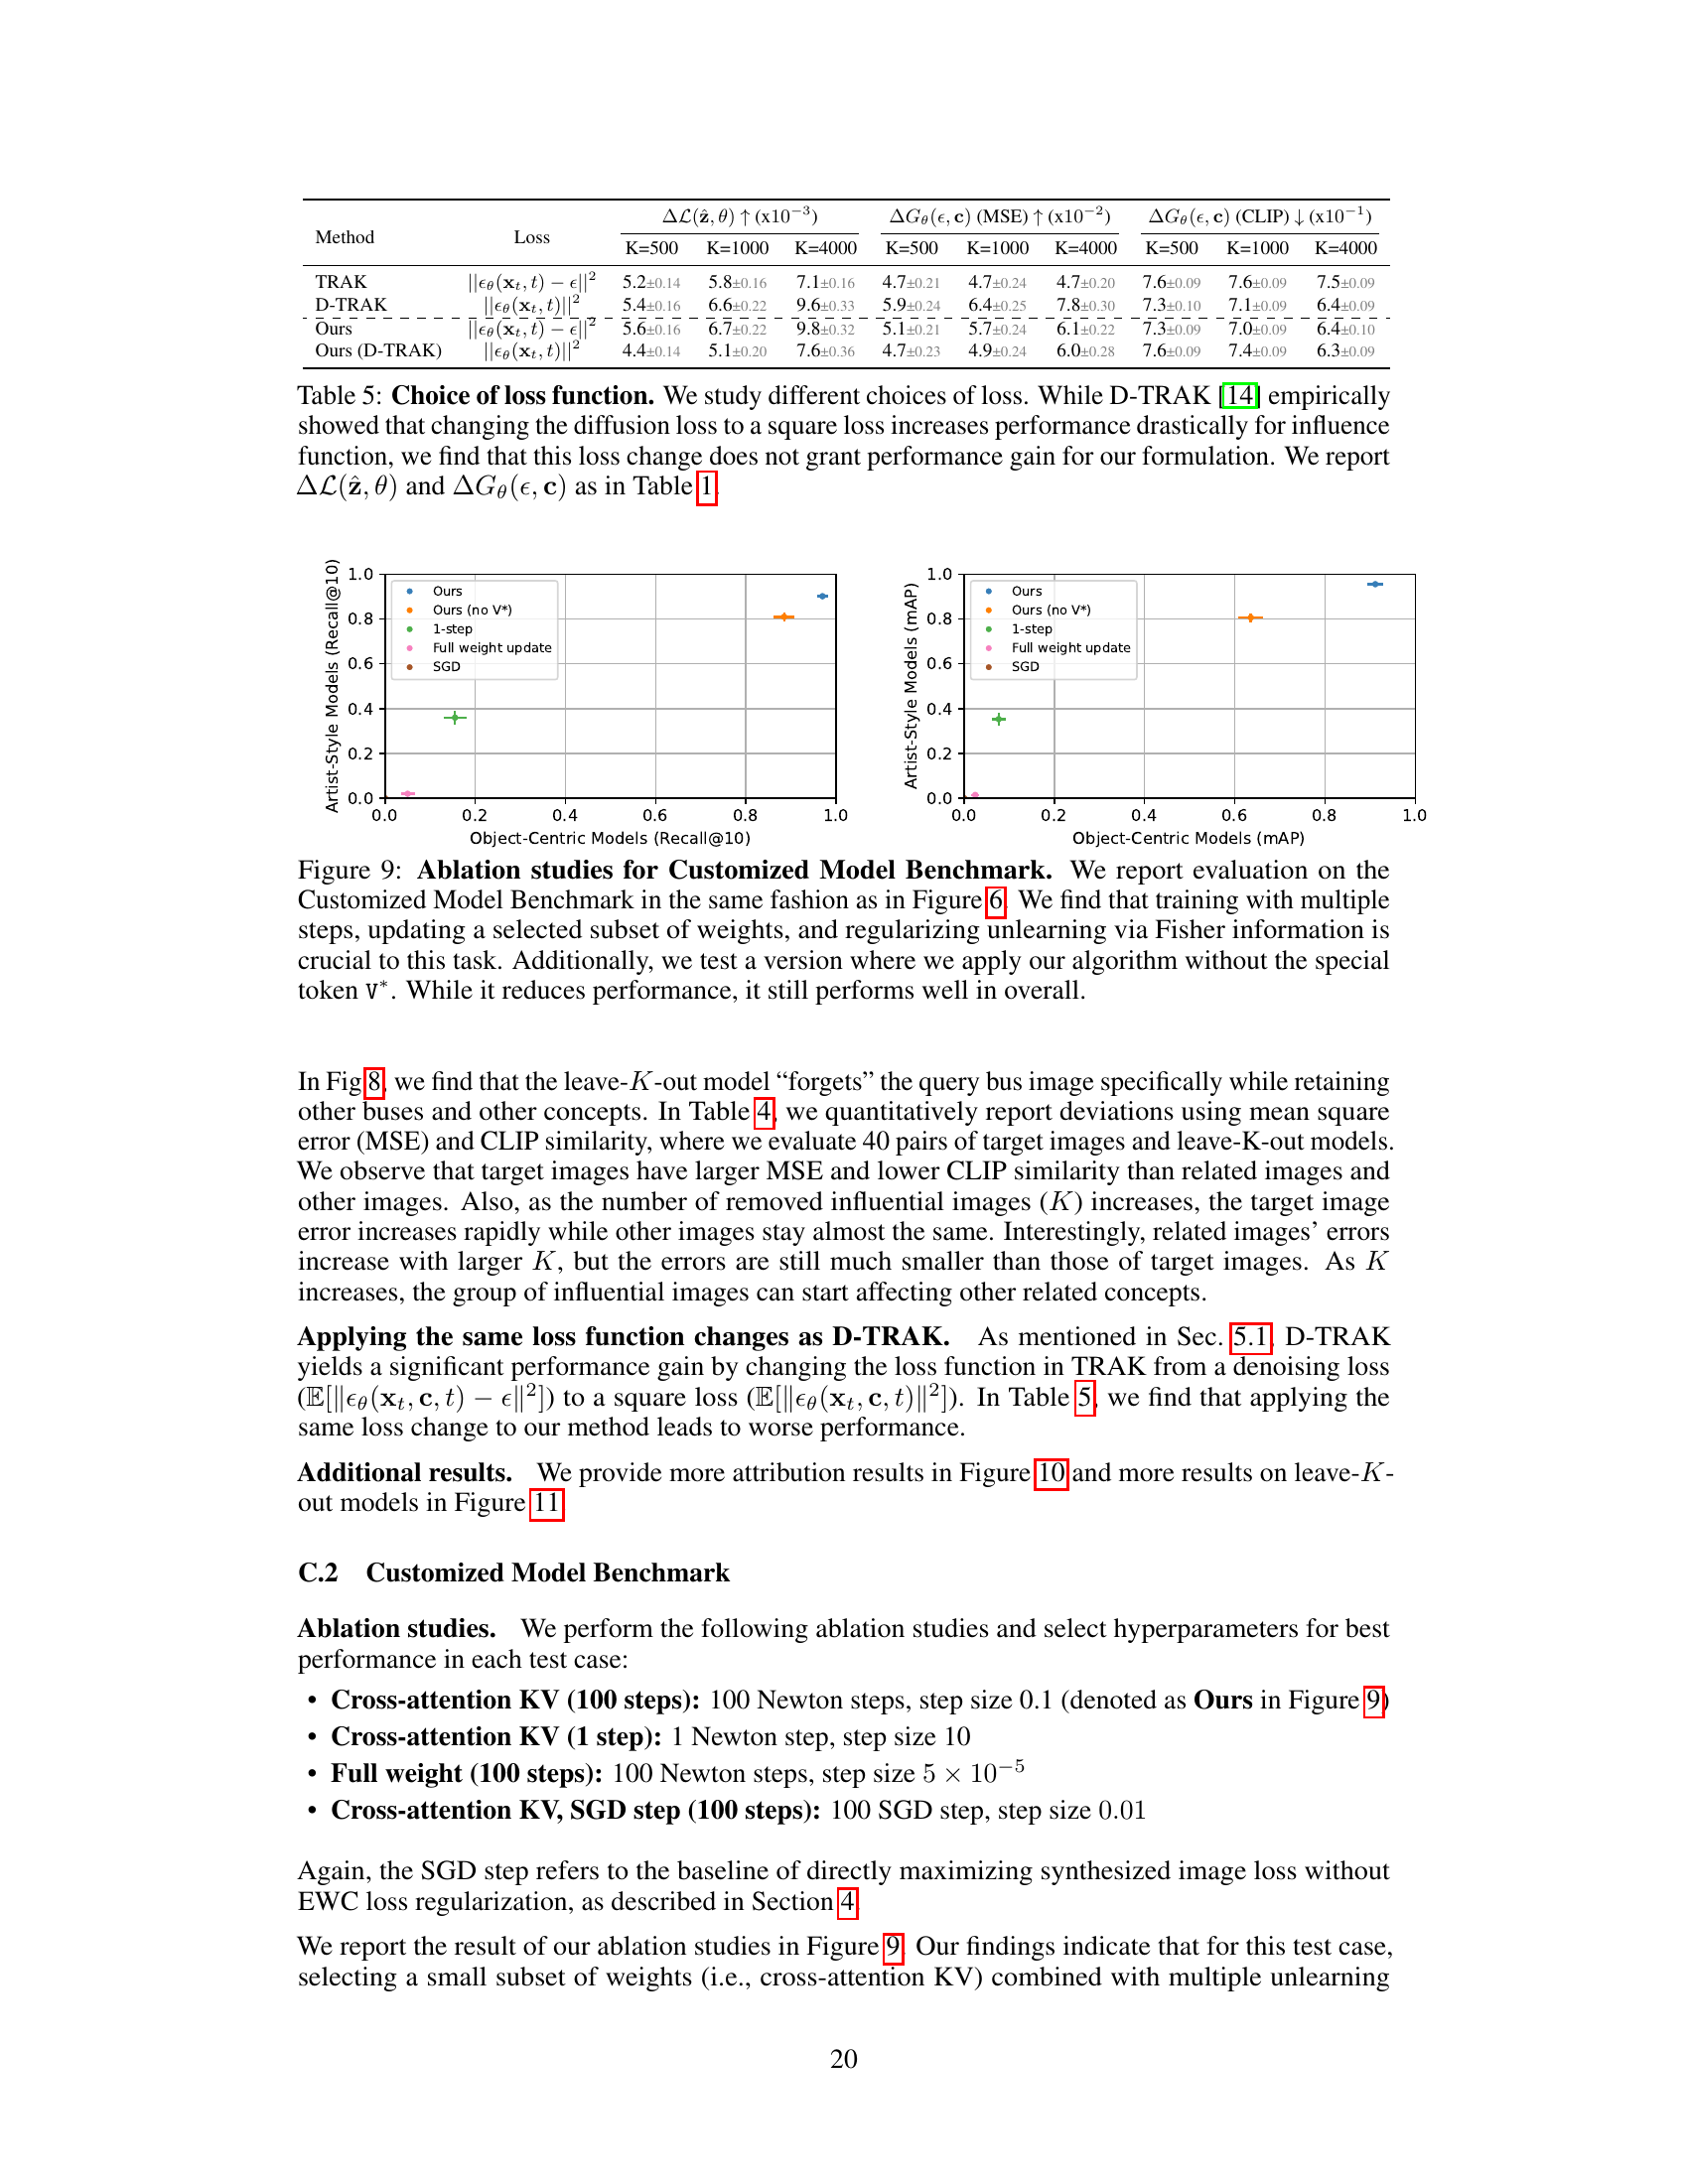
Figure 9: Ablation studies for Customized Model Benchmark. We report evaluation on the Customized Model Benchmark in the same fashion as in Figure 6. We find that training with multiple steps, updating a selected subset of weights, and regularizing unlearning via Fisher information is crucial to this task. Additionally, we test a version where we apply our algorithm without the special token v*. While it reduces performance, it still performs well in overall.
More on tables
🔼 This table compares different baselines for leave-K-out counterfactual evaluation of data attribution methods for text-to-image models. For each of several methods (including the proposed method), the table shows the increase in loss and change in image generation quality (measured in MSE and CLIP similarity) after retraining the model without the top K most influential images identified by that method. Higher loss and greater MSE indicate better performance of the method. The results are averaged across 110 synthesized image samples.
read the caption
Table 1: Leave-K-out baseline comparisons. Given a synthesized image \textbf{z}, we train leave-K-out models for each of the attribution methods and track \textbf{\textDelta}L(\textbf{z}, \theta), the increase in loss change, and \textbf{\textDelta}G_{\theta}(\epsilon, c), deviation of generation. We report results over 110 samples, and gray shows the standard error. Bolded and underlined are the best and second best performing method, respectively.
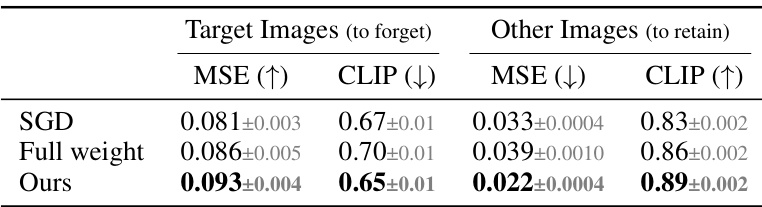
🔼 This table compares the effectiveness of different unlearning algorithms in forgetting target images while retaining other images. The performance is measured using Mean Squared Error (MSE) and CLIP similarity on regenerated images. The results show that the proposed method (Ours) outperforms the naive baseline (SGD) and the full-weight update method, demonstrating its ability to selectively unlearn the target image without significantly affecting other images.
read the caption
Table 3: Effectiveness in Unlearning Synthesized Images. We compare different choices of unlearning algorithms and evaluate based on whether the method can forget the target images and retain other images. We measure the performance with regenerated images' deviations via mean square error (MSE) and CLIP similarity. SGD refers to the naive baseline without EWC regularization, and full weight refers to updating on all of the weights instead of cross-attention KV.

🔼 This table presents the results of an experiment designed to evaluate whether the leave-K-out models forget other images besides the target image. Three categories of images are evaluated: target images (the images the model is trained to forget), related images (images similar to the target), and other images (unrelated images). The table shows that the MSE (mean squared error) for target images is significantly higher than for related and other images, and the CLIP (CLIP similarity) score is lower, indicating that the model successfully forgets the target images while retaining information about related and unrelated images. The differences in MSE and CLIP scores between the target images and the other two image categories grow larger as the number of removed images (K) increases.
read the caption
Table 4: Does leave-K-out models forget other images? We verify that leave-K-model forgets concepts specific to the target query. We report deviations (MSE, CLIP) from the target image, related images that are similar to the target, and other images of unrelated concepts. We find that target images deviate more than related and other images, while other images stay almost the same. Related images’s errors increase with larger K, but they are much smaller than target images’ deviations.

🔼 This table presents a comparison of different data attribution methods using a leave-K-out evaluation strategy. For each of 110 synthesized images, several methods were used to identify influential training images, which were then removed to create a leave-K-out model. The table shows the increase in loss (∆L(z, θ)) and deviation in image generation (∆G(ε, c)) for each method, evaluated using both MSE and CLIP similarity. The best and second-best performing methods are highlighted.
read the caption
Table 1: Leave-K-out baseline comparisons. Given a synthesized image \textbf{z}, we train leave-K-out models for each of the attribution methods and track \textbf{∆L(z, θ)}, the increase in loss change, and \textbf{∆G(ε, c)}, deviation of generation. We report results over 110 samples, and gray shows the standard error. Bolded and underlined are the best and second best performing method, respectively.
Full paper#