↗ OpenReview ↗ NeurIPS Homepage ↗ Chat
TL;DR#
Existing dataset condensation techniques primarily focus on classification tasks and struggle when applied to time series forecasting due to differences in evaluation metrics. Time series forecasting requires similar predictions across all data points, unlike classification which only needs identical labels. This poses a significant challenge in adapting classification-oriented condensation methods.
This paper addresses this gap by introducing CondTSF, a novel one-line plugin specifically designed for dataset condensation in time series forecasting. CondTSF improves performance by theoretically analyzing the optimization objective and reformulating it to reduce the prediction distance between models trained on the condensed and full datasets. Extensive experiments on eight time series datasets consistently demonstrate CondTSF’s effectiveness, particularly at low compression ratios, showing significant improvements across various datasets and condensation methods.
Key Takeaways#
Why does it matter?#
This paper is crucial for researchers in time series forecasting as it introduces CondTSF, a novel one-line plugin for dataset condensation. CondTSF significantly improves the performance of existing methods, particularly at low condensing ratios, offering a practical solution to reduce computational costs and improve model accuracy. It also opens avenues for further research into the optimization of dataset condensation for time-series data, leading to improved model training efficiency and generalization.
Visual Insights#

This figure demonstrates the difference in evaluation metrics between dataset condensation for classification and time series forecasting. The left panel illustrates that for classification, successful condensation is determined by whether the model trained on the condensed dataset produces the same class labels as the model trained on the full dataset, regardless of the similarity in the output logits distribution. Conversely, for time series forecasting, successful condensation requires that the predictions from the condensed dataset model closely match the predictions from the full dataset model across all data points. The right panel shows that the proposed CondTSF method improves the performance of several existing dataset condensation methods, across various datasets, especially at lower condensation ratios.

This table presents the performance comparison of various dataset condensation methods with and without CondTSF. For each method, it shows the Mean Absolute Error (MAE) and Mean Squared Error (MSE) before and after applying CondTSF. The improvement rate is also shown. The data is averaged over five synthetic datasets.
In-depth insights#
Condensation Methods#
Dataset condensation techniques aim to create smaller, representative subsets of large datasets for training machine learning models, particularly deep neural networks. Existing methods primarily focus on classification tasks, where success is measured by whether the condensed dataset yields identical classification labels to the original. However, applying these methods directly to time series forecasting presents challenges due to the differences in performance evaluation. In time series forecasting, the focus shifts to minimizing the distance between predictions made by models trained on the original and condensed datasets. Therefore, new methods are needed that specifically address the optimization objective of time series forecasting, accounting for the different notions of similarity between predictions and the unique characteristics of time series data. Condensation methods for time series data must carefully consider preserving temporal dependencies and crucial patterns within the data, a crucial aspect not always addressed adequately in existing classification-centric approaches. Future research should explore novel loss functions, tailored to time series forecasting metrics, and methods for generating synthetic time series data that preserves temporal structure and distributional properties of the original data.
CondTSF Plugin#
The CondTSF plugin, as presented, addresses a critical limitation in applying dataset condensation techniques to time series forecasting. Existing methods, primarily designed for classification tasks, often fail to adequately handle the nuances of time series prediction. CondTSF directly tackles this by focusing on the optimization objective specific to time series forecasting, minimizing the distance between predictions from models trained on the full and condensed datasets. This is a significant improvement because it moves beyond simply matching labels (as in classification) to focus on the actual values predicted, making it far more suitable for forecasting accuracy. The one-line plugin nature of CondTSF makes it highly versatile and easily integrated into existing dataset condensation workflows. This approach is supported by both theoretical analysis and comprehensive experimental results showing consistent performance gains across numerous datasets, particularly at lower condensation ratios, demonstrating its practical utility and efficiency in managing the computational costs associated with training large models on extensive time series data.
TSF Optimization#
Optimizing time series forecasting (TSF) models involves improving their accuracy and efficiency. A key challenge lies in the high dimensionality and complexity of time series data, often requiring sophisticated algorithms. Effective optimization strategies leverage advanced techniques like gradient descent, stochastic gradient descent, and Adam, each with strengths and weaknesses depending on the specific dataset and model architecture. Regularization techniques help prevent overfitting, ensuring generalizability to unseen data. Hyperparameter tuning is critical, and often involves techniques like grid search or Bayesian optimization. Feature engineering also plays a significant role, involving transformations, selection, and potentially deep learning for automatic feature extraction. The choice of evaluation metrics (e.g., RMSE, MAE, MAPE) is vital for comparing models effectively. Ultimately, TSF optimization is an iterative process combining careful model selection, algorithmic choices, data preprocessing, and rigorous evaluation.
Experiment Results#
The heading ‘Experiment Results’ in a research paper warrants a thorough examination. It should present a clear and concise summary of the findings, avoiding excessive detail. Emphasis should be placed on the most significant results that directly support the paper’s central claims. These results need to be presented in a way that is both easy to understand and visually appealing, often through tables and graphs. Statistical significance must be clearly indicated, using appropriate metrics and error bars to showcase the reliability of the findings. The section must also clearly highlight whether the results met the study’s objectives and discuss any unexpected or noteworthy observations. A strong ‘Experiment Results’ section will demonstrate a clear understanding of experimental design and data analysis. Any limitations or sources of error in the experimentation process must be honestly and transparently acknowledged. Overall, the effectiveness of this section rests on its ability to convincingly communicate the core results to a reader, establishing the paper’s validity and reliability.
Future Directions#
Future research could explore CondTSF’s efficacy with more complex models beyond DLinear, investigating its adaptability and performance gains. Extending CondTSF to handle diverse time series characteristics (e.g., varying frequencies, seasonality, noise levels) is crucial for broader applicability. Investigating the theoretical underpinnings of CondTSF further, particularly regarding its interaction with different model architectures, optimization objectives, and data distributions would be valuable. A deeper analysis of the trade-offs between condensation ratio and model performance, and potentially a more adaptive approach to ratio selection, is another important avenue. Finally, comparing CondTSF with other condensation techniques on a larger scale with more datasets and diverse evaluation metrics would provide robust validation. and broaden our understanding of its effectiveness and limitations.
More visual insights#
More on figures

The figure illustrates the overall process of dataset condensation using CondTSF. It starts with a full training dataset ‘f’, from which an initial synthetic dataset ’s’ is randomly sampled. This ’s’ is then optimized in two stages. The first stage involves Parameter Matching, which focuses on minimizing the distance between the full dataset’s model parameters (θf) and the synthetic dataset’s model parameters (θs) – this is Gradient Term Optimization. The second stage involves CondTSF, which minimizes the label error (Llabel) by optimizing the Value Term. This two-stage process results in a distilled synthetic dataset ’s*’, which is expected to be a more effective and efficient representation of the original dataset ‘f’ for training.

The figure compares the evaluation metrics of dataset condensation methods between classification and time series forecasting tasks. The left panel illustrates that for classification, successful condensation is indicated by identical predicted labels between models trained on full and condensed datasets, irrespective of the distribution of output logits. In contrast, the right panel shows that for time-series forecasting, successful condensation requires similar predictions across all data points, emphasizing a stricter evaluation criterion. The right panel also presents a comparison of the performance of several existing methods with and without CondTSF (Condensation for Time Series Forecasting), a proposed one-line plugin that aims to improve performance, especially at low condensation ratios.

This figure compares the evaluation metrics of dataset condensation methods between classification tasks and time series forecasting. The left panel illustrates how the evaluation differs between these two types of tasks. In classification, similar predictions are judged based on whether models trained on the full dataset and synthetic dataset assign the same label to the same input; differences in the output probability distributions are not considered. Time series forecasting, however, demands that all data points in the prediction are similar, creating a more stringent evaluation. The right panel shows a comparison of the performance of previous dataset condensation methods with and without CondTSF, demonstrating CondTSF’s improvement.

This figure compares the evaluation methods for dataset condensation between classification and time series forecasting tasks. The left panel shows that for image classification, similar predictions are considered good synthetic data if the model trained on the synthetic dataset produces the same predicted label as the model trained on the full dataset, irrespective of variations in the output logits distribution. However, for time series forecasting, predictions must have low pointwise distance between the models trained on the synthetic and full datasets to be considered good synthetic data. The right panel displays the improved performance of previous dataset condensation methods when CondTSF is integrated, showcasing its effectiveness across various datasets, especially at low condensation ratios.

The figure on the left demonstrates how the evaluation of dataset condensation differs between classification and time series forecasting tasks. In classification, similar predictions are deemed successful if the models output the same class labels regardless of differences in the output probability distributions. However, in time series forecasting, successful condensation requires similar predictions across all data points. The figure on the right showcases a comparison of various dataset condensation methods with and without the proposed CondTSF plugin, highlighting the improvement in performance achieved by incorporating CondTSF.

The figure is composed of three subfigures. The left subfigure shows the difference in how dataset condensation is evaluated for classification versus time series forecasting tasks. In classification, the success is measured by whether the model trained on a condensed dataset produces the same class label as the model trained on the full dataset. In time series forecasting, however, the success is based on the similarity of the entire prediction curve produced by models trained on the condensed and full datasets. The right subfigure demonstrates the improved performance achieved by adding CondTSF (a novel one-line plugin proposed in the paper) to existing dataset condensation methods. It shows that performance across multiple time-series datasets improves significantly for various methods, especially at lower condensation ratios.

The figure showcases a comparison between dataset condensation evaluation methods for classification and time series forecasting. The left panel illustrates the key difference: for classification, similar predictions mean identical class labels, regardless of the logits distribution. In contrast, for time series forecasting, similar predictions require similar values for all data points. The right panel demonstrates how the proposed CondTSF plugin improves performance across different datasets and methods, particularly at lower condensing ratios, compared to traditional dataset condensation methods.

This figure shows the difference in evaluating dataset condensation between classification and time series forecasting tasks. The left panel illustrates that for classification, similar predictions are considered well-distilled if the models trained on full and synthetic datasets produce identical labels regardless of the output distribution differences. However, for time series forecasting, well-distilled synthetic data requires similar predictions across all data points. The right panel demonstrates the performance improvement using CondTSF across various dataset condensation methods on eight commonly used time series datasets. CondTSF consistently boosts performance across all methods and datasets, especially at low condensation ratios.

The left panel of Figure 1 contrasts the evaluation metrics for dataset condensation applied to classification versus time series forecasting tasks. For classification, successful condensation is determined by whether the model trained on the synthetic data predicts the same class labels as the model trained on the full data, regardless of the distribution of output logits. However, for time series forecasting, successful condensation requires that the predictions from both models are point-wise similar across all time steps. The right panel displays the comparative performance of various dataset condensation methods, both with and without the CondTSF plugin, demonstrating improved performance (lower test error) across multiple time series datasets when CondTSF is used.
This figure consists of two parts. The left part shows the difference in the evaluation of dataset condensation for classification tasks and time series forecasting tasks. In classification, similar predictions are considered good synthetic data if the model trained with the synthetic dataset yields identical labels with the model trained on the full dataset. However, for time series forecasting, the distance between the predictions of the two models determines the quality of synthetic data; similar predictions for all data points indicate well-distilled data. The right part shows the comparison of performance of different methods with and without CondTSF. In this experiment, CondTSF consistently improved the performance of previous dataset condensation methods, across all datasets and condensing ratios.

This figure compares the evaluation metrics for dataset condensation between classification tasks and time series forecasting tasks. The left panel illustrates that in classification, successful condensation is determined by whether the model trained on the condensed dataset predicts the same class labels as the model trained on the full dataset. The right panel showcases how CondTSF improves the performance of existing dataset condensation methods by reducing the distance between predictions made by the models trained on the condensed and full datasets. This reduction is particularly significant at low condensation ratios.
The figure is composed of three subfigures. The left subfigure illustrates the difference between evaluating synthetic data for image classification and time series forecasting. Image classification considers synthetic data well-distilled if models trained on full and synthetic datasets produce identical labels, regardless of output distribution. Conversely, time series forecasting requires similar predictions across all data points, making evaluation more rigorous. The right subfigure presents performance comparisons of several dataset condensation methods, with and without the proposed CondTSF plugin. The results show consistent improvement by incorporating CondTSF, especially at low condensing ratios.
More on tables

This table presents the results of applying various dataset condensation methods with and without CondTSF, a novel plugin designed to enhance dataset condensation for time series forecasting. The table shows the Mean Absolute Error (MAE) and Mean Squared Error (MSE) for each method, both with and without CondTSF applied. The reduction in error is also reported as a percentage, indicating how much CondTSF improved performance. Eight commonly used time series datasets are used in the evaluation, and five synthetic datasets are created for each dataset condensation method. The data presented are the averages and standard deviations across these five synthetic datasets.

This table presents the results of using different dataset condensation methods on eight time series datasets. It compares the performance of these methods with and without the CondTSF plugin. The table shows the MAE and MSE for each method, with and without CondTSF, and the percentage decrease in test error achieved by CondTSF. The results are averaged over five separate distillations of each dataset.

This table presents the results of applying various dataset condensation methods, with and without CondTSF, to eight time series datasets. It shows the Mean Absolute Error (MAE) and Mean Squared Error (MSE) for each method. The ‘↓’ symbol indicates the percentage decrease in test error achieved by using CondTSF. The table demonstrates the improvement CondTSF brings to the accuracy of condensation methods across different datasets.
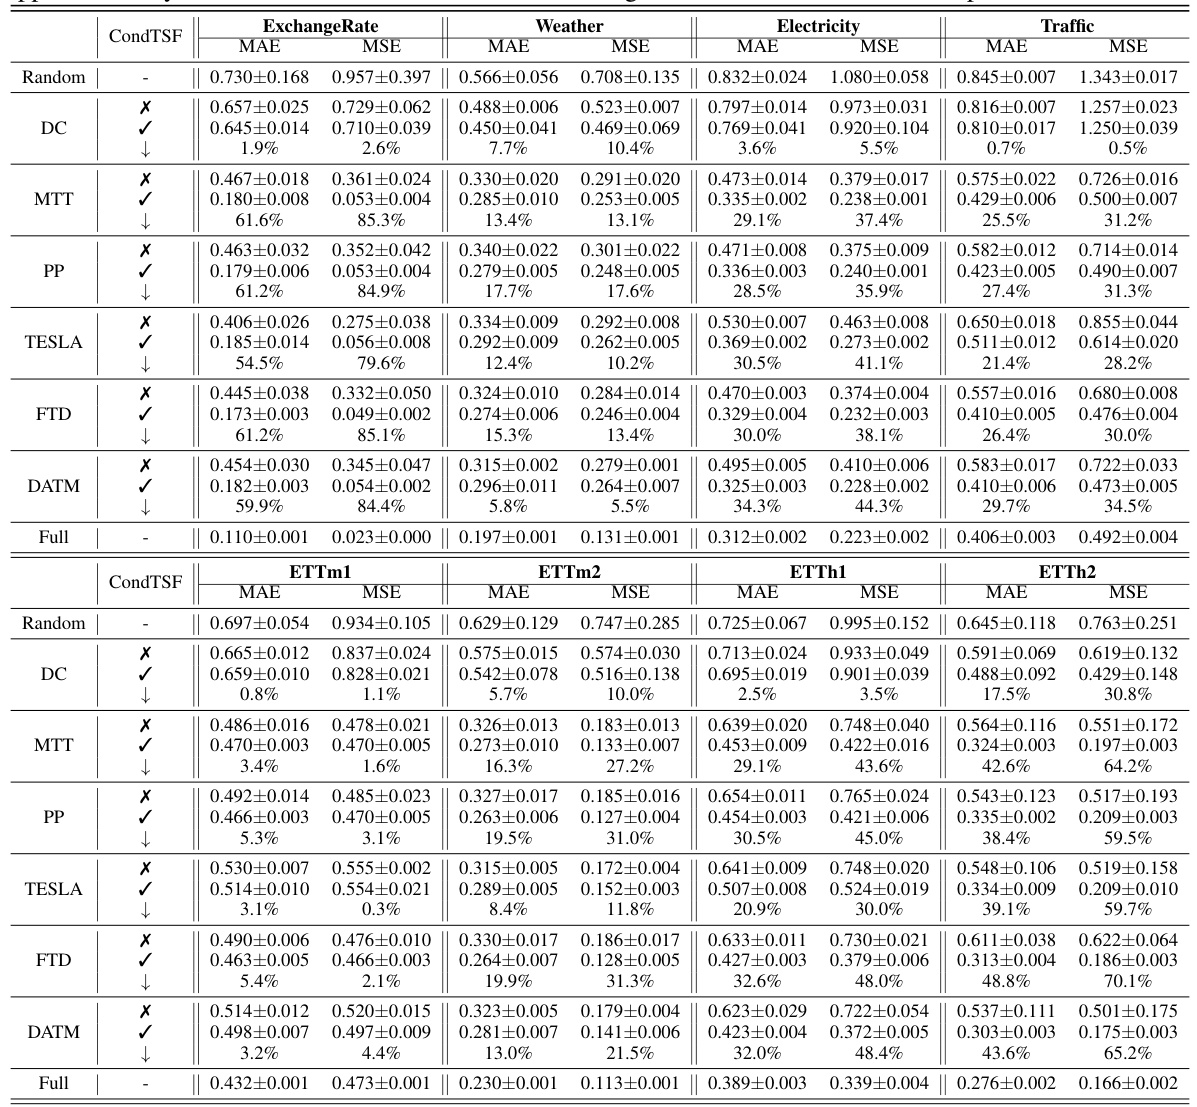
This table presents the results of applying various dataset condensation methods, both with and without the CondTSF plugin, on eight different time series datasets. The table displays the Mean Absolute Error (MAE) and Mean Squared Error (MSE) for each method and dataset, along with the percentage decrease in test error achieved by using CondTSF. The results are averaged over five trials and include standard deviations for each dataset. This table shows the effectiveness of CondTSF in improving the performance of various dataset condensation methods across diverse time series datasets.

This table presents the results of dataset condensation experiments using various methods, with and without the CondTSF plugin. It shows the Mean Absolute Error (MAE) and Mean Squared Error (MSE) for five different datasets (ExchangeRate, Weather, Electricity, Traffic, ETTm1, ETTm2, ETTh1, ETTh2) and different condensation techniques (Random, DC, MTT, PP, TESLA, FTD, DATM). The ‘↓’ indicates the percentage decrease in test error achieved by using CondTSF. The table summarizes the average and standard deviation of these metrics across five separate distillations for each method and dataset.
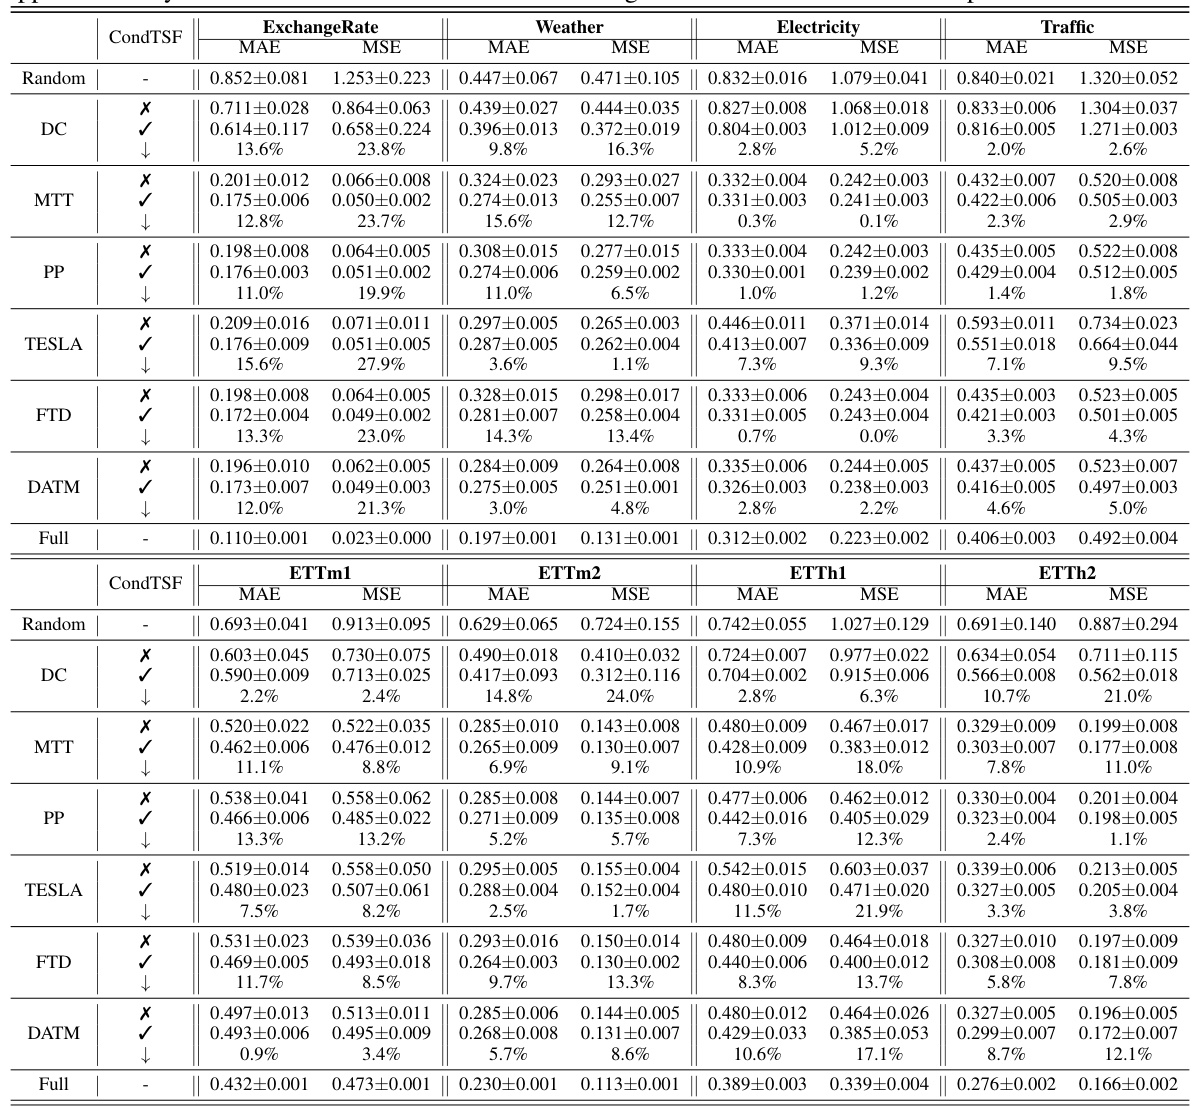
This table presents the results of applying various dataset condensation methods with and without the CondTSF plugin. It shows the mean absolute error (MAE) and mean squared error (MSE) for each method on eight different time series datasets. The ‘↓’ column indicates the percentage decrease in error when CondTSF is used. The table helps evaluate the effectiveness of CondTSF in improving the performance of different dataset condensation techniques.

This table presents the results of dataset condensation experiments using various methods, with and without the CondTSF plugin. It shows the Mean Absolute Error (MAE) and Mean Squared Error (MSE) for several time series datasets, broken down by method (with and without CondTSF). The percentage decrease in error achieved by using CondTSF is also displayed. The table helps demonstrate the effectiveness of CondTSF in improving the performance of different dataset condensation methods, especially at lower condensation ratios.

This table presents the results of applying different dataset condensation methods, with and without the CondTSF plugin, to eight time series datasets. The table shows the Mean Absolute Error (MAE) and Mean Squared Error (MSE) for each method and dataset, along with the percentage decrease in test error achieved by adding CondTSF. This illustrates the effectiveness of CondTSF in improving the performance of existing dataset condensation methods.
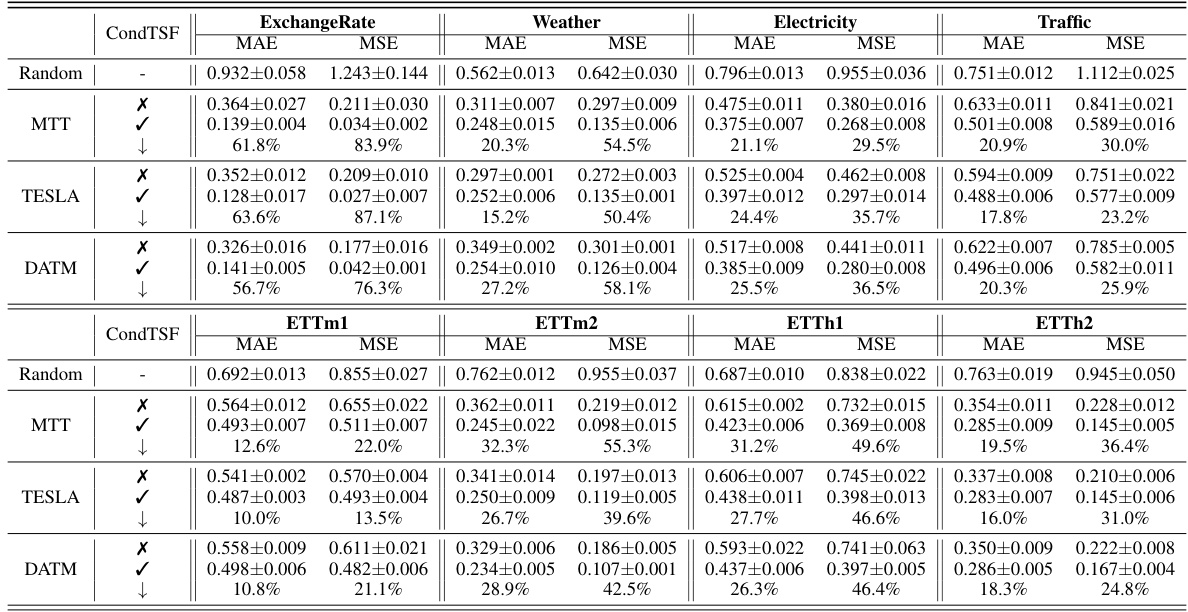
This table presents the performance comparison of various dataset condensation methods on eight time series datasets, with and without the CondTSF plugin. It shows the Mean Absolute Error (MAE) and Mean Squared Error (MSE) for each method, indicating the effectiveness of CondTSF in improving the performance of existing methods, particularly at low condensation ratios. The ‘↓’ symbol indicates the percentage decrease in test error achieved by incorporating CondTSF.

This table presents the results of applying several dataset condensation methods, with and without the CondTSF plugin, on five different time series datasets. For each method and dataset, the Mean Absolute Error (MAE) and Mean Squared Error (MSE) are reported before and after CondTSF is used. The percentage reduction in test error achieved by incorporating CondTSF is also shown. This allows comparison of the effectiveness of CondTSF across various methods and datasets.
Full paper#


