↗ OpenReview ↗ NeurIPS Homepage ↗ Chat
TL;DR#
Many causal inference studies struggle with unobserved confounding variables, especially when dealing with textual data. Existing methods often require labeled data for confounders, which can be costly and time-consuming to obtain. This limits the applicability of these methods to real-world scenarios where such data may not be available due to privacy constraints or the difficulty of obtaining high-quality labels.
This research introduces a novel causal inference method that utilizes two instances of pre-treatment text data and infers proxies for unobserved confounders using zero-shot models. This approach makes it possible to use the proximal g-formula without relying on labeled confounder data. The authors also include an odds ratio falsification heuristic that assesses proxy validity, enhancing the reliability of effect estimations. The method is evaluated in both synthetic and semi-synthetic settings, showing promising results in situations where structured data is scarce or difficult to collect.
Key Takeaways#
Why does it matter?#
This paper is important because it presents a novel method for causal inference using text data when confounders are unobserved, a common challenge in various fields. It addresses the limitations of existing methods that require labeled data, offering a practical approach with real-world applications. The proposed method opens new avenues for causal analysis in situations where obtaining structured data is difficult or impossible, which is relevant to the growing body of research on text-based causal inference.
Visual Insights#

This figure illustrates the pipeline for proximal causal inference with text data. It starts by filtering pre-treatment text data and selecting two distinct instances for each individual. Zero-shot models (LLM-1 and LLM-2) then infer proxies (Z and W) from these text instances. An odds ratio heuristic checks the validity of the proxies. If valid, the proximal g-formula is used to estimate the causal effect; otherwise, the analysis stops. The bottom row provides a specific example using MIMIC-III clinical notes.

This table presents the results of fully synthetic experiments designed to test the proposed causal inference method. The true average causal effect (ACE) is set to 1.3. The table compares different scenarios, including using one or two zero-shot models (P1M, P2M) and whether the same or different text instances were used to generate proxies (indicated by ‘same’). The ‘passed’ column indicates whether the odds ratio heuristic successfully detected when the identification conditions for proximal causal inference were satisfied. The results demonstrate the importance of using different text instances and the effectiveness of the proposed heuristic in identifying when the method will produce biased results.
In-depth insights#
Proximal Causal Text#
The concept of “Proximal Causal Text” merges causal inference with unstructured text data. It addresses a critical limitation in causal analysis where crucial confounding variables are unobserved. The approach leverages zero-shot learning models to infer proxies for these unmeasured confounders directly from text, circumventing the need for costly and time-consuming manual labeling. This is particularly valuable when dealing with sensitive data or when structured data is scarce. The core idea is to use multiple instances of pre-treatment text to generate two proxies, ensuring that these proxies satisfy certain independence conditions required for proximal causal inference. A key innovation lies in the development of an odds ratio heuristic to assess the validity of inferred proxies before proceeding with causal effect estimation, addressing the challenges of untestable assumptions inherent in proximal causal inference. This methodological advance holds the potential to broaden causal inference’s reach, particularly in domains rich with textual data, offering a novel and efficient means of incorporating unlabeled text data into causal effect estimation.
Zero-Shot Proxies#
The concept of “Zero-Shot Proxies” in causal inference with text data represents a significant advancement. It cleverly addresses the challenge of unobserved confounders, a common obstacle in observational studies, by leveraging the power of large language models (LLMs). Instead of relying on traditional supervised methods that need labeled data for training, zero-shot learning allows the models to directly predict proxy variables from raw text without prior training on the confounders themselves. This is crucial when labeled data is scarce, expensive, or impossible to obtain due to privacy or annotation costs. The effectiveness hinges on the ability of LLMs to capture relevant information within text that is highly correlated with the unobserved confounder. The use of two distinct instances of pre-treatment text and two separate LLMs to generate the proxies ensures that the identification conditions for proximal causal inference are met. This dual approach also provides a degree of robustness against potential biases that might arise from reliance on a single proxy or model. Overall, zero-shot proxies represent a promising approach to broaden the applicability of proximal causal inference by utilizing the rich information hidden in unstructured textual data.
Odds Ratio Heuristic#
The Odds Ratio Heuristic section presents a crucial diagnostic tool for assessing the validity of the proposed text-based causal inference method. It leverages the fact that under the identification assumptions of proximal causal inference, the conditional odds ratio of the two inferred proxies given observed covariates should be close to one. The heuristic proposes to calculate a confidence interval for this odds ratio from the data. If the interval contains one, it indicates that the inferred proxies likely satisfy the identification assumptions. However, a value significantly different from one suggests potential violations. Importantly, the heuristic tackles the problem of untestable assumptions, a major limitation of proximal causal inference, offering a practical method for evaluating the plausibility of the analysis. This approach provides a safety net against proceeding with downstream effect estimation based on potentially flawed proxies, ultimately enhancing the reliability and validity of the text-based causal inference framework.
MIMIC-III & Results#
The section ‘MIMIC-III & Results’ would likely detail the application of the proposed method to the MIMIC-III dataset, a rich resource of clinical notes. The results would demonstrate the method’s performance in a real-world setting, evaluating its ability to accurately estimate causal effects despite the presence of unobserved confounders. Key metrics such as bias, confidence intervals, and the odds ratio heuristic’s success rate would be reported, providing crucial evidence for the method’s validity. The discussion should analyze the impact of various factors (e.g., choice of zero-shot models, text pre-processing) on the results. Comparing the findings against those from synthetic data would highlight the strengths and limitations of the approach when applied to complex, real-world data. Specific attention should be paid to situations where the heuristic correctly identifies biased estimates, offering valuable insights into its effectiveness as a diagnostic tool for proximal causal inference. The overall analysis should aim to provide a comprehensive assessment of the proposed method’s practical utility for causal inference using text data.
Future Work#
The paper’s “Future Work” section suggests several promising avenues. Improving the zero-shot classifiers is paramount; better predictive accuracy directly enhances the reliability of the causal estimates. The authors also aim to expand the proxy inference method to incorporate more models, potentially creating more robust estimates by combining multiple perspectives. Addressing the limitations of the odds ratio heuristic through more sophisticated statistical modeling is crucial to make it more universally applicable. Finally, the authors plan to explore scenarios with categorical confounders and investigate methods that incorporate more diverse data modalities beyond text. The focus on improving proxy prediction, refining the heuristic and expanding the model’s applicability to different data types demonstrates a thoughtful approach to future research.
More visual insights#
More on figures

Figure 2 shows two causal directed acyclic graphs (DAGs). Graph (a) depicts a scenario with an unmeasured confounder, U, affecting both the treatment (A) and the outcome (Y). This illustrates a common challenge in causal inference where bias can arise from unobserved variables. Graph (b) represents a DAG compatible with the assumptions of proximal causal inference. This approach uses two proxies, Z and W, for the unmeasured confounder to mitigate the bias caused by U. The relationships between the variables in (b) ensure that the causal effect of A on Y can be identified despite the presence of the unobserved confounder.

This figure showcases four causal directed acyclic graphs (DAGs), each representing a different approach to inferring text-based proxies for an unobserved confounder (U) in a causal inference setting. The graphs illustrate various methods of using pre-treatment text data (Tpre) and zero-shot models to generate proxy variables (Z and W) for the unobserved confounder. The differences lie in how many text instances are used, whether the same or different zero-shot models are used for each proxy, and how the proxies are incorporated into the causal inference framework. The figure highlights the shortcomings of simpler approaches (a, b, c) while illustrating the preferred method (d), which uses two distinct instances of pre-treatment text (Tpre1, Tpre2) with two separate zero-shot models to generate the proxies Z and W, thus fulfilling the conditions required for proximal causal inference.

This figure shows the results of applying the proposed method and two other methods to estimate the average causal effect (ACE) in semi-synthetic settings. The x-axis represents the different methods used, including a backdoor adjustment with a single proxy, and the proposed methods P1M and P2M. The y-axis shows the estimated ACE. Points represent point estimates and bars represent 95% confidence intervals. The green dashed line indicates the true ACE. The √ symbol indicates settings that passed a proposed odds ratio heuristic designed to help assess the validity of the model’s assumptions. The figure visually demonstrates the effectiveness of the proposed method (P2M) compared to the simpler methods, especially when the odds ratio heuristic passes. The results highlight that using the inferred proxies directly in backdoor adjustment produces biased estimates.

This figure shows a causal directed acyclic graph (DAG) illustrating a scenario where valid proxies can be inferred using both pre-treatment and post-treatment text data. The graph depicts the relationships between pre-treatment text (Tpre), post-treatment text (Tpost), observed confounders (C), unobserved confounder (U), treatment (A), outcome (Y), and the two inferred proxies (W and Z). The dashed green arrows represent the conditional independence assumptions required for proximal causal inference, specifically that the proxies do not depend on the outcome (P3) and that one proxy (W) does not depend on the treatment (P2). The figure demonstrates that even with post-treatment text, the identification conditions for proximal causal inference can still be met if the pre- and post-treatment text are used to generate two separate proxies that satisfy the conditional independence constraints.

This figure is a causal directed acyclic graph (DAG) illustrating how to generate valid proxies using one instance of actionable text data and another instance of non-actionable text data. It shows that even if one proxy is influenced by the treatment (Tact), the independence conditions for proximal causal inference can still be met if the other proxy is based solely on pre-treatment data (Tpre). The figure expands on previous ‘gotchas’ of using text data in proximal causal inference, demonstrating a valid design.

This figure presents four different causal diagrams illustrating various methods for generating text-based proxies using pre-treatment text data. Each diagram shows different relationships between pre-treatment text (Tpre), the unmeasured confounder (U), treatment (A), outcome (Y), and two proxies (W and Z). The diagrams highlight the potential pitfalls of using a single text instance or a single model to create proxies, underscoring the importance of employing two distinct text instances and two zero-shot models to infer the proxies, ensuring the independence of the proxies conditional on observed covariates and the unmeasured confounder. The final diagram (d) depicts the authors’ recommended method, which successfully satisfies these crucial conditions and leads to unbiased causal effect estimates.

Panel (a) shows a causal directed acyclic graph (DAG) representing a scenario with unmeasured confounding. The variable U represents an unobserved confounder that affects both the treatment (A) and outcome (Y). Panel (b) illustrates a DAG that satisfies the identification conditions for proximal causal inference. Two proxies, W and Z, are used to estimate the effect of the treatment on the outcome, accounting for the unobserved confounder U.

This figure illustrates the pipeline of the proposed proximal causal inference method using text data. It starts by filtering pre-treatment text data and selecting two distinct instances for each individual. Zero-shot models then infer two proxies from these instances. An odds ratio heuristic checks the validity of the proxies. If successful, the proximal g-formula is used to estimate the causal effect. An example using MIMIC-III clinical notes is shown.
More on tables

This table presents the results of fully synthetic experiments designed to evaluate the proposed method’s performance under different conditions. The true average causal effect (ACE) is set to 1.3. The table compares four different estimation pipelines: P1M (using one zero-shot model), P1M_same (using one zero-shot model but with both proxies inferred from the same text instance), P2M (using two zero-shot models), and P2M_same (using two zero-shot models but with both proxies inferred from the same text instance). For each pipeline, the table reports the estimated ACE, bias, confidence interval, and whether the odds ratio heuristic passed or failed. The ‘same’ condition simulates the scenario where both proxies are derived from identical pre-treatment text, violating the independence assumptions of the proximal g-formula. The results demonstrate the impact of satisfying the proximal causal inference conditions and the effectiveness of the proposed odds ratio heuristic in identifying potentially biased estimates.

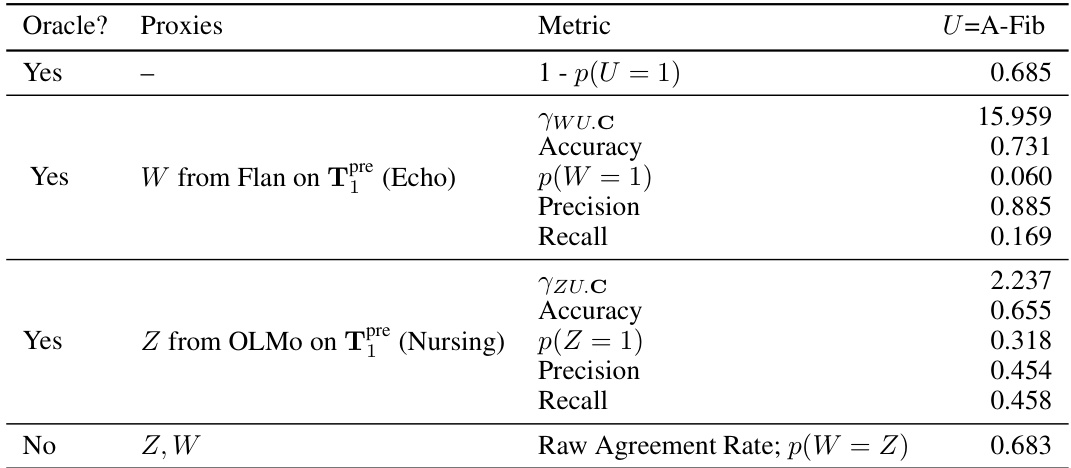
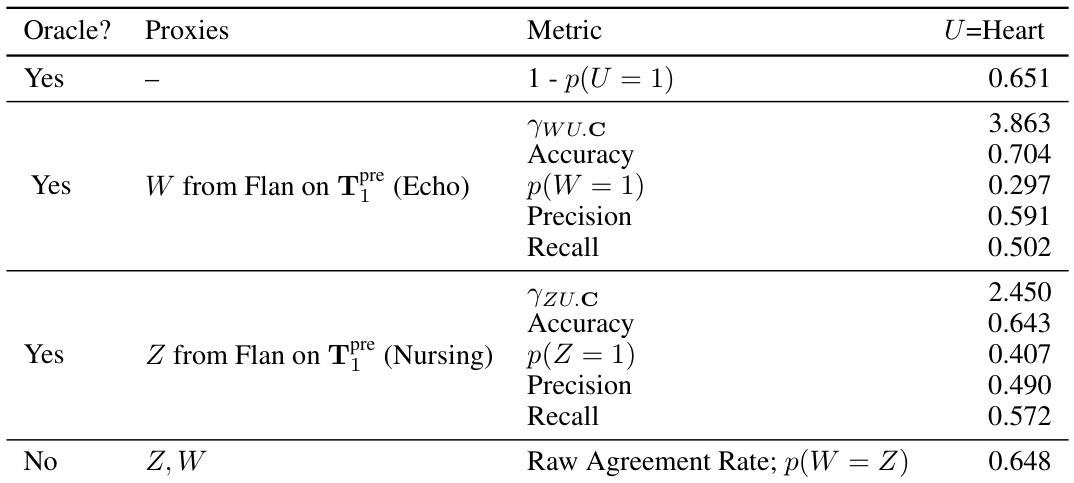
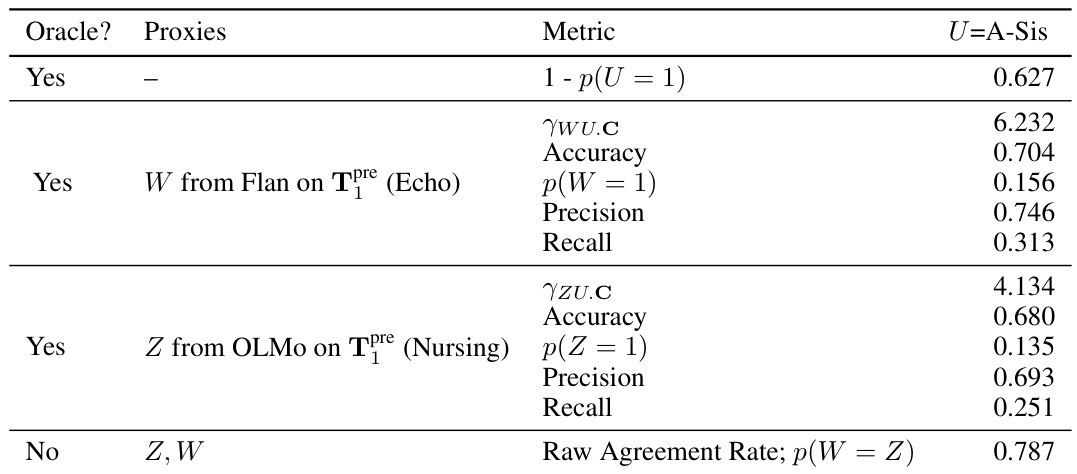
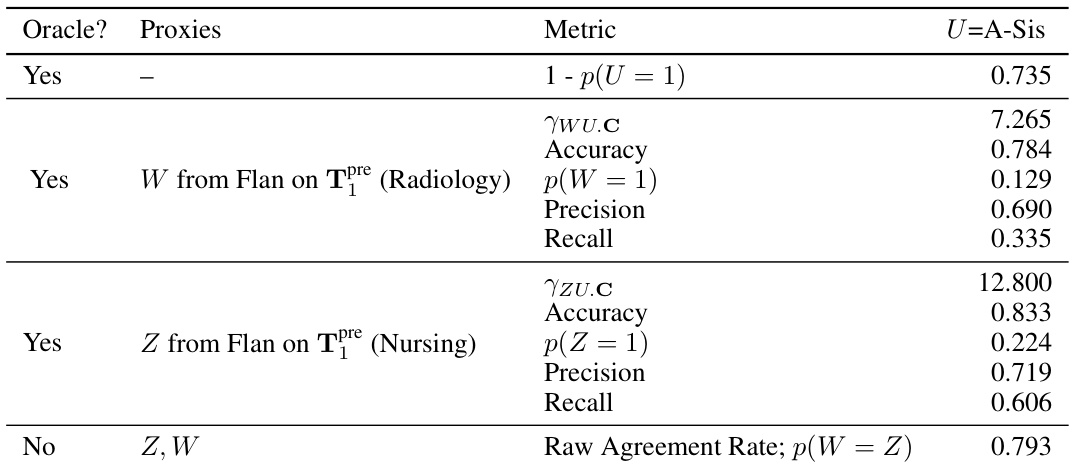
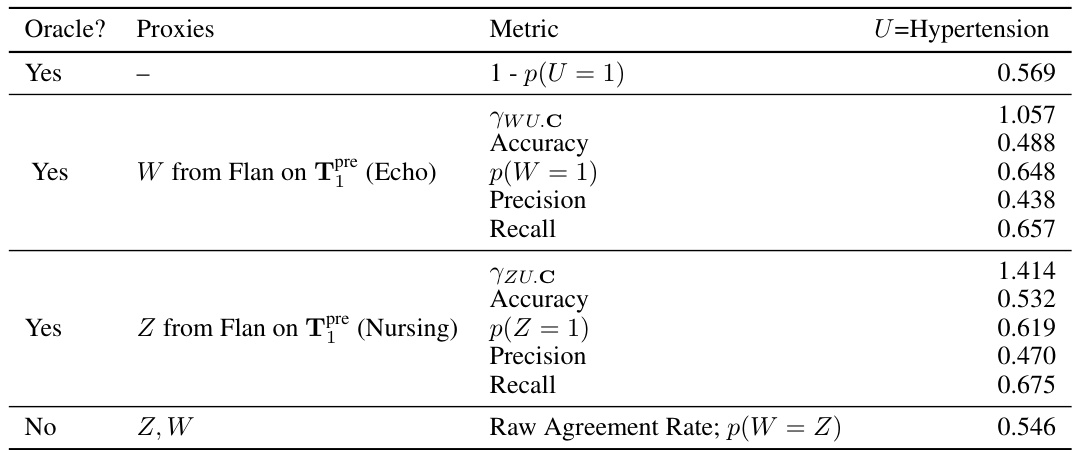
This table presents the results of a semi-synthetic experiment designed to evaluate the performance of the proposed odds ratio heuristic. It shows the calculated odds ratios (ywz.c) and the oracle odds ratios (ywz.uc) for different combinations of note categories used as input text. The ywz.c represents the estimated odds ratio based on the observed data while ywz.uc is the true odds ratio that would be calculated if the unobserved confounder (U) was known. The table also indicates whether the odds ratio heuristic successfully identified suitable proxies (indicated by a checkmark). The experiment was designed to test the ability of the heuristic to accurately identify scenarios where the identification assumptions for proximal causal inference are violated.

This table presents the results of training several supervised classifiers (linear logistic regression with bag-of-words features) to predict various diagnoses from MIMIC-III data. Different note categories (ECG, Echo, Nursing, Radiology) were used as input for each diagnosis. The F1-score, accuracy, precision, and recall are shown for each classifier. A cutoff F1-score of 0.7 was applied to select diagnoses for further processing using zero-shot classifiers in downstream analysis. Diagnoses with at least two note categories above the threshold are bolded, representing those used as oracle confounders (U) in later analyses.

This table presents the results of fully synthetic experiments where the true average causal effect (ACE) is 1.3. The results are categorized based on whether the proposed odds ratio heuristic passed or failed. The ‘same’ column indicates whether the same text instance was used to infer both proxies (W and Z) which is related to one of the ‘gotchas’ discussed in the paper. The table shows that the proposed method produces accurate estimates when the heuristic passes and biased estimates when it fails. This demonstrates the efficacy of the heuristic in flagging potential issues with the estimation process.

This table presents the results of fully synthetic experiments where the true average causal effect (ACE) is 1.3. The table compares different methods for estimating the ACE using text data. The ‘passed’ column indicates whether the proposed odds ratio heuristic successfully identified settings with valid proxies, and the ‘same’ row demonstrates the effect of using the same text instance for both proxy estimations, illustrating the importance of using distinct text instances for better accuracy. Bias and confidence interval coverage are shown to highlight the effectiveness of the proposed method.

This table presents the results of fully synthetic experiments where the true average causal effect (ACE) is 1.3. It compares the performance of different methods (P1M, P2M, and their ‘same’ variants) for estimating the ACE. The ‘same’ variants illustrate the ‘Gotcha #3’ scenario where both proxies are derived from the same text instance. The table indicates whether the odds ratio heuristic passed or failed for each method, indicating the validity of the proxy variables. A ‘Yes’ under CI Cov indicates the confidence intervals contain the true ACE.

This table presents the results of fully synthetic experiments with a true average causal effect (ACE) of 1.3. It compares four different experimental settings: two using a single zero-shot model (P1M) and two using two zero-shot models (P2M), each with and without the violation of condition P1 (using the same instance of text for both proxies). The table shows the estimated ACE, bias, confidence interval (CI), and whether the confidence interval covers the true ACE. It also indicates whether the odds ratio heuristic successfully flagged instances where the identification conditions of the proximal g-formula were violated.

This table presents the results of fully synthetic experiments designed to test the proposed method. The true average causal effect (ACE) is set to 1.3. The table compares different scenarios, including whether the odds ratio heuristic passed or failed (indicating whether the inferred proxies satisfied identification conditions). It also distinguishes cases where the same text instance was used to infer both proxies (Gotcha #3), which is expected to lead to biased results.
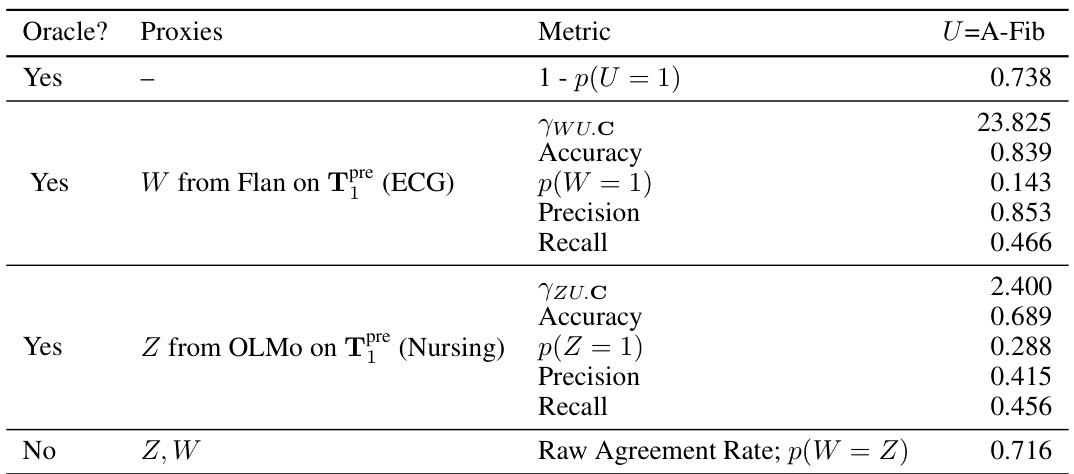
This table presents the results of semi-synthetic experiments evaluating the performance of the proposed odds ratio heuristic. It compares the estimated odds ratio from the text-based proxies (γwz.c) with the true odds ratio (γwz.uc), calculated using the actual unmeasured confounder (U). The table shows results for different combinations of clinical notes (categories of notes) used to generate the proxies, indicating whether the heuristic correctly identified cases where the assumptions for the proximal g-formula were met. The ‘√’ symbol indicates that the heuristic correctly identified the cases where the identification conditions are satisfied.

This table presents the results of fully synthetic experiments evaluating the proposed method for estimating the average causal effect (ACE). The true ACE is set to 1.3. The table compares four different settings: two using one zero-shot model (P1M) and two using two zero-shot models (P2M). Within each model type, one setting uses distinct instances of text to infer proxies, while the other uses the same instance. The results are analyzed based on whether the odds ratio heuristic passes or fails, and a check mark (✓) indicates whether the setting passes the test. This helps analyze the effect of using distinct text instances and the performance of the odds ratio heuristic in flagging biased estimates.
This table presents the results of fully synthetic experiments designed to evaluate the proposed method and compare it with other methods. The true average causal effect (ACE) is set to 1.3. The table shows the estimated ACE, bias, confidence interval, and whether the odds ratio heuristic passed for various settings. The ‘same’ column indicates whether the same text instance was used to infer both proxies (W and Z), demonstrating a potential pitfall of the method.
This table presents the results of fully synthetic experiments to evaluate the proposed method. It shows the estimated average causal effect (ACE), bias, confidence intervals, and coverage for different experimental settings. The settings are varied based on whether the odds ratio heuristic passes or fails, and whether the same or different text instances are used to infer proxies. The true ACE is 1.3, and the results indicate whether the method produces low-bias estimates with good confidence interval coverage when the heuristic passes.

This table presents the results of fully synthetic experiments where the true average causal effect (ACE) is 1.3. It shows estimates of the ACE obtained using different methods, categorized by whether the odds ratio heuristic passed (indicating conditions for proximal causal inference are likely met) or failed. The ‘same’ setting highlights an experiment where both proxies were inferred from the same text instance, illustrating a specific ‘gotcha’ (pitfall) scenario discussed in the paper.

This table presents results from fully synthetic experiments where the true average causal effect (ACE) is known to be 1.3. The table compares four different methods for estimating the ACE, each differing in how they obtain proxies for the unmeasured confounder using zero-shot methods and text data. The table shows the estimated ACE, bias, confidence interval, and whether the odds ratio heuristic (a diagnostic test) passed or failed for each method. The ‘same’ designation indicates that the same text instance was used to infer both proxies, highlighting a methodological gotcha discussed in the paper.
This table presents the results of fully synthetic experiments designed to evaluate the proposed method and compare it to several alternative approaches. The true average causal effect (ACE) is set to 1.3. The table highlights whether each setting passed or failed a proposed odds ratio heuristic, indicating whether the estimated ACE is likely to be biased or not. The ‘same’ column indicates experiments where both proxies were derived from the same instance of text (a design flaw). The results demonstrate the importance of the proposed method in achieving unbiased estimates of the causal effect.

This table presents results from a fully synthetic experiment with a true average causal effect (ACE) of 1.3. It compares four different scenarios: two using a single zero-shot model (P1M) and two using two zero-shot models (P2M). Each scenario is further subdivided based on whether the same or different text instances were used to generate the proxies. The ‘passed’ column indicates whether the odds ratio heuristic, a method for validating the proxy variables, was successful. The table demonstrates that using two zero-shot models and distinct text instances is crucial for accurate ACE estimation, as evidenced by lower bias in the scenarios where the heuristic is successful.

This table presents the results of fully synthetic experiments designed to test the proposed method and compare it to alternative methods. The true average causal effect (ACE) is set to 1.3. The table shows the estimated ACE, bias, and confidence interval coverage for different scenarios: using one or two zero-shot models (P1M, P2M), and using the same or different text instances to infer proxies. The ‘passed’ column indicates whether the proposed odds ratio heuristic successfully flagged when to use the inferred proxies.
This table presents the results from fully synthetic experiments where the true average causal effect (ACE) is 1.3. It compares four different methods for estimating the ACE. The table shows the estimated ACE, bias, confidence interval (CI), and whether the CI covers the true ACE. The methods are categorized by whether they employ one or two zero-shot models, and whether the same or different instances of text data are used to infer the proxies. The table also indicates whether each method passed an odds ratio heuristic designed to help identify valid proxies. The ‘+same’ entries in the table indicate that the same text instance was used for inferring both proxies (W and Z), illustrating a common pitfall in the approach.

This table presents results from a fully synthetic experiment designed to evaluate the proposed method. The experiment manipulates several factors (using one or two zero-shot models and whether the same text instance is used for proxy creation) and assesses their impact on the accuracy of the average causal effect (ACE) estimation. The ‘passed’ or ‘failed’ status indicates whether the odds ratio heuristic (a diagnostic tool) identified valid proxy variables in each setting.
This table presents results from a fully synthetic experiment where the true average causal effect (ACE) is 1.3. It compares four different scenarios for estimating the ACE using the proposed method. The scenarios vary in whether the odds ratio heuristic was passed (indicating valid proxies) and whether the same or different instances of pre-treatment text were used for generating proxies. The results highlight the importance of using the heuristic and distinct text instances for obtaining unbiased ACE estimates.

This table presents the results of fully synthetic experiments designed to test the proposed method for proximal causal inference with text data. The true average causal effect (ACE) is set to 1.3. The table compares different scenarios (P1M, P2M, and their ‘same’ variants where the same text is used for both proxies), indicating whether the odds ratio heuristic passed or failed. The ‘same’ setting is a control designed to illustrate the issues of using identical text instances for both proxy creation. The results highlight the importance of the proposed heuristic in flagging cases where the assumptions underlying the method are violated and in identifying instances with low bias.
Full paper#


